Nano-node: Node v.11.2 died after 3h
Description of bug:
Node just died without messages in the log after running for 3 hours. Compiled from git master; commit 84a6b5160e2d81cf86b23a81f5a52d29553e7287
Additional information you deem important (e.g. issue happens only occasionally):
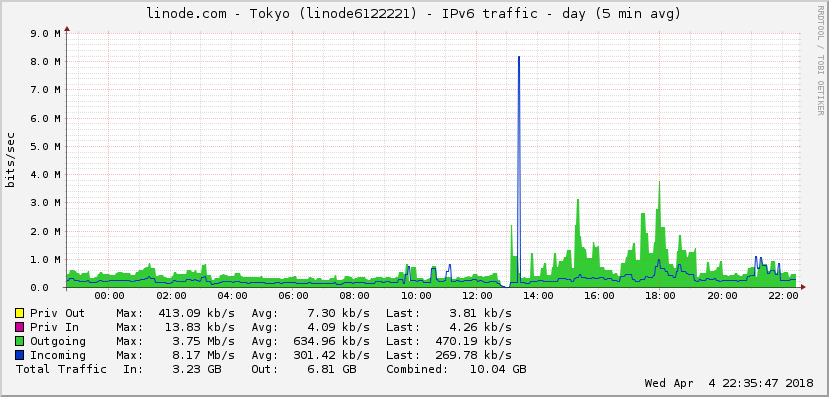
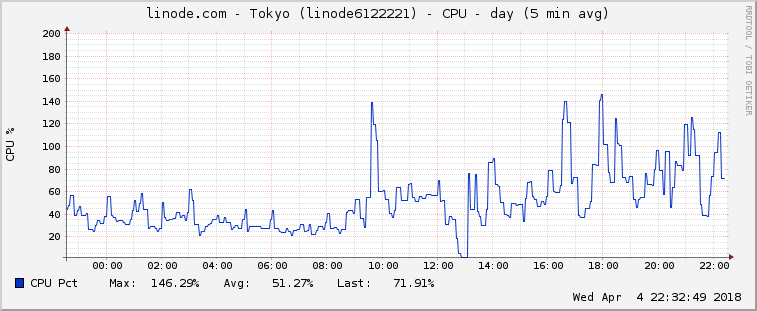
System Load seems significant higher than with 11.1.1, sometimes 90%-180% in top, will attach graph when more useful in some hours.
Environment:
Arch Linux Server, 4gb ram, SSD
CPU(s): 2 Single core Intel Xeon E5-2680 v2s (-MT-SMP-) cache: 32768 KB
clock speeds: max: 2799 MHz 1: 2799 MHz 2: 2799 MHz
Raiblocks folder stored in ramdisk.
Node Monitor: https://nanode21.cloud/stats.php
 stefonarch
All 30 comments
The graph, it has to be taken with a grain of salt as I did run some RPC scripts which lastet some minutes, but CPU usage is higher than before, traffic too. Update to v11.2 10:00 circa, crash 13:00
stefonarch
on 4 Apr 2018
@stefonarch Could you chime in on the discussion in #743? What's your bandwidth data like after updating to v11.1 and v11.2?
 dbachm123
on 6 Apr 2018
dbachm123
on 6 Apr 2018
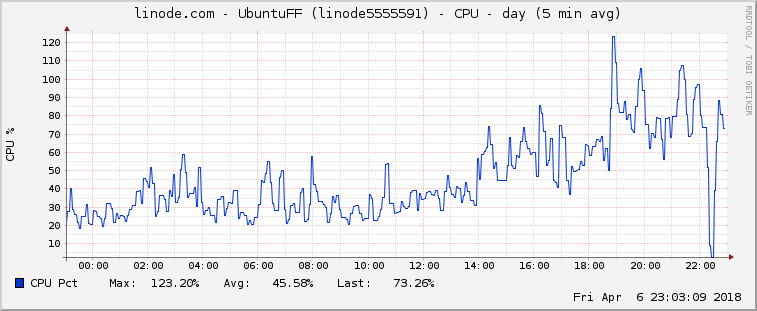
Updated another node to v11.2, did exact the same after some hour, no useful info in log. But CPU usage is higher, definitely.
stefonarch
on 6 Apr 2018
Weird. My node has been running smoothly after the 11.2 upgrade. No crashes or problems whatsoever.
dbachm123
on 7 Apr 2018
I guess I've jinxed it - my node (11.2) crashed earlier today as well. No particularly relevant info in the logs :(
dbachm123
on 7 Apr 2018
Anything in dmesg logs?
 clemahieu
on 7 Apr 2018
clemahieu
on 7 Apr 2018
Maybe:
dmesg | grep rai

[286378.128376] rai_node invoked oom-killer: gfp_mask=0x2420848, order=0, oom_score_adj=0``
[286378.128382] rai_node cpuset=/ mems_allowed=0
[286378.128393] CPU: 0 PID: 15415 Comm: rai_node Not tainted 4.4.0-116-generic #140-Ubuntu
[286378.128919] [15405]  1001 15405 268778433   193574    1756       7        0             0 rai_node
[286378.128931] Out of memory: Kill process 15405 (rai_node) score 769 or sacrifice child
[286378.132356] Killed process 15405 (rai_node) total-vm:1075113732kB, anon-rss:774296kB, file-rss:0kB
This is on a 1GB RAM VPS that used to run all previous versions perfectly well. Memory usage doesn't look that much different with v11.2 compared to v11.1 and previous versions. Also, @stefonarch runs the node on machines with a bit more RAM.
dbachm123
on 7 Apr 2018
@stefonarch did the OOM killer take down yours as well? 1GB is awfully tight, so is 4GB if running with a ramdisk. Does if fare better if not using tmpfs?
 cryptocode
on 7 Apr 2018
cryptocode
on 7 Apr 2018
I've just upgraded to a 2GB VPS - will continue to monitor --> http://138.197.179.164/
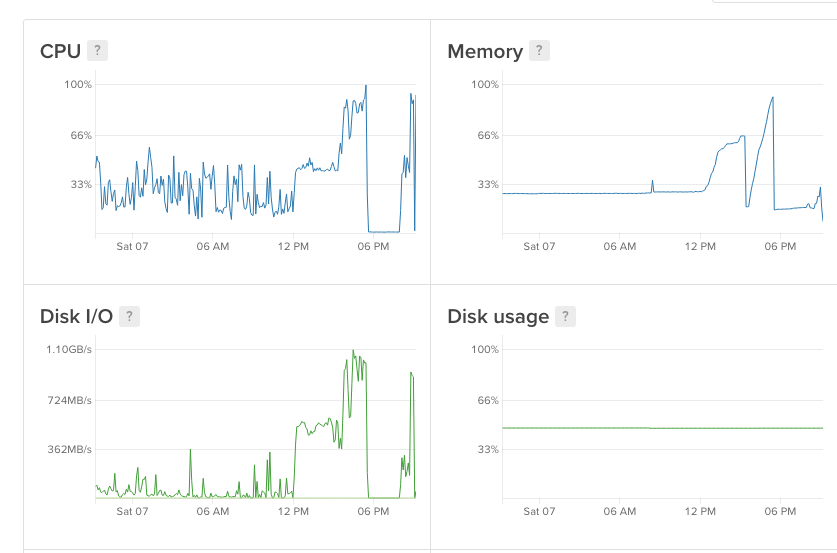
Here's a CPU / memory log. Node was running OK for several days, then CPU usage and memory started to spike which led to the OOM crash (~6pm).
dbachm123
on 7 Apr 2018
On http://wehavethetechnology.io there is the following comment: "Nodes seem to be getting behind/crashing when unchecked blocks are flushed." I have indeed flushed unchecked blocks yesterday via RPC. Maybe that gives a hint towards the problem.
dbachm123
on 7 Apr 2018
@dbachm123 That one is my node, it's happened twice to me. Basically, I would see an "Unchecked blocks flushed." message but would not get the normal confirmation that it was completed. The node will continue to be able to connect with other reps but it does not check any blocks. The node will then shutdown after a broken pipe message not too long after.
I haven't had any problems since rebooting the system and restarting the node. I've seen one other person have the same log error. I think it was Prometheus on Discord. Everyone else's seems like their resources get used up then crashes. I have not seen their logs though, but It seems similar because the node will still be responsive to RPC commands but will not vote or check blocks.
 oFLIPSTARo
on 7 Apr 2018
oFLIPSTARo
on 7 Apr 2018
Also, the list of trusted reps at https://nanode21.cloud/representatives.php shows many offline nodes. And I haven’t seen any of those nodes offline before.
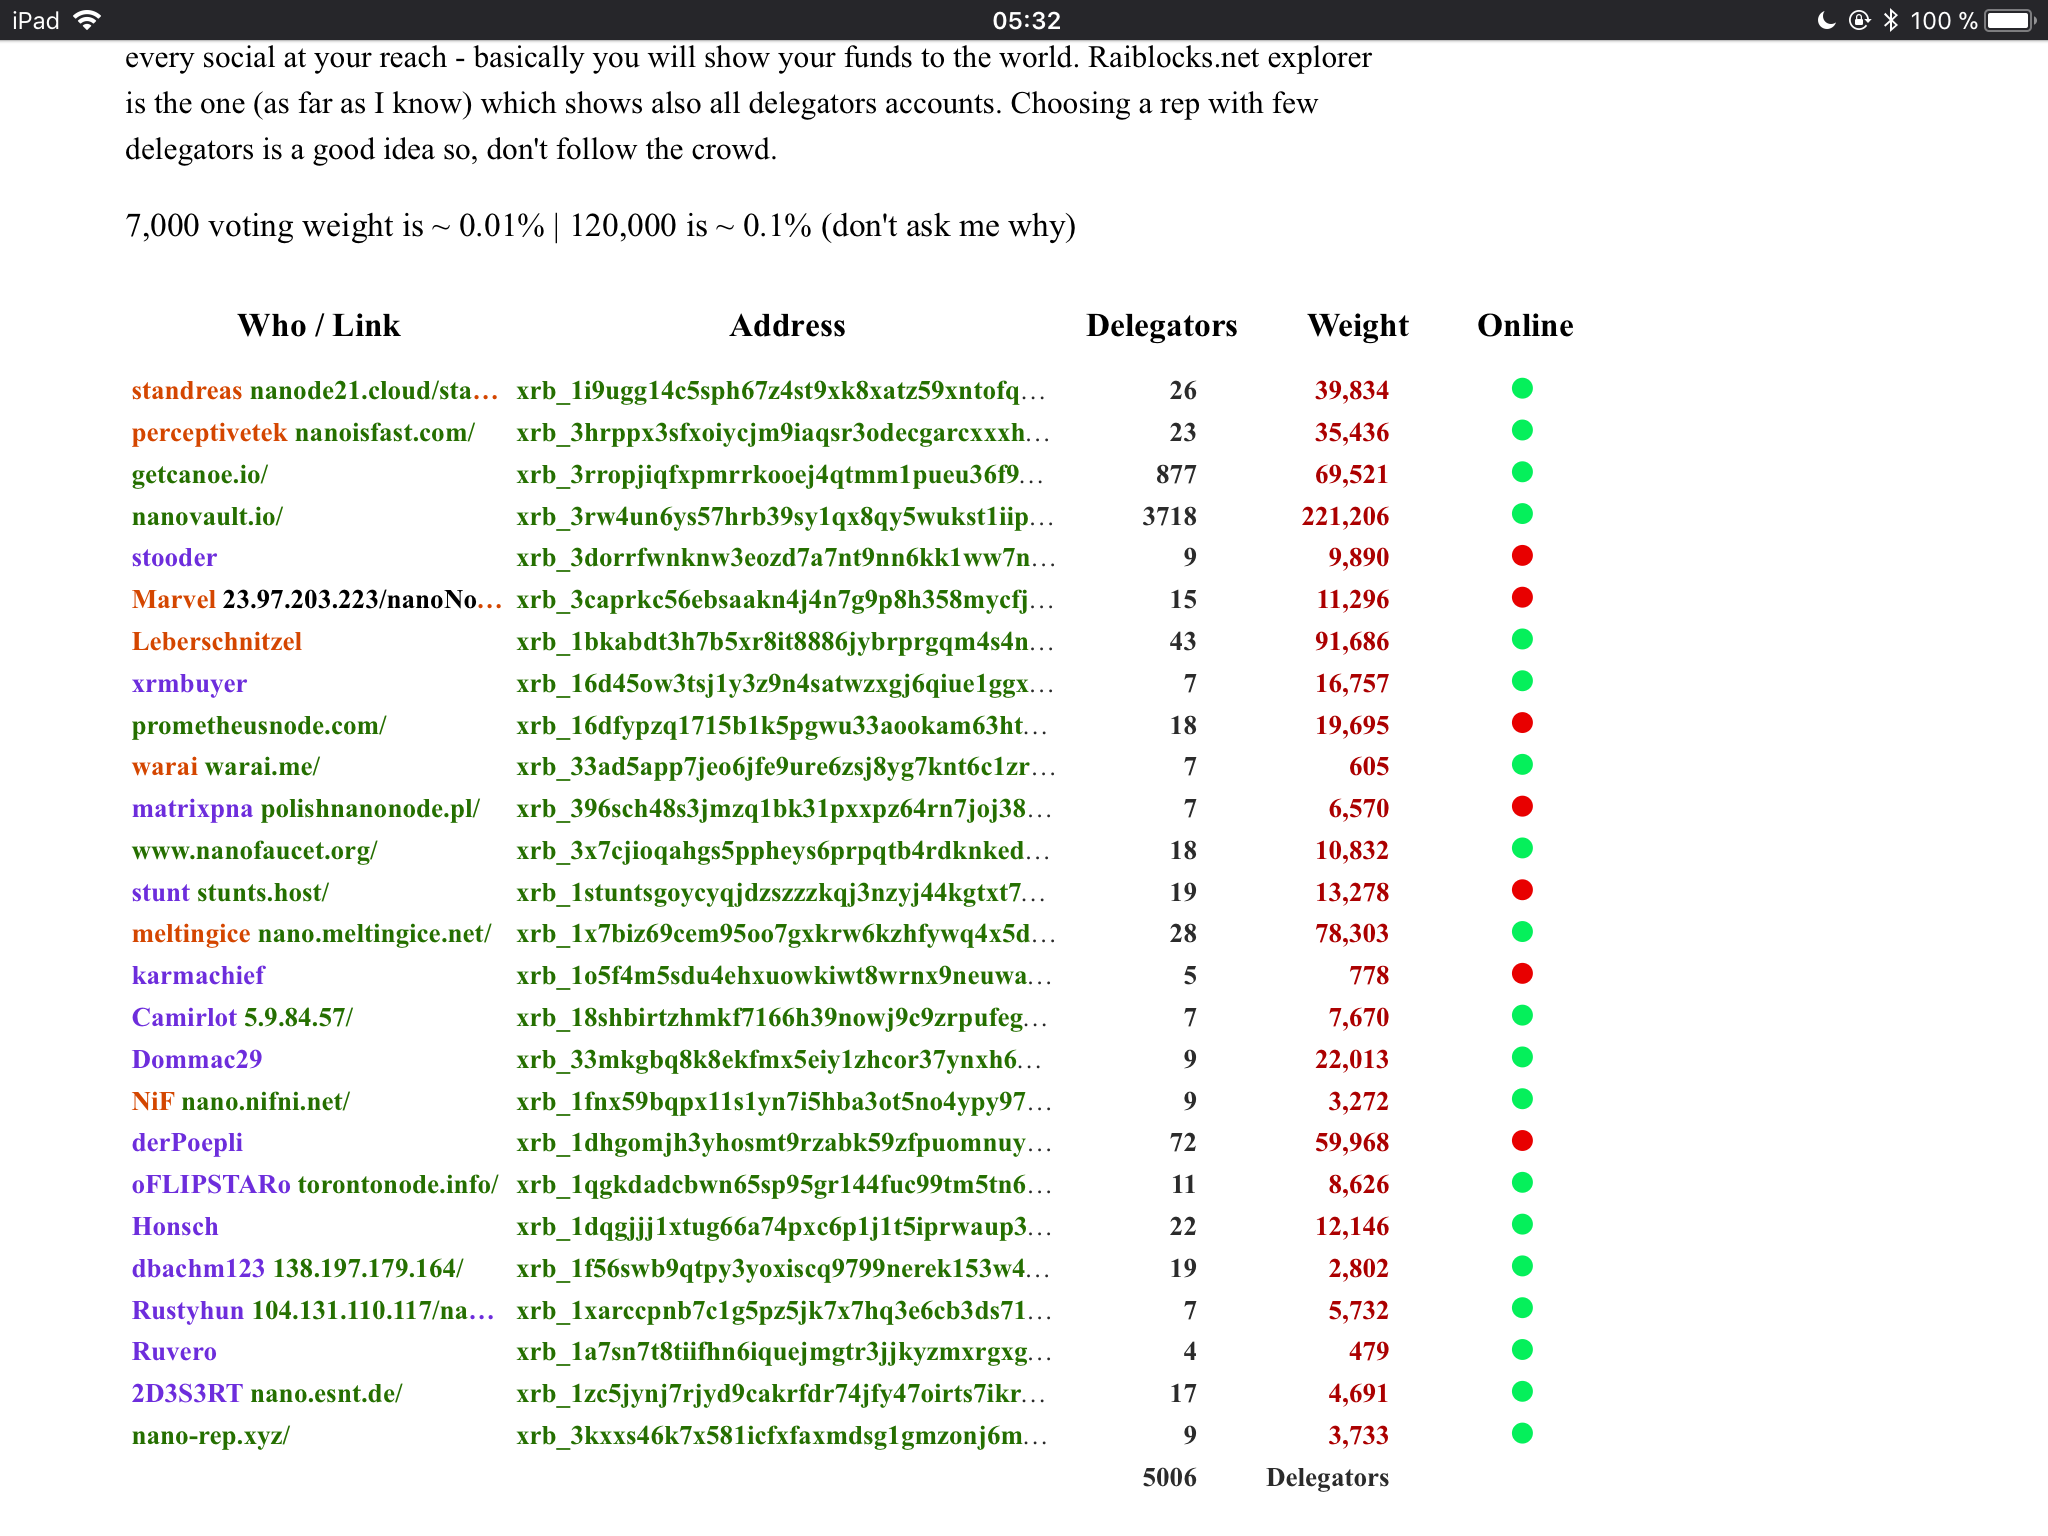
dbachm123
on 8 Apr 2018
Ehm, there was a bug until 2 days, showing green dots always.... but yes, nodes need at least some crontab watching them.
Personally I didn't see no crash anymore on all 3 nodes.
EDIT: oops... 1gb 1core 11.2:
$ cat node.log
Np RPC response, Node restartet at Fri  6 April  20:33
Np RPC response, Node restartet at Sat  7 April  02:00
Np RPC response, Node restartet at Sat  7 April  02:30
Np RPC response, Node restartet at Sat  7 April  21:30
@cryptocode OOM (out of memory?) killer? Never.
Actually my nodes run one with 1gb, one with 2gb and one with 4gb and ledger in ramdisk, but also the 1gb Ram usually runs very fine, but is not a representative. No docker all, just releases.
stefonarch
on 8 Apr 2018
@stefonarch ok, dbachm123 had an oom-killer entry in his dmesg logs, figured I'd ask.
cryptocode
on 8 Apr 2018
Thanks @stefonarch
I have setup a watchdog that checks availability of RPC and restarts the node if RPC calls do not go through...
dbachm123
on 8 Apr 2018
Problem started after I flushed/cleared 20000+ unchecked blocks I had since Jan. Could that be the reason?
Now I restart the docker node every hour to get a smooth behavior, or it will stop voting and eventually stop responding.
 Joohansson
on 9 Apr 2018
Joohansson
on 9 Apr 2018
I’m having same issue. Upgraded to 11.2 and periodically my node will crash and die. I issue a docker restart and everything is ok for an indeterminate amount of time.
I’m hosted on digital ocean VPS on Ubuntu with 1GB of RAM.
Releases prior to this ran fine including 11.0
 tmchow
on 10 Apr 2018
tmchow
on 10 Apr 2018
I'm trying my best to figure out how to run a node. Where do I click lol
code is completely new to me but I have a vision and drive to make, create,
run a node, blockchain biz. Or help the best out there, please help me out,
and I am doing everything on Google Pixel XL 2.
On Mon, Apr 9, 2018, 9:01 PM Trevin notifications@github.com wrote:
I’m having same issue. Upgraded to 11.2 and periodically my node will
crash and die. I issue a docker restart and everything is ok for an
indeterminate amount of time.I’m hosted on digital ocean VPS on Ubuntu with 1GB of RAM.
Releases prior to this ran fine including 11.0
—
You are receiving this because you are subscribed to this thread.
Reply to this email directly, view it on GitHub
https://github.com/nanocurrency/raiblocks/issues/780#issuecomment-379940448,
or mute the thread
https://github.com/notifications/unsubscribe-auth/AkOkEsC5q8FAA6EMpajinUxPgCzNDZD1ks5tnAR4gaJpZM4TGpBa
.
 BeeChains
on 10 Apr 2018
BeeChains
on 10 Apr 2018
@BeeChains Wrong place to post that question. You cannot run a node on a mobile device. You need to host it on a server, like a Digital Ocean VPS: https://medium.com/@seanomlor/how-to-run-your-own-raiblocks-node-on-digitalocean-6a5a2492c29b
tmchow
on 10 Apr 2018
I've seen several mentions of flushing unchecked blocks, but can't find out how to do this. I have 20k unchecked blocks for some reason that consistently stays at the value. Looking at other nodes, they have much less than this so I'm assuming something is wrong.
tmchow
on 10 Apr 2018
@tmchow you send an "unchecked_clear" RPC command. AFAIK that is not the same as when the node does it's own flushing of unchecked blocks. I would restart the node and see what if that fixes your issue.
oFLIPSTARo
on 10 Apr 2018
@oFLIPSTARo I hit this again.. looks like my node crashed this morning despite restarting the node. It was offline for about 8 hours. I just restarted the container now.
I don't know how to issue an RPC command to the container. Is there some simple steps to outline?
tmchow
on 12 Apr 2018
Yeah same problem for me. I have a cronjob restarting the node every 30min because every 60min was too long!
Joohansson
on 12 Apr 2018
Here's a very rough version of my watchdog scripts that run as cronjob. Will not work out of the box due to some hardcoded paths, but it might give you a starting point to better watch the node.
dbachm123
on 13 Apr 2018
@dbachm123 Thanks, I'm running your code now. Works great!
Before running the script in crontab you also need to do a "chmod u+x nanoNodeWatchDog.py"
I'm running a docker node so my startscript just looks like this "docker restart nano"
Joohansson
on 15 Apr 2018
Just chiming in here with some strange activity. My node crashed and restarted last night, and when it did, it looks like it _lost_ about 200k blocks from the reported block count. It's no longer catching up either.
 meltingice
on 15 Apr 2018
meltingice
on 15 Apr 2018
Commit f749697cd373714af876707fa1f201e6ccb57b8f is running very smoothly on my rep node. All previously observed issues are gone 👍
dbachm123
on 18 Apr 2018
No issue for some time now. Close this?
 NiFNi
on 14 May 2018
NiFNi
on 14 May 2018
Overcome by newer versions...
stefonarch
on 14 May 2018
Related issues
 FndNur1Labs
·
6Comments
FndNur1Labs
·
6Comments
 liuhailin
·
5Comments
liuhailin
·
5Comments
 frankh
·
3Comments
frankh
·
3Comments
 termhn
·
4Comments
termhn
·
4Comments
 bartclaeys
·
3Comments
bartclaeys
·
3Comments
Most helpful comment
Commit f749697cd373714af876707fa1f201e6ccb57b8f is running very smoothly on my rep node. All previously observed issues are gone 👍