Mybinder.org-deploy: Holes in our grafana metrics
Over the last couple months we've seen holes pop up in our grafana logging, e.g.:
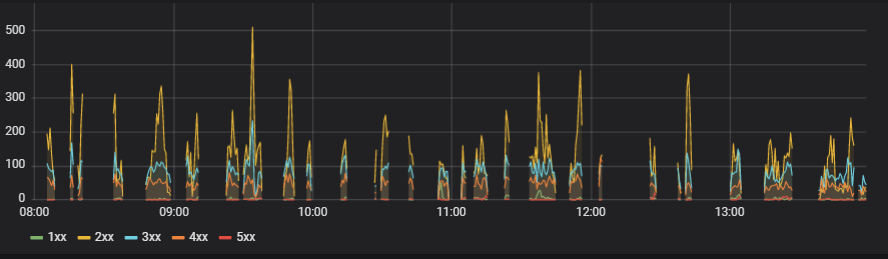
We should try to figure out what's causing these gaps.
I looked at the logs of the prometheus server and didn't see anything that mapped onto the outages.
The prometheus server had some concerning-looking logs:
t=2018-02-08T13:16:54+0000 lvl=info msg="Database table locked, sleeping then retrying" logger=sqlstore retry=0
t=2018-02-08T13:16:54+0000 lvl=info msg="Database table locked, sleeping then retrying" logger=sqlstore retry=0
but this wasn't directly tied to a gap in the reporting history.
Interestingly the kubernetes dashboard within grafana did not show the same gaps in reporting:

 choldgraf
All 14 comments
I think @betatim noticed this earlier as well
choldgraf
on 8 Feb 2018
It looks like our version of grafana automatically got updated to an
unreleased beta, because the Grafana chart version we are using asks for
grafana/grafana:latest image (latest tag is always a mistake!). I'm
upgrading our grafana chart version which might offer us at least some
solutions.
On Thu, Feb 8, 2018 at 2:20 PM, Chris Holdgraf notifications@github.com
wrote:
I think @betatim https://github.com/betatim noticed this earlier as well
—
You are receiving this because you are subscribed to this thread.
Reply to this email directly, view it on GitHub
https://github.com/jupyterhub/mybinder.org-deploy/issues/350#issuecomment-364268235,
or mute the thread
https://github.com/notifications/unsubscribe-auth/AAB23qO0ect7DOZ8-azSc0kzZ8jPA65xks5tS3MagaJpZM4R_GwO
.
--
Yuvi Panda T
http://yuvi.in/blog
 yuvipanda
on 8 Feb 2018
yuvipanda
on 8 Feb 2018
isn't the grafana chart version specified here?
https://github.com/jupyterhub/mybinder.org-deploy/blob/staging/mybinder/requirements.yaml#L9
there it looks like it's v0.5
choldgraf
on 8 Feb 2018
See https://github.com/kubernetes/charts/pull/3132
On Thu, Feb 8, 2018 at 2:27 PM, Chris Holdgraf notifications@github.com
wrote:
isn't the grafana chart version specified here?
https://github.com/jupyterhub/mybinder.org-deploy/blob/
staging/mybinder/requirements.yaml#L9there it looks like it's v0.5
—
You are receiving this because you commented.
Reply to this email directly, view it on GitHub
https://github.com/jupyterhub/mybinder.org-deploy/issues/350#issuecomment-364269986,
or mute the thread
https://github.com/notifications/unsubscribe-auth/AAB23tTHMYSgkZ-ZXcBUabMfdYITRMEwks5tS3TBgaJpZM4R_GwO
.
--
Yuvi Panda T
http://yuvi.in/blog
yuvipanda
on 8 Feb 2018
So, let me see if I got this correct:
- We were depending on v0.5 of the Grafana chart, which was depending on
latestfor the Docker image it was using - The Helm repo realized this was a bad thing because
latestchanges a lot, so in a newer release of the Grafana helm chart they pinned the docker image version. This was in a version later than v0.5 - So, by upgrading our Meta Chart to use Grafana 0.6.1, we are now getting the docker image pin to a non-
latestversion.
yeah?
choldgraf
on 8 Feb 2018
Exactly!
yuvipanda
on 8 Feb 2018
Ok, Grafana sorted out but that doesn't solve our problem - the holes are in the collected prometheus data itself it looks like.
I want us to upgrade prometheus versions - 2.1 is out, while we are running 1.8. 2.x has massive perf improvements which might help us - we can also keep like, a month of data than just two weeks (or even two months!). Any objections to this?
yuvipanda
on 8 Feb 2018
@yuvipanda this would entail bumping the prometheus chart version to 5.1.0 yeah?
choldgraf
on 8 Feb 2018
(no objections from my end, it's already a bit wacky anyway...)
choldgraf
on 8 Feb 2018
Alright, new Prometheus in place! It's been configured to keep data for 60days, and has a much more performant prometheus version (2.1 vs 1.8) and much faster disk (2TB SSD vs 500GB spinning)
yuvipanda
on 9 Feb 2018
I also fixed the issue with all pods reporting as 'unknown' in the running / build pod graphs - it was a simple error in the query (it was using count() instead of sum())
yuvipanda
on 9 Feb 2018
Ok, no holes now! (and I spent some more time shoring up the graphs). LMK what y'all think!
yuvipanda
on 9 Feb 2018
I love it! Closing this issue now
choldgraf
on 9 Feb 2018
❤️😍❤️😍❤️😍❤️ Thanks!
 betatim
on 9 Feb 2018
betatim
on 9 Feb 2018
Related issues
betatim
·
4Comments
betatim
·
5Comments
 certik
·
7Comments
yuvipanda
·
4Comments
yuvipanda
·
4Comments
certik
·
7Comments
yuvipanda
·
4Comments
yuvipanda
·
4Comments