Mybinder.org-deploy: stackdriver costs
We just got a notice about what will be stackdriver upcoming costs, and we seem to be producing a hilarious amount of logs:
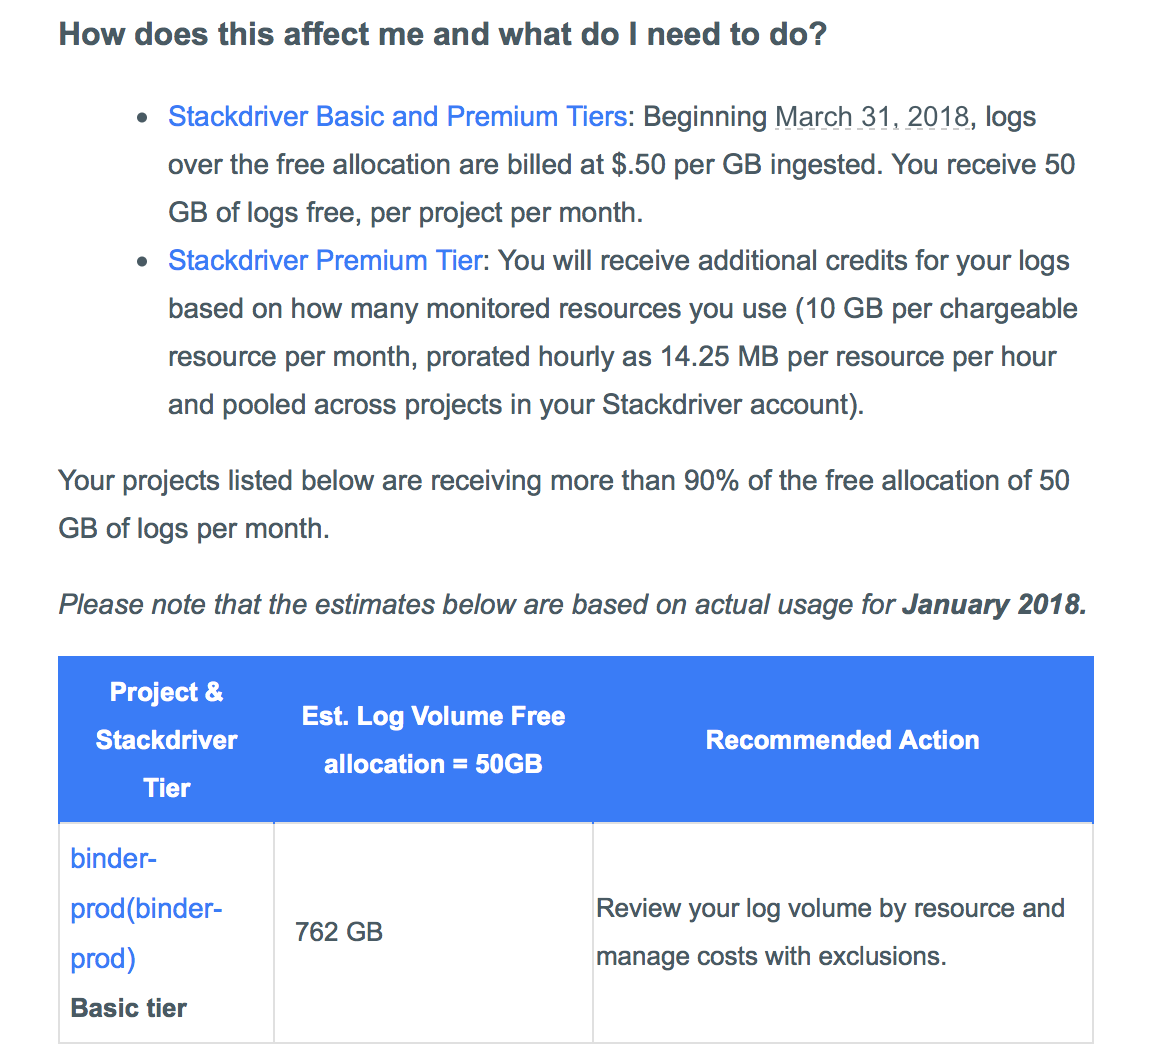
At this rate, our log ingestion bills would be $350/month, so we need to do something before this starts billing.
 minrk
minrk
All 20 comments
lol I literally giggled when I saw that we were using 762 GB of logs
 choldgraf
on 1 Feb 2018
choldgraf
on 1 Feb 2018
To contribute one data point beyond ("woah 762GB of logs!!!11"): I am not even 100% I know what stackdriver does for me. The logs on the web console seem mostly useless as there are so many lines and no good way to scroll through them. I end up using kubectl logs -f a lot.
 betatim
on 6 Feb 2018
betatim
on 6 Feb 2018
it looks like the logs has a google API like anything else
https://cloud.google.com/logging/docs/
so perhaps this is a matter of fiddling with that API and figuring out how to delete old stuff. Re: @betatim 's point, I'm also not sure what exactly we're getting with those logs. I can see a benefit in keeping old logs around, but maybe not a $300 a month benefit :-) I'd rather pay that money on keeping prometheus data for longer...
choldgraf
on 6 Feb 2018
The only difference between kubectl logs and stackdriver is that stackdriver logs persist, while kubectl logs go away. I too agree we don't need that much logs. Ideally, we can find a way to keep the logs for like, 3 days and then clear them out - they are still useful for forensics and incident reports, and it's far easier to use stackdriver logging than set up another persistent logging solution.
 yuvipanda
on 8 Feb 2018
yuvipanda
on 8 Feb 2018
@choldgraf prometheus data retention is currently mostly a matter of configuration, I don't think any extra money is needed for that.
yuvipanda
on 8 Feb 2018
Can someone be point person for this and take this on? I think we should
set up exclusion so that we keep binderhub and hub logs, but nothing else...
On Tue, Feb 6, 2018 at 8:19 AM, Chris Holdgraf notifications@github.com
wrote:
it looks like the logs has a google API like anything else
https://cloud.google.com/logging/docs/
so perhaps this is a matter of fiddling with that API and figuring out how
to delete old stuff. Re: @betatim https://github.com/betatim 's point,
I'm also not sure what exactly we're getting with those logs. I can see a
benefit in keeping old logs around, but maybe not a $300 a month benefit
:-) I'd rather pay that money on keeping prometheus data for longer...—
You are receiving this because you are subscribed to this thread.
Reply to this email directly, view it on GitHub
https://github.com/jupyterhub/mybinder.org-deploy/issues/309#issuecomment-363475990,
or mute the thread
https://github.com/notifications/unsubscribe-auth/AAB23je_04qdXtOc3LUrkw8TN2RGT0VMks5tSHt2gaJpZM4R2SBO
.
--
Yuvi Panda T
http://yuvi.in/blog
yuvipanda
on 9 Feb 2018
I created an exclusion for messages from the kubernetes dashboard like the one below:
 {
 insertId: "14iecu4g4tg7k3q"
 labels: {
  compute.googleapis.com/resource_name: "fluentd-gcp-v2.0.9-pxccf"
  container.googleapis.com/namespace_name: "kube-system"
  container.googleapis.com/pod_name: "kubernetes-dashboard-768854d6dc-r2q8w"
  container.googleapis.com/stream: "stdout"
 }
 logName: "projects/binder-prod/logs/kubernetes-dashboard"
 receiveTimestamp: "2018-02-09T07:38:06.095439746Z"
 resource: {
  labels: {
   cluster_name: "prod-a"
   container_name: "kubernetes-dashboard"
   instance_id: "1207474308823566363"
   namespace_id: "kube-system"
   pod_id: "kubernetes-dashboard-768854d6dc-r2q8w"
   project_id: "binder-prod"
   zone: "us-central1-a"
  }
  type: "container"
 }
 severity: "INFO"
 textPayload: "2018/02/09 07:37:53 Restarting synchronizer: kubernetes-dashboard-key-holder-kube-system.
"
 timestamp: "2018-02-09T07:37:53Z"
}
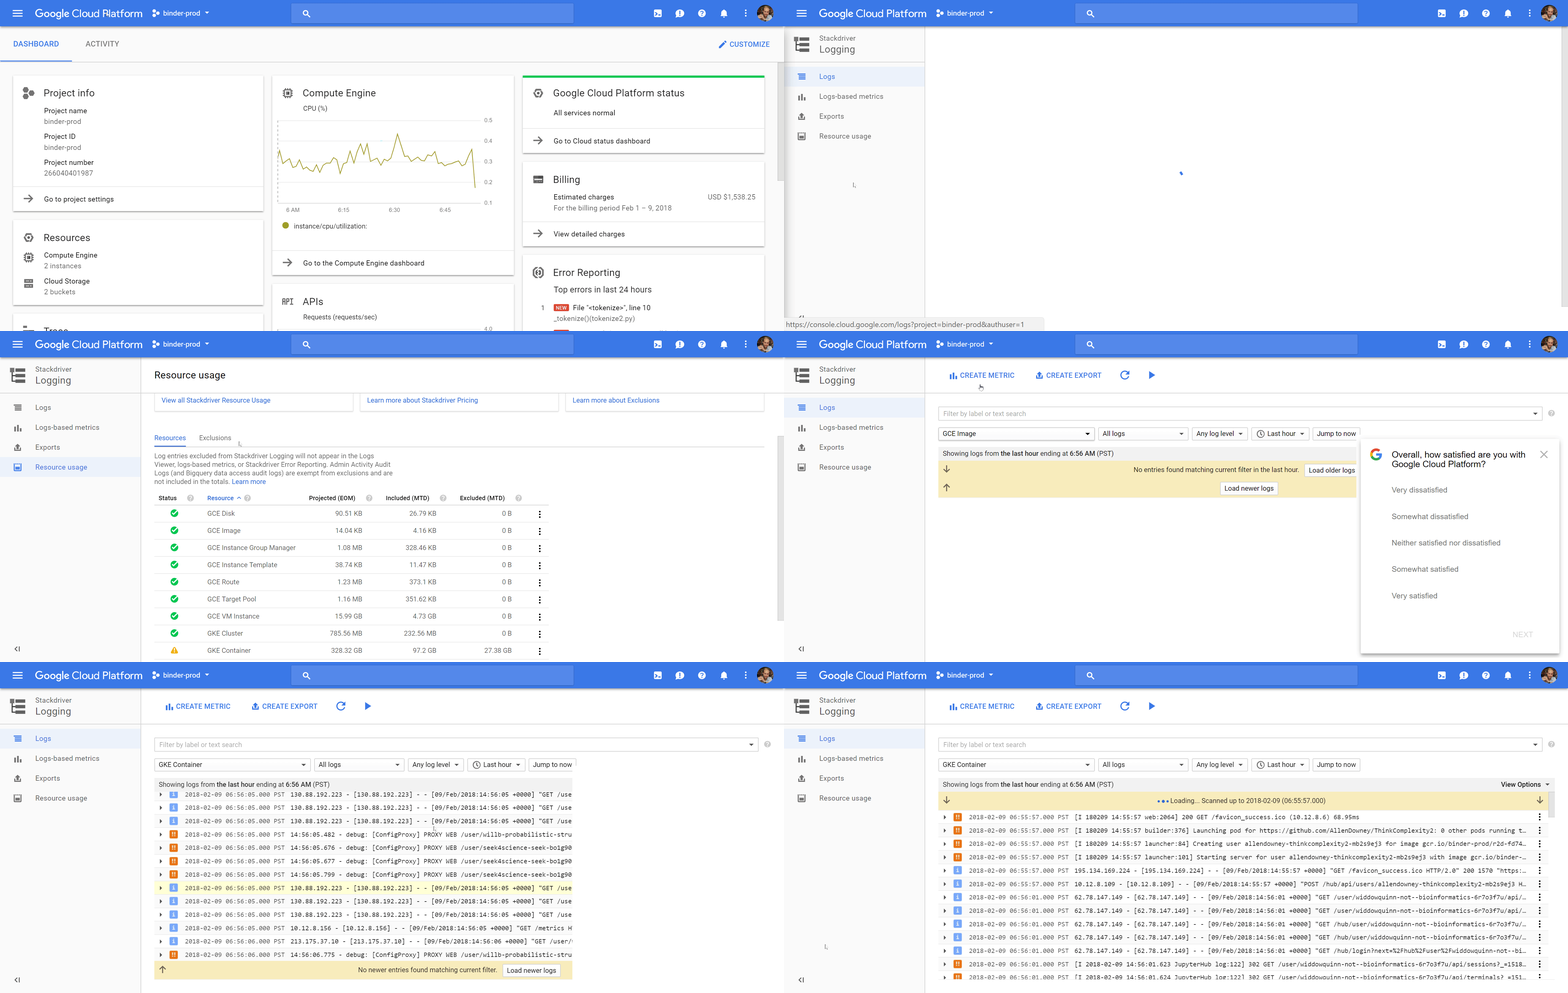
Found it by opening the log resource usage, saw that GKE Engine was the biggest source and looked at the logs from that resource. That log stream was full of these messages (I didn't see any other kind).
Will wait and see what kind of logs we get most of now this has been filtered out.
betatim
on 9 Feb 2018
Todo: figure out how to configure this in a way that does not use the web console.
betatim
on 9 Feb 2018
for future reference, here's the collection of menu items that led to this discovery (ignore the actual mouse cursor, seems to be a bug causing it to be offset)
choldgraf
on 9 Feb 2018
also worth noting that we've now discarded ~27GB of logs from that resource, so I think it's working:

choldgraf
on 9 Feb 2018
thanks @betatim for figuring this out!! I'll make a note to myself to re-check log ingestion in a week to make sure we're still on track
choldgraf
on 9 Feb 2018
Does anyone know why this log message gets classified as "error" off the top of their head?
betatim
on 9 Feb 2018
I added some more exclusions for nginx-ingress.
betatim
on 9 Feb 2018
I the the exclusions might be working a little too well. I don't see any GKE container logs in stackdriver since Feb 9 (when these exclusions where created).
When I inspect the exclusions, they don't match any logs that seems like they shouldn't so I don't really understand what's preventing the other logs from showing up. Is there a chance that kubernetes isn't sending the container logs anymore?
minrk
on 14 Feb 2018
Confirm the lack of logs as well as not sure why.
When I go to the exclusion's page then it says it will show message matching the filter. Presumably after the exclusion is enabled we shouldn't get any but if you click "Load older" eventually we should see some again but don't. This makes me think "no logs are being sent" :-/
Either way I set the exclusions to only exclude 90% of messages. This way we can see if we get new messages.
betatim
on 16 Feb 2018
@minrk what's the filter keyword to use to check for whether logs are being properly filtered?
choldgraf
on 16 Feb 2018
If they are being properly filtered, we should still be getting all logs from BinderHub or JupyterHub, but none from nginx.
e.g. this filter should return no results:
logName="projects/binder-prod/logs/nginx-ingress-controller"
and this filter should return a fair amount:
logName="projects/binder-prod/logs/binder-container"
But since they've been updated to filter 90% instead of 100%, there will be results for both.
I did just inspect the exclusions again, and noticed that nginx-ingress-controller exclusion had only this filter:
resource.type="container"
which would exclude all container logs. Maybe that was the culprit. I've updated the filters to include only logName, so they all look like this:
logName="projects/binder-prod/logs/nginx-ingress-controller"
and upped the exclusions to 99%. We can keep an eye on them to see if they are working as intended now.
minrk
on 19 Feb 2018
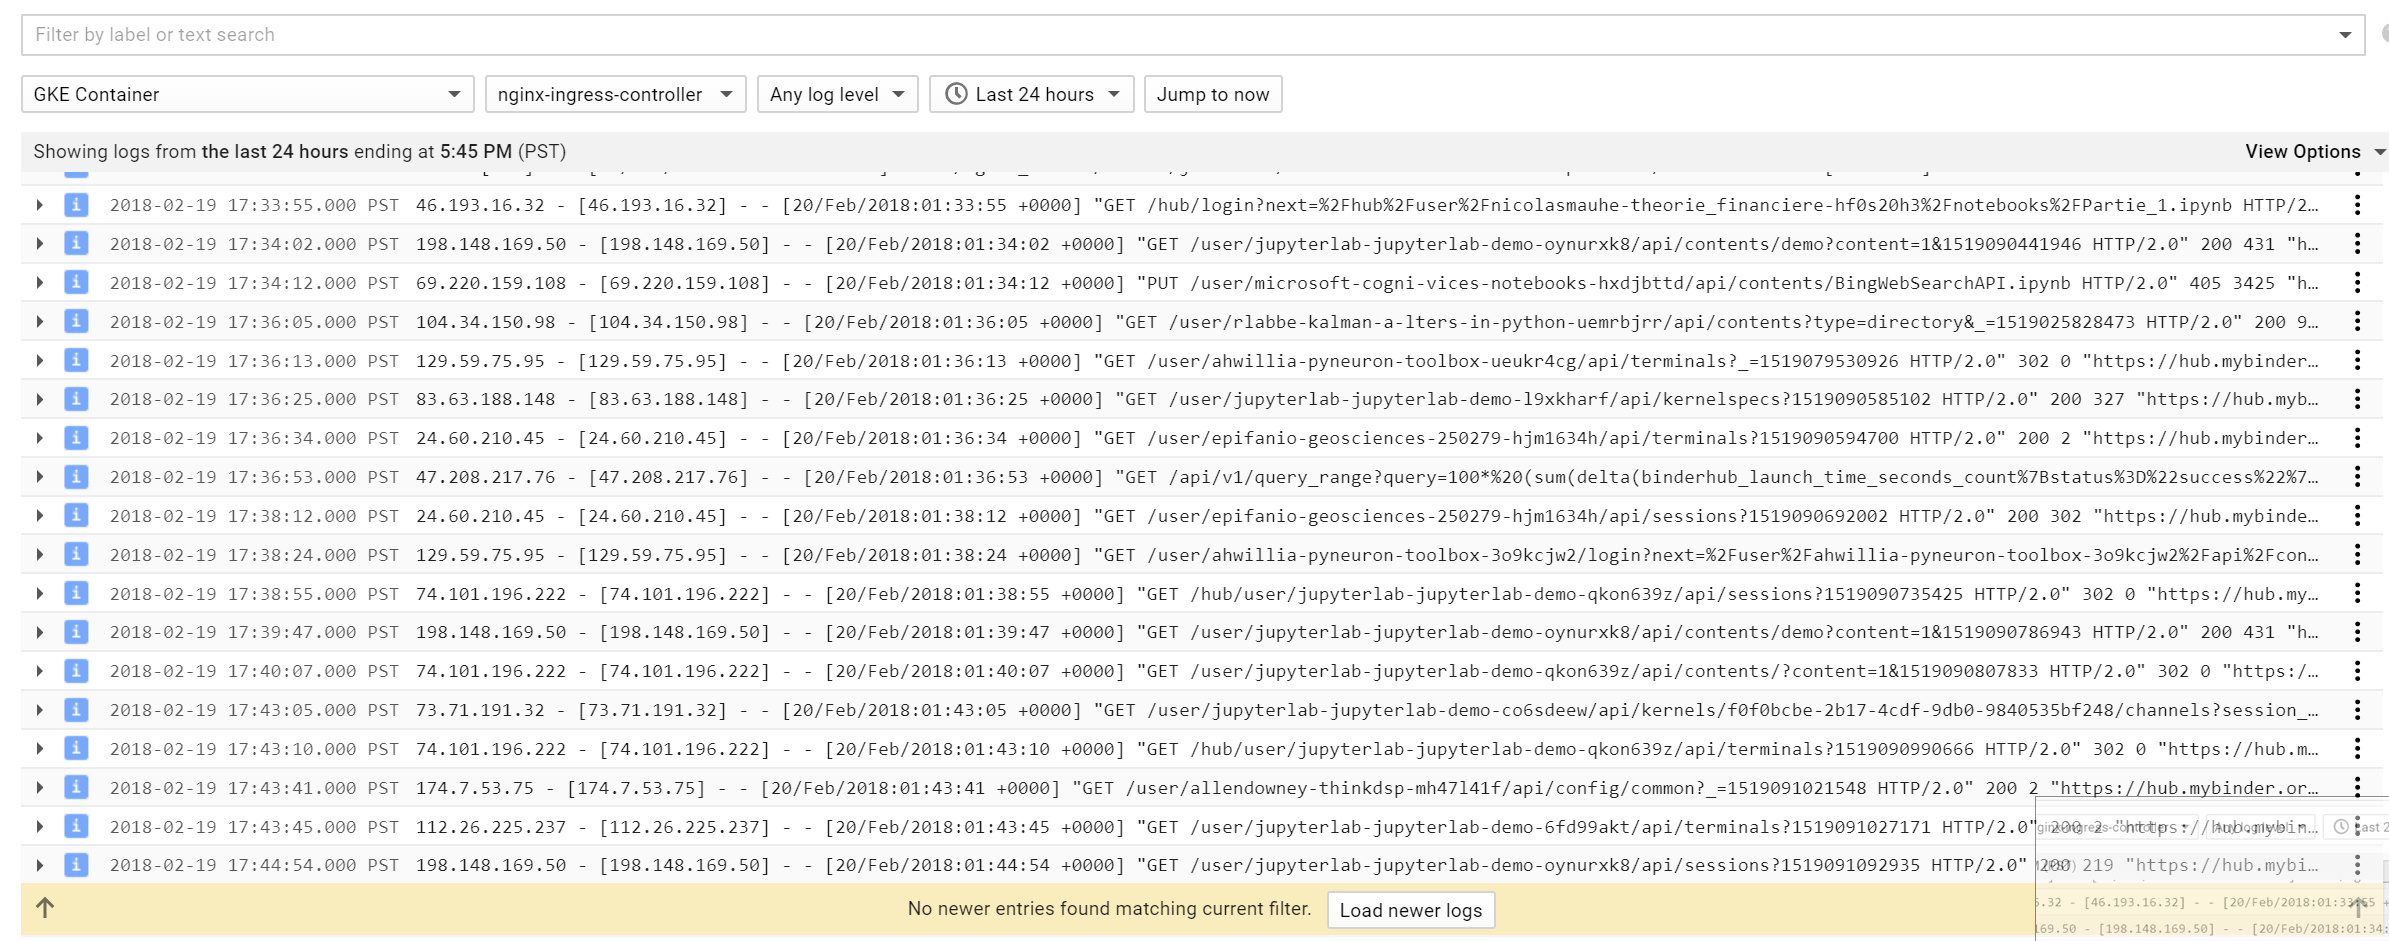
I just checked and it looks like we still have quite a lot of nginx-ingress-controller logs
choldgraf
on 20 Feb 2018
I think it's working because the cull fraction is 99% and we're only seeing a few requests a minute in the logs. Checking the kubectl logs directly shows that we get ~100 requests/min per ingress controller (two instances right now):
kubectl logs --tail 100 prod-nginx-ingress-controller-7b4fdbdcc8-n7xkn nginx-ingress-controller | grep -o '20/Feb/[0-9:]\+'
We can up this fraction to 100% if we're secure that the kubernetes logs are sufficient now. In particular, you can tell that it's not getting 100% when you look at all the logs, because there would be an ingress log entry for every HTTP request, so every request logged from JupyterHub or BinderHub has a corresponding log produced by the ingress controller. If they aren't showing up, then they are getting filtered.
minrk
on 20 Feb 2018
we've now limited our stackdriver logs, and they seem to be working! closing :-)
choldgraf
on 30 Apr 2018
Related issues
 jzf2101
·
3Comments
choldgraf
·
4Comments
betatim
·
5Comments
jzf2101
·
3Comments
choldgraf
·
4Comments
betatim
·
5Comments
 stargaser
·
6Comments
betatim
·
6Comments
stargaser
·
6Comments
betatim
·
6Comments
Most helpful comment
lol I literally giggled when I saw that we were using 762 GB of logs