Hi,
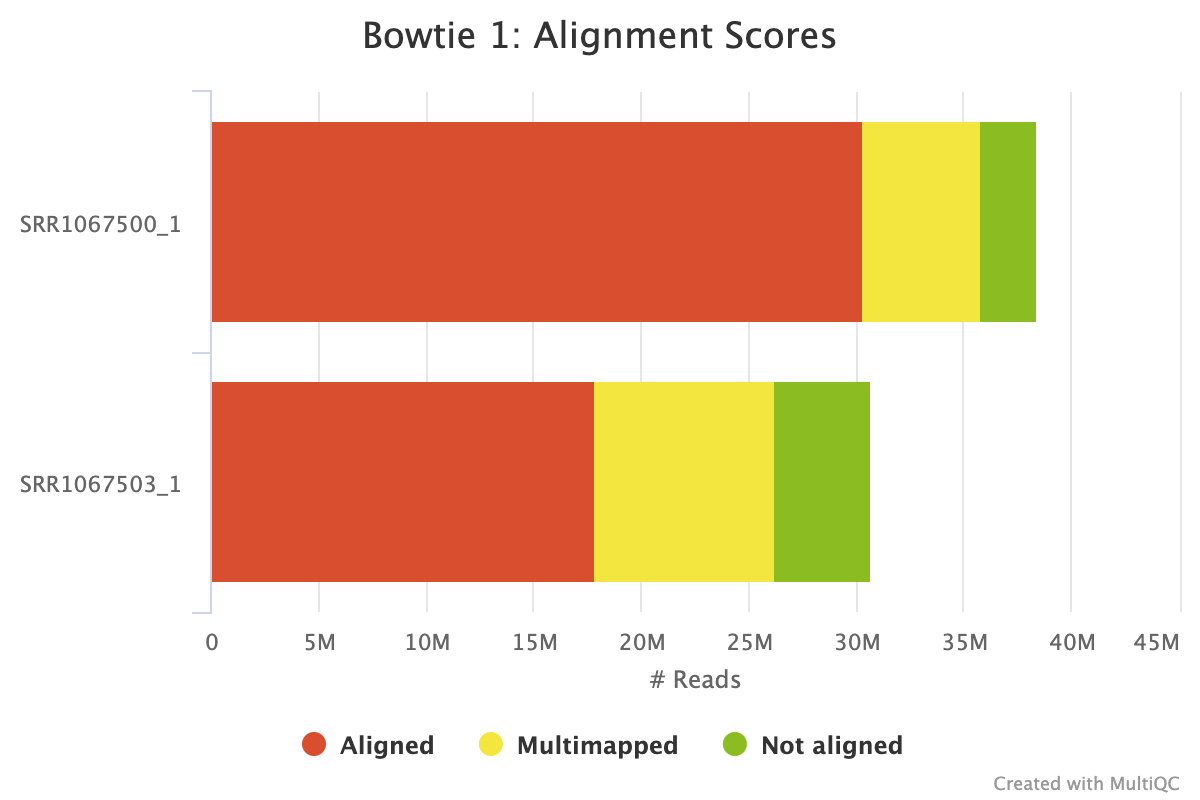
I tried to change the bowtie1 color code following the explanation from the doc.
custom_plot_config:
  bowtie1_alignment:
    reads_aligned:
      color: '#d84e2f'
    multimapped:
      color: '#f2e63f'
    not_aligned:
      color: '#8bbc21'
I'm sure about the plot name. Look at the bowtie1 code to find the key name ...
No error message ... Just that nothing changes.
Thanks
Nicolas
 nservant
All 11 comments
Actually, even the example in the doc does not seem to work for me ...
custom_plot_config:
    fastqc_sequence_counts_plot:
        cpswitch_c_active: False
Sorry my fault. The examples from the doc works well with the MultiQC 1.7 version.
However, my bowtie1 stuff still does not work
nservant
on 3 Nov 2019
For trace, I tried to do the same with RSeQC ... no change ...
custom_plot_config:
   rseqc_read_distribution_plot:
     scale: 'Set3'
However, I'm not sure here that scale is the good key to change these colors ...
nservant
on 3 Nov 2019
Actually, it seems that only keys which are accessible through pconfig can be updated.
@ewels, could you please confirm ?
nservant
on 3 Nov 2019
Actually, it seems that only keys which are accessible through
pconfigcan be updated.
Yes - that's what this config option does, it just overwrites the pconfig supplied by the module..
 ewels
on 4 Nov 2019
ewels
on 4 Nov 2019
So do you think there is a way to have access to the cats in the barplot functions ? Thks
nservant
on 4 Nov 2019
If you pull the latest development version, yes 😀 I just added support for this..
ewels
on 4 Nov 2019
Thanks Phil. I wlll try
nservant
on 4 Nov 2019
Great! Let me know how you get on..
ewels
on 4 Nov 2019
@ewels , the code that I put at the top of the issue was correct ?
Because, I have an error with the last devel version
============================================================
Module bowtie1 raised an exception: Traceback (most recent call last):
  File "/data/users/nservant/Apps/conda/multiqc/bin/multiqc", line 448, in multiqc
    output = mod()
  File "/data/users/nservant/Apps/conda/multiqc/lib/python3.6/site-packages/multiqc/modules/bowtie1/bowtie1.py", line 48, in __init__
    self.bowtie_alignment_plot()
  File "/data/users/nservant/Apps/conda/multiqc/lib/python3.6/site-packages/multiqc/modules/bowtie1/bowtie1.py", line 141, in bowtie_alignment_plot
    plot = bargraph.plot(self.bowtie_data, keys, config)
  File "/data/users/nservant/Apps/conda/multiqc/lib/python3.6/site-packages/multiqc/plots/bargraph.py", line 127, in plot
    for kk, vv in v.items():
AttributeError: 'list' object has no attribute 'items'
============================================================
ok. It works ! I put a list before. Thanks
nservant
on 4 Nov 2019
Related issues
 adirot
·
5Comments
adirot
·
5Comments
 boulund
·
4Comments
boulund
·
4Comments
 MattBashton
·
7Comments
MattBashton
·
7Comments
 lbeltrame
·
5Comments
lbeltrame
·
5Comments
 mahesh-panchal
·
3Comments
mahesh-panchal
·
3Comments