Multiqc: Access to top over-represented nucleotide sequences
Is your feature request related to a problem? Please describe.
When there's an issue with sequencing of PCR-amplified products, the first thing users want to do is blast the top few over-represented sequences, so I often find myself re-running FastQC in galaxy to obtain its HTML output to get at these sequences.
Describe the solution you'd like
It would be nice if MultiQC had a way to get/copy the top few sequences from each sample. Perhaps an initially hidden section that shows the top 5 over-represented sequences from each sample? It would be even cooler if each sequence showed its count in each sample in a table (say, like they each have the same contamination). And sort it by the sum of the counts from each sample.
Describe alternatives you've considered
Rerunning FastQC to obtain the HTML output it generates. I suppose I could dig into the raw data output, but the workflows I'm using currently don't save these. It would be nice if they were all in one place instead of having to look at each sample's FastQC output.
Additional context
Here's the section of the FastQC output I often use:

As you can see, I wrote an Automator service to blast highlighted text, pretty much exclusively for this purpose.
 hepcat72
All 18 comments
Hi @hepcat72,
Thanks for the suggestion, it's a nice idea! (and I love the automator service!). I think that MultiQC actually used to do this in the early days, or at least something similar to what you're suggesting. The problem is how to make it work well with large numbers of samples. People often run MultiQC with hundreds or even thousands of inputs now (I think the record is something like 35k single cell FastQC reports), and the visualisation needs to scale with this.
That said, I can of course make a rule that such a feature as this would cut off and only run with smaller numbers of samples. But it needs some thought as to how to represent the data.
If you have any concrete ideas (ideally as a sketch or something visual) I'd be happy to discuss this.
Phil
 ewels
on 14 Mar 2019
ewels
on 14 Mar 2019
35k! Wow. Yeah, scalability is the issue. But, you could do the same thing you did with the "Per Base Sequence Content", i.e. if you click a row (in the overrepresented sequence display as it is now), up comes a table for 1 sample, the way it appears in the FastQC html output. You could limit it to some max arbitrary number.
To get a sense of common sequences, you could add a "column" to the current representation that displayed the sum of the counts of sequences that are the same in the sets? Maybe that's not that useful. Or you could add a column to the sheet that comes up showing the number of other samples that have that same sequence.
Another unrelated Idea I had would be to (instead of using 2 colors (blue & black)), you could have a gradient. The size of each step in the gradient would represent the number of sequences in the set of dupes.
hepcat72
on 14 Mar 2019
And regarding the automator service, I have a bunch. Some of them are in gists, though I haven't been keeping that up to date.
hepcat72
on 14 Mar 2019
How many of the overrepresented sequences do you need? Would it suffice to just be able to see the sequence of the top one?
ewels
on 15 Mar 2019
Depends on the degree of over representation. If you had a table for each sample of all the sequences that could fit in the given space, that would seem sufficient. You click a bar for a sample and up comes the table for that sample. If you wanted to do a single table for all samples as a quick feature, then the top sequence would make sense.
hepcat72
on 16 Mar 2019
I'm thinking of a feature where you could hover over a bar and the top sequence would show - either as a tooltip or in a fixed location above the plot.
I would prefer to avoid tables because (a) it's more work to implement a custom feature like this and (b) adding that data could make the filesize very large for massive sample numbers (tricky to know how bad this would be without actually implementing and testing though).
This is a good example of when different people have different expectations. When I wrote this barplot I figured that when we see this it's usually the same single sequence affecting all samples. But I appreciate that this isn't the case for everyone.
It's also in the grey-area where I'm not sure if it's in scope for MultiQC to show. I intentionally want MultiQC to summarise the top stats only, with the idea being that people can go back to the original source for more details. FastQC is a bit of a special case though, because so many people use the two programs as a pair.
ewels
on 16 Mar 2019
As long as the sequence can be copied... The only reason to have access to the sequence would be to figure out what it is and the go-to for that is blast.
Usually, if the experiment is RNA-seq, it’s wnough to know that the top overrepresented sequence is ribosomal rna. In amplicon sequencing however, it’s useful to look at a few top sequences to see if there’s any mispriming that’s going on.
I hear you though. Top stats. I guess I was viewing it as all the QC stuff I need in one place with all samples included in one display.
I just created a workflow the other day to show the overrepresented sequences. I can use that from now on, but it would be nice if all the QC was in one place. I had tried a bit to use the custom table feature to display those sequences, but I couldn’t enter my file for some reason. After selecting custom table.
hepcat72
on 16 Mar 2019
I'll look in to this when I have time :) PRs welcome..
ewels
on 17 Mar 2019
You know, if there was a simple custom option to add a table from a tab-delimited file, it would be easy to add the sequences myself. by processing the raw files like I've already worked out. I know number and width of columns would be an issue, but if you let the user enter limited column numbers, it could mitigate that issue... Just a thought.
hepcat72
on 17 Mar 2019
You mean like Custom Content? 😉
ewels
on 18 Mar 2019
You know. I’ll bet my file type wasn’t marked as “tabular”. I’ll have to try it again.
hepcat72
on 18 Mar 2019
There’s an example file here if it helps: https://github.com/ewels/MultiQC_TestData/blob/master/data/custom_content/embedded_config/test_table_mqc.txt
ewels
on 18 Mar 2019
OK. I followed the example (quite some hoops you have to jump through to create the header), but the resulting table is missing a bunch of the data in the tabular file. The second and third columns are missing and the majority of the rows. Here's what it currently looks like:
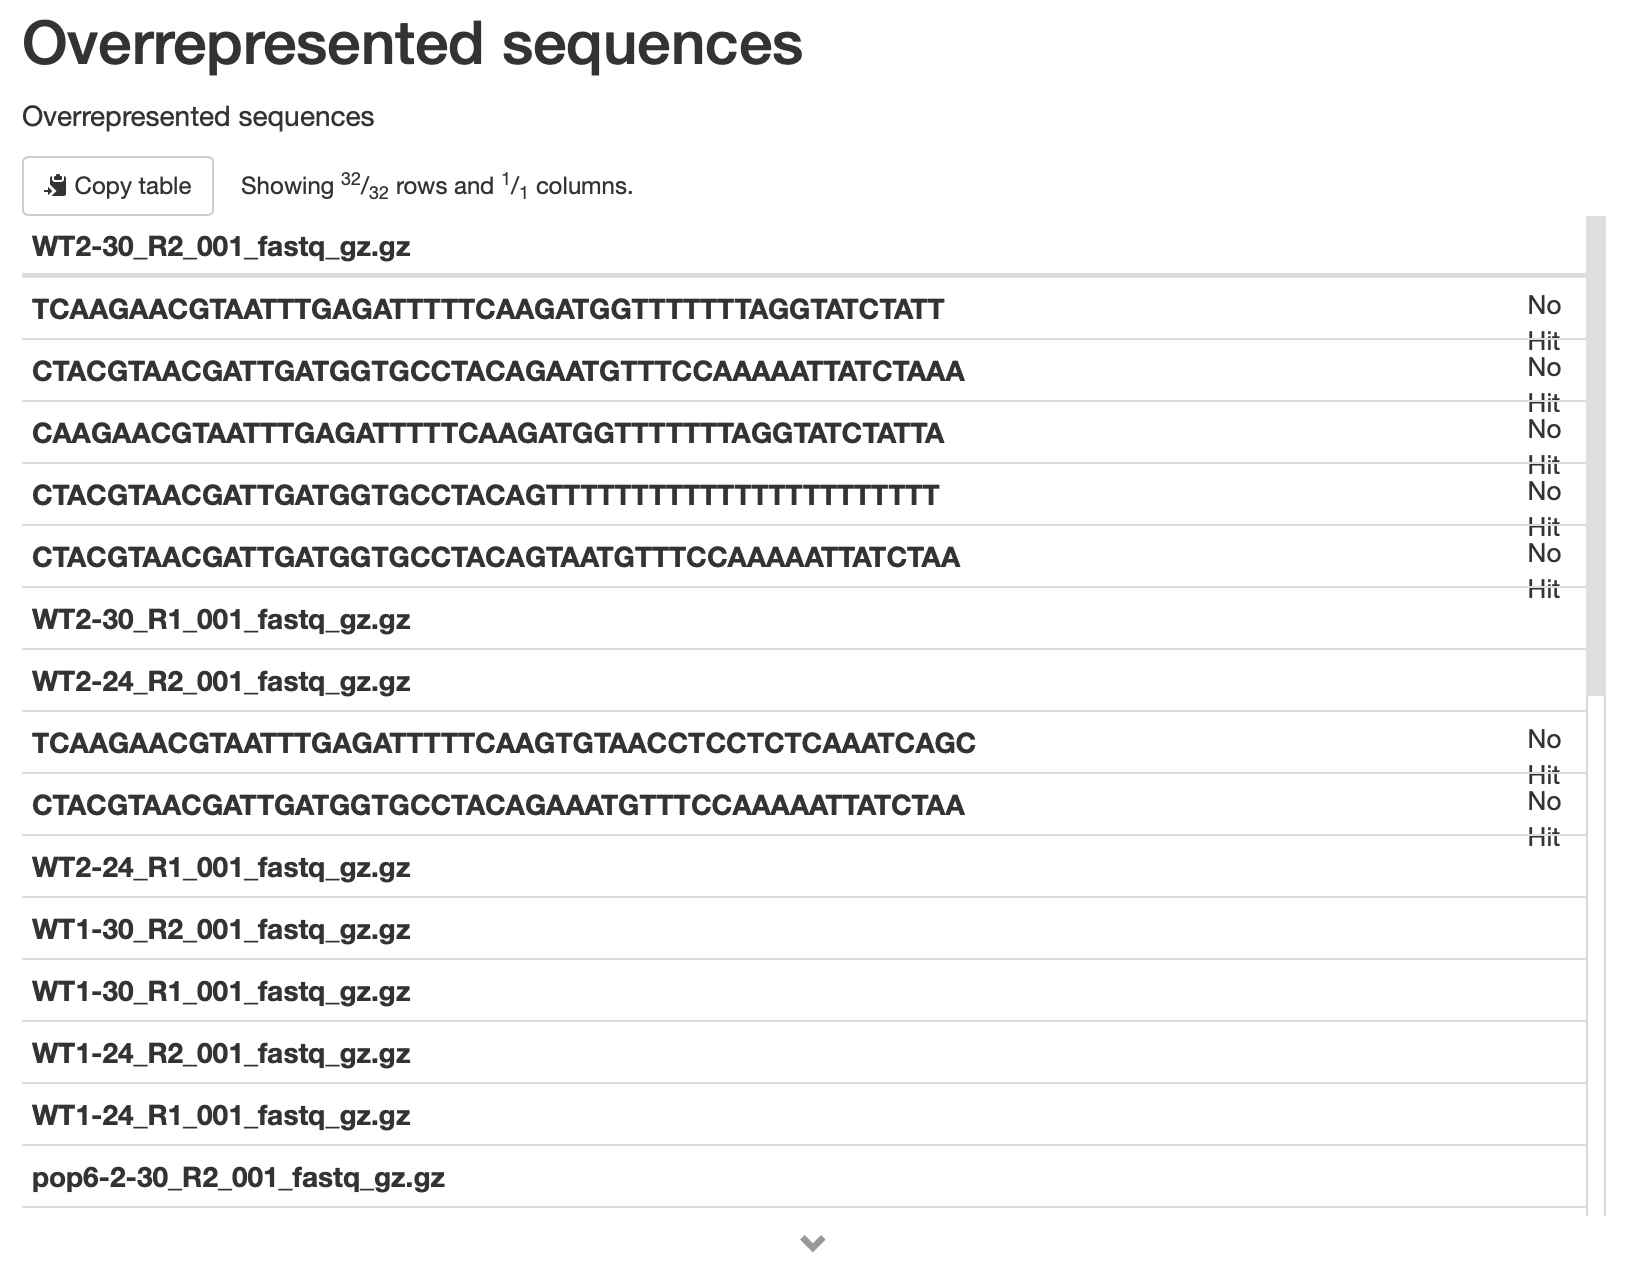
And here's the top of the file I'm feeding it:
# plot_type: 'table'
# section_name: 'Overrepresented Sequences'
#Sequence   Count   Percentage  Possible Source
WT2-30_R2_001_fastq_gz.gz
TCAAGAACGTAATTTGAGATTTTTCAAGATGGTTTTTTTAGGTATCTATT  128459  14.266976456973278  No Hit
CTACGTAACGATTGATGGTGCCTACAGAATGTTTCCAAAAATTATCTAAA  70599   7.84090076122231    No Hit
CAAGAACGTAATTTGAGATTTTTCAAGATGGTTTTTTTAGGTATCTATTA  37977   4.2178201987130075  No Hit
CTACGTAACGATTGATGGTGCCTACAGTTTTTTTTTTTTTTTTTTTTTTT  27492   3.0533299866502888  No Hit
CTACGTAACGATTGATGGTGCCTACAGTAATGTTTCCAAAAATTATCTAA  22228   2.4686970370748806  No Hit
WT2-30_R1_001_fastq_gz.gz
TCAAGAACGTAATTTGAGATTTTTCAAGATGGTTTTTTTAGGTATCTATT  162833  18.084638502699928  No Hit
CTACGTAACGATTGATGGTGCCTACAGAATGTTTCCAAAAATTATCTAAA  66489   7.384433925592574   No Hit
CTACGTAACGATTGATGGTGCCTACAGTTTTTTTTTTTTTTTTTTTTTTT  36370   4.039342776606686   No Hit
CAAGAACGTAATTTGAGATTTTTCAAGATGGTTTTTTTAGGTATCTATTA  30205   3.3546425231620827  No Hit
CTACGTAACGATTGATGGTGCCTACAGTAATGTTTCCAAAAATTATCTAA  21711   2.4112777295272956  No Hit
WT2-24_R2_001_fastq_gz.gz
TCAAGAACGTAATTTGAGATTTTTCAAGATGGTTTTTTTAGGTATCTATT  127102  12.613454801671182  No Hit
CTACGTAACGATTGATGGTGCCTACAGAATGTTTCCAAAAATTATCTAAA  47862   4.749769269701391   No Hit
CAAGAACGTAATTTGAGATTTTTCAAGATGGTTTTTTTAGGTATCTATTA  32254   3.2008494844542357  No Hit
TCAAGAACGTAATTTGAGATTTTTCAAGTGTAACCTCCTCTCAAATCAGC  30929   3.0693580239562555  No Hit
CTACGTAACGATTGATGGTGCCTACAGAAATGTTTCCAAAAATTATCTAA  22827   2.2653249575753964  No Hit
WT2-24_R1_001_fastq_gz.gz
TCAAGAACGTAATTTGAGATTTTTCAAGATGGTTTTTTTAGGTATCTATT  155861  15.467464546925086  No Hit
CTACGTAACGATTGATGGTGCCTACAGAATGTTTCCAAAAATTATCTAAA  44085   4.374944178153562   No Hit
TCAAGAACGTAATTTGAGATTTTTCAAGTGTAACCTCCTCTCAAATCAGC  35837   3.5564222414083977  No Hit
CTACGTAACGATTGATGGTGCCTACAGTTTTTTTTTTTTTTTTTTTTTTT  31264   3.1026030347236695  No Hit
CAAGAACGTAATTTGAGATTTTTCAAGATGGTTTTTTTAGGTATCTATTA  25027   2.4836504014211003  No Hit
WT1-30_R2_001_fastq_gz.gz
TCAAGAACGTAATTTGAGATTTTTCAAGATGGTTTTTTTAGGTATCTATT  127277  14.344739443215335  No Hit
CTACGTAACGATTGATGGTGCCTACAGAATGTTTCCAAAAATTATCTAAA  57103   6.435786956213025   No Hit
CAAGAACGTAATTTGAGATTTTTCAAGATGGTTTTTTTAGGTATCTATTA  33710   3.7992816190732728  No Hit
CTACGTAACGATTGATGGTGCCTACAGTTTTTTTTTTTTTTTTTTTTTTT  27652   3.1165154354973046  No Hit
CTACGTAACGATTGATGGTGCCTACAGAAATGTTTCCAAAAATTATCTAA  21282   2.39858532830369    No Hit
WT1-30_R1_001_fastq_gz.gz
TCAAGAACGTAATTTGAGATTTTTCAAGATGGTTTTTTTAGGTATCTATT  151135  17.033652551131386  No Hit
CTACGTAACGATTGATGGTGCCTACAGAATGTTTCCAAAAATTATCTAAA  54931   6.190991949490179   No Hit
CTACGTAACGATTGATGGTGCCTACAGTTTTTTTTTTTTTTTTTTTTTTT  37260   4.199383955107391   No Hit
CAAGAACGTAATTTGAGATTTTTCAAGATGGTTTTTTTAGGTATCTATTA  25655   2.8914437833676896  No Hit
CTACGTAACGATTGATGGTGCCTACAGAAATGTTTCCAAAAATTATCTAA  19945   2.2478988992114037  No Hit
Is it the empty columns on the file name rows or the header line that starts with a comment character that's causing the table to not be correctly populated?
hepcat72
on 4 Apr 2019
Is it the empty columns on the file name rows or the header line that starts with a comment character that's causing the table to not be correctly populated?
I suspect that both of these are problematic. You're trying to display nested content in a table, which is not possible with MultiQC. You'll need to either have multiple different tables, or add a column and repeat the filename in every row.
For the comment character, I think just putting that name in quotes will fix the problem: '#Sequence'
Note that you can use more structure data types like YAML or JSON if you want to. I usually find this easier for more complex data. See the other files in the previously mentioned link for examples of this.
ewels
on 4 Apr 2019
Thanks. I figured out that it's treating the first column as a unique ID and including only the last one, which gave me an idea, actually. I just cut the sequences out, sorted, and did a uniq -c on them. It gave me a simple table of sequences and the number of samples they're found in. I then sorted on descending (sample) abundance, swapped the columns, added the header, and piped that into MultiQC. I should probably do a head on it, but for now, it's sufficient. It would also be nice to have a sum or average percent across samples. I'd paste a screen-shot, but I already deleted the test case history.
I'll close this out. Thanks for the help. The example file was crucial.
hepcat72
on 4 Apr 2019
Huh, nice idea. Now that's something that could scale well! If we always show max ~20 sequences or something then it would work with any number of samples...
Reopening as this is something that could be added to the main FastQC module 😀
ewels
on 4 Apr 2019
BTW, here's what I see with my amplicon run (24 samples):

It would be nice if I knew which samples had which sequences, but just getting the sequences is good. I improved the workflow to take a cutoff percentage (e.g. representing 1% or more of each sample) and used it to do a filter on column 3 of the FastQC raw data grep for the overrepresented sequence section.
hepcat72
on 5 Apr 2019
And ideally, the font would default to a fixed-width font...
hepcat72
on 5 Apr 2019
Related issues
 lucacozzuto
·
5Comments
lucacozzuto
·
5Comments
 cyklee
·
6Comments
cyklee
·
6Comments
 biodray
·
5Comments
biodray
·
5Comments
 lbeltrame
·
5Comments
lbeltrame
·
5Comments
 pancheto
·
7Comments
pancheto
·
7Comments