Module request from SeqAnswers: kraken
 ewels
ewels
All 15 comments
Hello. Is there any update on this? I would also like multiqc to have a kraken module.
 kopardev
on 28 Feb 2017
kopardev
on 28 Feb 2017
Hi @kopardev,
Not yet, I need some example data before I can make a start on the module. If you have an example run or two that you don't mind me using it would be great if you could send over the data! (Or submit as a PR to ewels/MultiQC_TestData). No actual data files needed, just the logs as they are typically generated by the tool.
Cheers,
Phil
ewels
on 28 Feb 2017
Hi Phil,
Are you still looking for some example Kraken data? We could probably send you some over.
BW,
Tom.
 tomrconnor
on 11 Aug 2017
tomrconnor
on 11 Aug 2017
Hi @tomrconnor,
Yes please! Until I have some example data I can't do anything. At the start of MultiQC dev I would install and get test data and run tools to get the example logs, but it took way longer than actually writing the module code. So now I insist that anyone requesting a module provides these example logs before I make a start. This one has been waiting longer than most..!
Phil
ewels
on 11 Aug 2017
I was just about to upload an example of kraken data!
 vladsaveliev
on 2 Sep 2017
vladsaveliev
on 2 Sep 2017
@dfornika - thanks again for the test data!
@vladsaveliev - It's never a problem to have too much test data 😉
Questions now that I've seen some test data:
- Do the filenames always end in
.reportor is that just your convention @dfornika? (I think it's just your convention?) - Do you know what version of kraken these came from? (not critical to know but nice)
- What does everyone want to see in the report?
% Unclassifiedin _General Statistics_?- Bar plot of third-level hierarchy counts? Which whitespace indentation level to plot could be configurable by the user.
Notes for myself:
- Website: http://ccb.jhu.edu/software/kraken/
- Output generated by
kraken-reportcommand - Output format documentation: http://ccb.jhu.edu/software/kraken/MANUAL.html#sample-reports
ewels
on 4 Sep 2017
.reportis just my convention. I don't know of a standard file extension for kraken reports.- Those reports came from the
0.10.5-betaversion. - This is something we're still pondering. I think the most useful information for our purposes is the percentage (column 1) for the species-level phylogenetic rank. As you said, the user could select a different phylogenetic rank to report. But it might get tricky to deal with ranks that are reported with
-.
 dfornika
on 4 Sep 2017
dfornika
on 4 Sep 2017
Thanks @dfornika.. Are species-level rows (labelled S) always at the same level of indentation? It's a bit hard to tell by just eyeballing the files. I ask because I would want to ensure that the numbers sum to 100% (I'd probably just plot the second column counts but display the percentages tab by default). I guess I'd have to always include U unclassified as the first category too.
My only concern with using Species level is that it could end up with a _lot_ of categories, making the plot unreadable. I guess we could have a category for "others" and have a percentage cutoff however. Or perhaps better to count everything across all samples and then just plot the top 10 species or something (again, could be configurable - I just like having sensible defaults).
ewels
on 4 Sep 2017
I don't have a lot of experience interpreting these reports, so I'm learning from this set of reports as well. I've found it useful to open the reports in emacs whitespace mode (M-x whitespace-mode) to see the format a bit more clearly. It looks like column 5 is followed by one tab character, then two spaces for each level of indentation. But if you check each species-level record (lines with S in column 4) you'll find different numbers of spaces (anywhere from 10 to 18 in the file I'm looking at).
I think that's a good suggestion to set a threshold and group the very low-percentage species together in an 'other' grouping.
Our use-case is to look at libraries from fairly pure cultures and detect contamination from other species that exceed ~2%.
dfornika
on 5 Sep 2017
I'm working on a kraken parser on my fork:
https://github.com/dfornika/MultiQC/tree/kraken
I'm having trouble setting a regex to match the kraken report format. I thought this would do it, but it doesn't seem to work:
kraken/report:
     contents_re: '^ {1,2}\d{1,2}\.\d{1,2}\t\d+\t\d+\t[UDKPCOFGS-]\t\d+\t.*'
Here are the first few lines of a kraken report:
 15.81  120098  120098  U   0   unclassified
 84.19  639475  1261    -   1   root
 82.61  627500  0   -   131567    cellular organisms
 82.61  627500  879 D   2       Bacteria
 82.47  626383  222 P   1239          Firmicutes
 82.43  626137  91  C   186801          Clostridia
 82.42  626045  578 O   186802            Clostridiales
I'm just looking for the .report file extension for now.
I'm working on options for visualization. I'd really like some sort of collapsible table, since this data is inherently nested but I don't see an option for that in the default MultiQC table plot. Is it a feature you'd consider adding?
Here's a 'bootply' that sort of shows what I'm thinking of: https://www.bootply.com/GGAMvot45f#
dfornika
on 13 Sep 2017
Wow that's a complicated looking regex.. I'm travelling at the moment so don't have much time to look into it sorry, but will try to have a play when I'm back next week. It's annoying that the output doesn't have much to search for! Will root always be there, and if so, could we just search for the string - 1 root?
The collapsible table thing sounds nice, but I don't think that it would scale well to thousands of samples I'm afraid. Any visualisation has to be able to show a sample as a single row / bar / line / entity. This usually means that MultiQC sections end up showing only a fraction of the data unfortunately, but it's a constraint that's part of the MultiQC scope.
If you _really_ want the collapsible table then it's possible - modules can spit out whatever custom HTML / Javascript you want. However, I would probably request that this is done as a niche MultiQC plugin instead of a core module.
One thing that we could do is have stacked bar plots as suggested above, but have multiple datasets (see docs) to give tabs above the plot for level 1 / level 2 / level 3 etc. That way the default view would be a broad overview without too many categories, but the plot could sort of be drilled into by clicking through the different tabs to reveal more detailed plots with more categories. It's not ideal, but it may be a compromise?
Phil
ewels
on 13 Sep 2017
I may be misunderstanding the way that the contents_re regex gets used. Does it need to match all lines of the input file? Does it act as a filter that will return any line that matches, and ignore any line that doesn't?
For reference, here is how the regex matches up with the description of the kraken report format according to the kraken manual:
http://ccb.jhu.edu/software/kraken/MANUAL.html#sample-reports
1. one or two space (' ') characters  \
2. one or two digits                  |  'Percentage of reads covered by the clade rooted at this taxon'
3. a decimal ('.')                    |
4. one or two digits                  /
5. a tab character ('\t')
6. one or more digits (\d+)  | 'Number of reads covered by the clade rooted at this taxon'
7. a tab character ('\t')
8. one or more digits (\d+)  | 'Number of reads assigned directly to this taxon'
9. a tab character ('\t')
10. One of ([UDKPCOFGS-])    | 'A rank code, indicating (U)nclassified, (D)omain, (K)ingdom, (P)hylum, (C)lass, (O)rder, (F)amily, (G)enus, or (S)pecies. All other ranks are simply '-'.'
11. a tab character ('\t')
12. One or more digits (\d+) | 'NCBI taxonomy ID'
13. a tab character ('\t')
14. any characters (.*)      | 'indented scientific name'
Ah yes don't worry about it - your regex looks fine (I quickly tested it at https://regex101.com and it worked fine). I'm not sure why the pattern isn't matching but I don't think that you've done anything wrong.. The only reason I suggested - 1 root is that normal string searches are marginally faster and sometimes less vulnerable to software updates.
Phil
ewels
on 14 Sep 2017
Perhaps a primary and secondary % and species/unclassified using something like below if that helps? It'd be great to have a kraken report as part of multiQC.
PSP=$(awk '$4 == "U" || $4 == "S"'  $sample.report | sort -k1,1 -r | sed -n '1p' | cut -f 1)
PS=$(awk '$4 == "U" || $4 == "S"'  $sample.report | sort -k1,1 -r | sed -n '1p' | cut -f 6)
SSP=$(awk '$4 == "U" || $4 == "S"'  $sample.report | sort -k1,1 -r | sed -n '2p' | cut -f 1)
SS=$(awk '$4 == "U" || $4 == "S"'  $sample.report | sort -k1,1 -r | sed -n '2p' | cut -f 6)
 r0sies
on 5 Jun 2018
r0sies
on 5 Jun 2018
Ok, with some help from @apeltzer we finally have a working Kraken module! 🎉
It works by parsing all log files it finds, then finding the top taxa across each taxa rank (skipping partial taxa and using percentages instead of counts). It then generates a bar plot showing the number of reads from each sample that fall into these top taxa, plus reads falling into other taxa and unclassified reads:
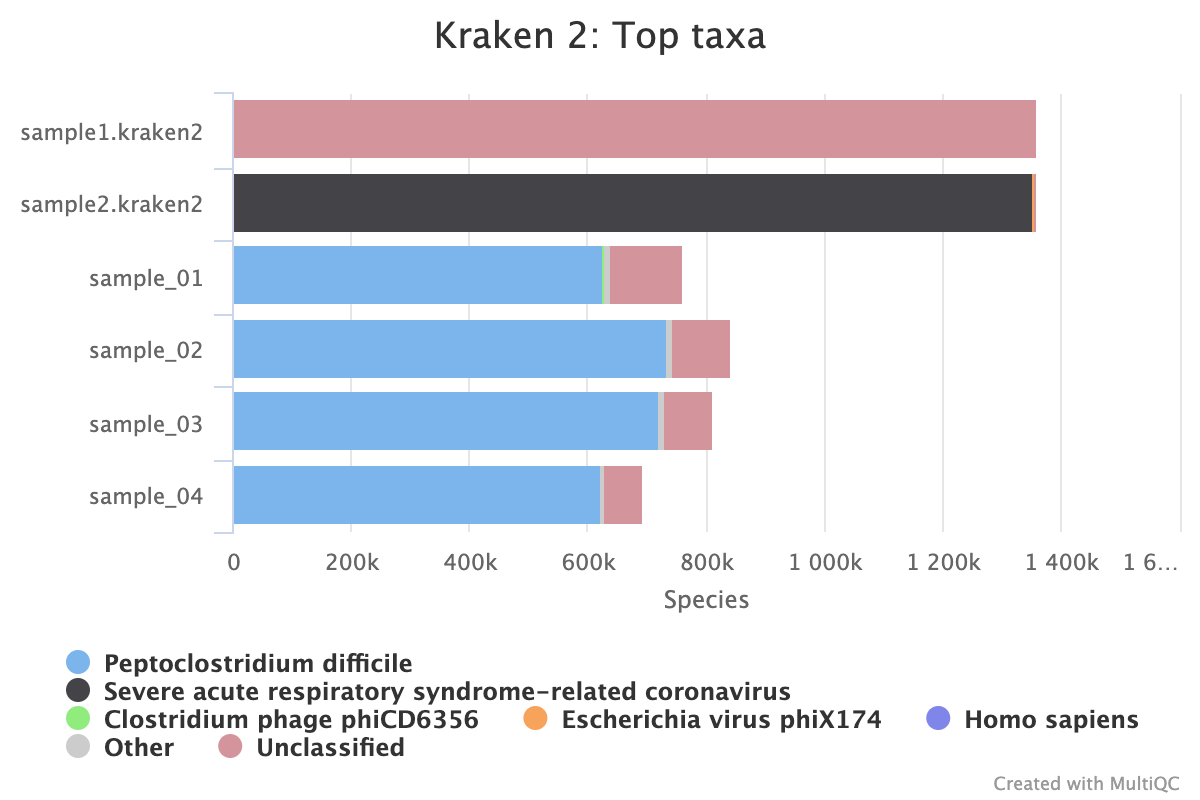
It shows species by default, but you can tab through the different ranks, eg. Domain:
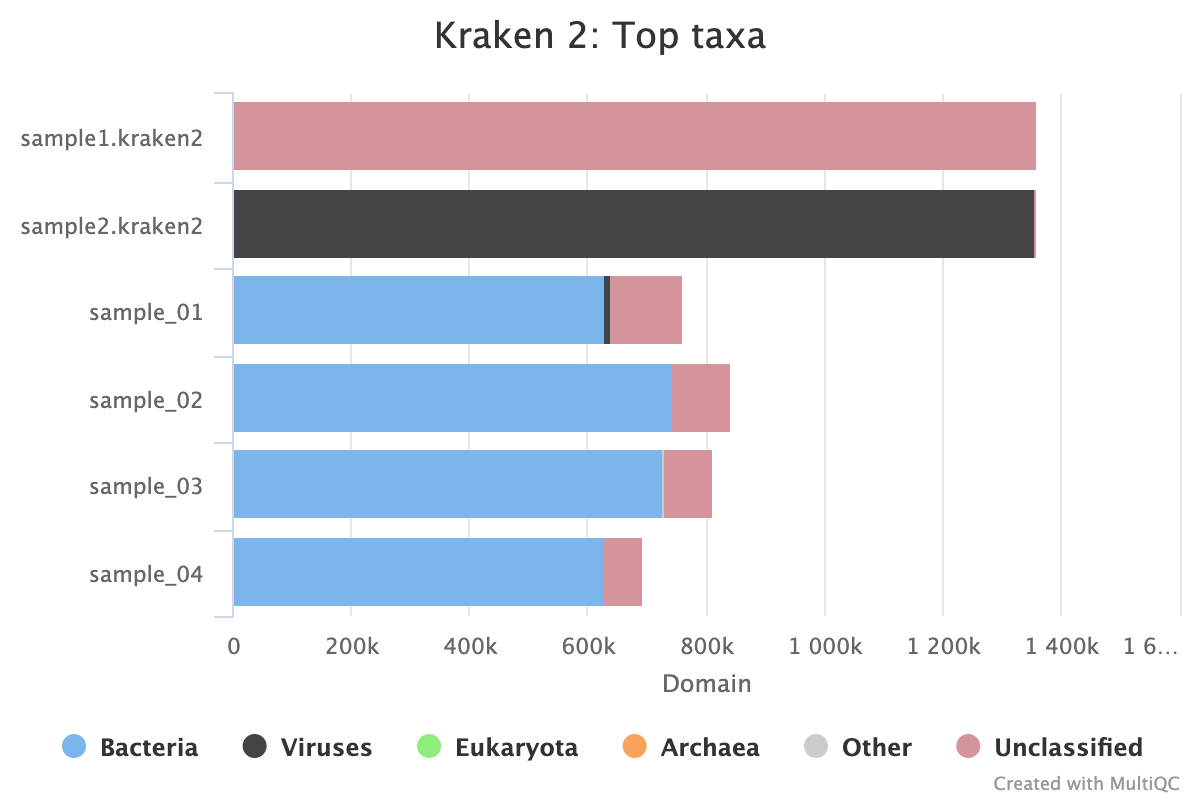
Please take a look if you can and try to break it 😀 If you have any suggestions for additional features, please open a new issue for them 🚀
Phil
ewels
on 25 May 2020
Related issues
 berguner
·
5Comments
berguner
·
5Comments
 lbeltrame
·
5Comments
lbeltrame
·
5Comments
 cgirardot
·
4Comments
cgirardot
·
4Comments
 tluquez
·
6Comments
tluquez
·
6Comments
 your-highness
·
6Comments
your-highness
·
6Comments
Most helpful comment
Ok, with some help from @apeltzer we finally have a working Kraken module! 🎉
It works by parsing all log files it finds, then finding the top taxa across each taxa rank (skipping partial taxa and using percentages instead of counts). It then generates a bar plot showing the number of reads from each sample that fall into these top taxa, plus reads falling into other taxa and unclassified reads:
It shows species by default, but you can tab through the different ranks, eg. Domain:
Please take a look if you can and try to break it 😀 If you have any suggestions for additional features, please open a new issue for them 🚀
Phil