Msprime: [stats tests] Add checks for variable recombination rate in DTWF
Add some plots comparing the Hudson and DTWF models in terms of the breakpoint distribution, under a reasonably complex hotspot model.
 jeromekelleher
All 4 comments
Did a bit of poking around for multi-chrom sims and found what seems to be an issue (on 535f0ea). Could be that I don't understand the new interface though. Separating non-recombining chromosomes with a hotspot:
import msprime
import matplotlib.pyplot as plt

recombination_map = msprime.RecombinationMap(
        positions=[0, 100, 101, 201],
        rates=[0, 1, 0, 0],
        discrete=True)

ts_hudson = msprime.simulate(10, recombination_map=recombination_map, Ne=10)
ts_dtwf = msprime.simulate(10, recombination_map=recombination_map, Ne=10, model='dtwf')

fig, ax_arr = plt.subplots(2, 1)

for i, t in enumerate(ts_hudson.trees()):
    left, right = t.interval
    ax_arr[0].plot([i, i], [left, right], c='grey')

for i, t in enumerate(ts_dtwf.trees()):
    left, right = t.interval
    ax_arr[1].plot([i, i], [left, right], c='grey')

ax_arr[0].set_title('Hudson')
ax_arr[0].set_ylabel('tree interval')
ax_arr[1].set_title('DTWF')
ax_arr[1].set_ylabel('tree interval')
ax_arr[1].set_xlabel('tree index')

fig.savefig('breakpoint_dist.png')
gives me quite a big difference between the models:
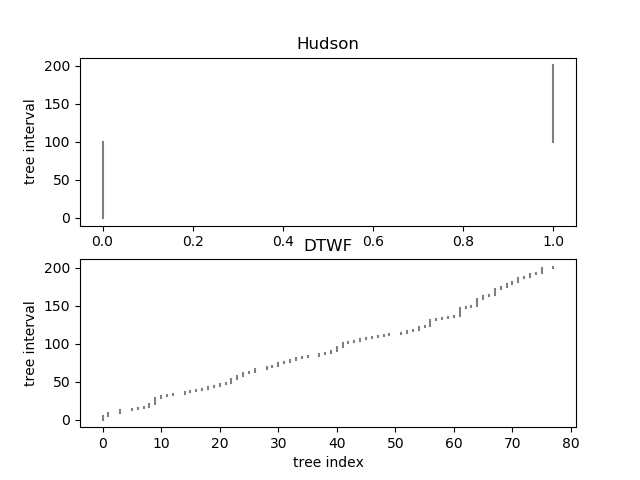
Seems like the recombination map might be getting averaged out in the DTWF case?
 DomNelson
on 7 Feb 2020
DomNelson
on 7 Feb 2020
Great, thanks @DomNelson --- I've marked this as a bug, we should get this sorted out as soon as we can @daniel-goldstein
jeromekelleher
on 10 Feb 2020
@DomNelson You're exactly right that the recombination rate is getting averaged out, and when we sample a position for the next breakpoint this way it neglects zones with no recombination. I changed it to instead select the next site in recombination space and then map back into physical coordinates. Now the results are consistent:
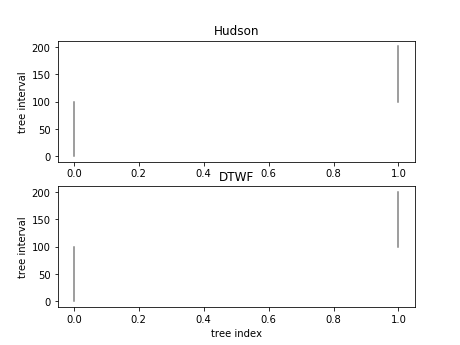
I'll add this example, along with the other tests, to verification.py and open up a PR.
 daniel-goldstein
on 10 Feb 2020
daniel-goldstein
on 10 Feb 2020
Excellent!
DomNelson
on 10 Feb 2020
Related issues
jeromekelleher
·
8Comments
 ismael-mendoza
·
7Comments
ismael-mendoza
·
7Comments
 petrelharp
·
10Comments
jeromekelleher
·
6Comments
petrelharp
·
10Comments
jeromekelleher
·
6Comments
 molpopgen
·
8Comments
molpopgen
·
8Comments
Most helpful comment
@DomNelson You're exactly right that the recombination rate is getting averaged out, and when we sample a position for the next breakpoint this way it neglects zones with no recombination. I changed it to instead select the next site in recombination space and then map back into physical coordinates. Now the results are consistent:
I'll add this example, along with the other tests, to
verification.pyand open up a PR.