Mpandroidchart: 两条曲线之间怎么加阴影?有这个方法吗?
 列如这个样子,可以画出来吗
 ashuang520
All 5 comments
What ashuang520 is asking:
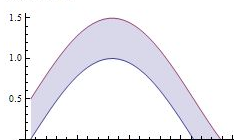
"Is it possible to add shades (The purple area) between 2 lines?"
 richardtph
on 24 May 2018
richardtph
on 24 May 2018
My problem is this ,Can you do it?(对,就是两条曲线 之间加阴影,可以实现吗?谢谢)
ashuang520
on 24 May 2018
My suggestion is:
- Draw upper dataSet with filled (purple) background.
- Draw lower dataSet with filled (white) background.
Try that approach and say if it works.
 RobertZagorski
on 24 May 2018
RobertZagorski
on 24 May 2018
❤1
🎉1
👍1
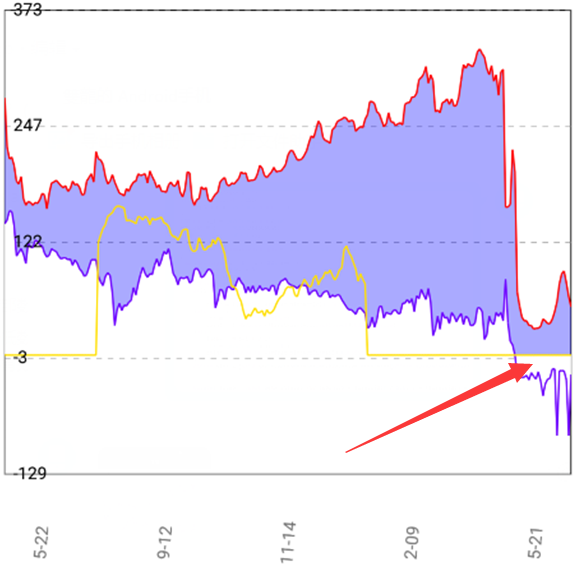
There will be a problem with a negative filling,This blank area is not drawn,It belongs to the white shadow drawn by second lines,Is there a way to solve it? thank you(存在负数填充就会出现这个问题,这个空白区域绘制不出来,它属于第二条线 绘制出来的白色阴影,有办法解决吗?谢谢)
ashuang520
on 25 May 2018
I tried your suggestion, but encountered a problem. When I set the fillalpha for lower dataSet to 255, the borders of the chart were occluded.How can I avoid this problem
 LiHexiang
on 11 Jun 2018
LiHexiang
on 11 Jun 2018
Was this page helpful?
0 / 5 - 0 ratings
Related issues
 Nima9Faraji
·
3Comments
Nima9Faraji
·
3Comments
 manucheri
·
3Comments
manucheri
·
3Comments
 botondbutuza
·
3Comments
botondbutuza
·
3Comments
 tsengvn
·
3Comments
tsengvn
·
3Comments
 JungYongWook
·
3Comments
JungYongWook
·
3Comments
Most helpful comment
My suggestion is:
Try that approach and say if it works.