Mpandroidchart: Bar entry values are not displayed in HorizontalBarCharts
A horizontal bar chart was creating using the following code:
    // Initialize bar chart
    HorizontalBarChart barChart = (HorizontalBarChart) findViewById(R.id.chart);

    // Create bars
    ArrayList<BarEntry> points = new ArrayList<>();
    points.add(new BarEntry(0f, 80));
    points.add(new BarEntry(1f, 50));
    points.add(new BarEntry(2f, 20));
    points.add(new BarEntry(3f, 60));
    points.add(new BarEntry(4f, 80));
    points.add(new BarEntry(5f, 100));
    points.add(new BarEntry(6f, 50));
    // Add bars to a bar set
    BarDataSet barSet = new BarDataSet(points, "Tenses");
    // Create a BarData object and assign it to the chart
    BarData barData = new BarData(barSet);
    // Display it as a percentage
    barData.setValueFormatter(new PercentFormatter());
    barChart.setData(barData);

    barSet.setDrawValues(true);

    barChart.invalidate();`
When running the application, the values corresponding to each bar are not displayed.

The expected result was to show values like in this picture:
This was tested using the MPAndroidChart:v3.0.2.
 lucadln
All 8 comments
Well after working more on this it seems that this is sometimes working and sometimes not. This is the corresponding code.
// Initialize bar chart
HorizontalBarChart barChart = (HorizontalBarChart) findViewById(R.id.chart);
obtainAllScores(scores);
// Create bars
ArrayList<BarEntry> yvalues = new ArrayList<>();
yvalues.add(new BarEntry(0f, percentages[0]));
yvalues.add(new BarEntry(1f, percentages[1]));
yvalues.add(new BarEntry(2f, percentages[2]));
yvalues.add(new BarEntry(3f, percentages[3]));
yvalues.add(new BarEntry(4f, percentages[4]));
yvalues.add(new BarEntry(5f, percentages[5]));
yvalues.add(new BarEntry(6f, percentages[6]));
// Create a data set
BarDataSet dataSet = new BarDataSet(yvalues, "Tenses");
dataSet.setDrawValues(true);
// Create a data object from the dataSet
BarData data = new BarData(dataSet);
// Format data as percentage
data.setValueFormatter(new PercentFormatter());
// Make the chart use the acquired data
barChart.setData(data);
// Create the labels for the bars
final ArrayList<String> xVals = new ArrayList<>();
xVals.add("Present");
xVals.add("Pres. Continuous");
xVals.add("Simple Past");
xVals.add("Past Perfect");
xVals.add("Conditional");
xVals.add("Cond. Perfect");
xVals.add("Future");
// Display labels for bars
barChart.getXAxis().setValueFormatter(new IndexAxisValueFormatter(xVals));
// Set the maximum value that can be taken by the bars
barChart.getAxisLeft().setAxisMaximum(100);
// Bars are sliding in from left to right
barChart.animateXY(1000, 1000);
// Display scores inside the bars
barChart.setDrawValueAboveBar(false);
// Hide grid lines
barChart.getAxisLeft().setEnabled(false);
barChart.getAxisRight().setEnabled(false);
// Hide graph description
barChart.getDescription().setEnabled(false);
// Hide graph legend
barChart.getLegend().setEnabled(false);
// Design
dataSet.setColors(ColorTemplate.VORDIPLOM_COLORS);
data.setValueTextSize(13f);
data.setValueTextColor(Color.DKGRAY);
barChart.invalidate();
When all bars have the value 100 no percentage is shown.
However if I make one bar to have the value 0 then percentages will be shown.
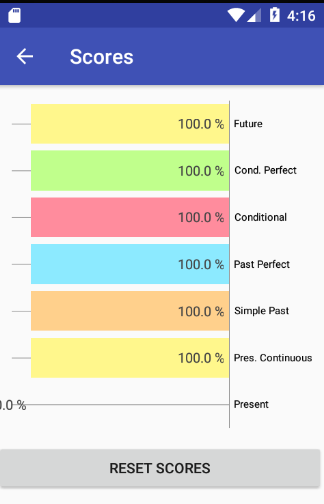
Once the percentage changes the values will dissapear again.
The whole code is available on the DCT15 branch on my git repo https://github.com/lucadln/android.git in the DutchConjugationTrainer folder.
LATER EDIT: After more investigation it seems that this is a duplicate of #2452 and #2180 .It would be great if there would be at least a workaround for this.
lucadln
on 27 Aug 2017
Ok, one more update: if I zoom out horizontally the values are shown.
This can also be seen in the pictures above actually. In the first picture the bars are spanned starting from the left side of the screen. In the second picture the 0.0% makes the bars start a little to the right.
Any solutions for this?
lucadln
on 28 Aug 2017
Another issue similar to mine: https://github.com/PhilJay/MPAndroidChart/issues/3212
lucadln
on 30 Aug 2017
Ok, I figured it out.
So the strangest part was that the labels were shown if one of the following conditions was met:
- I zoomed out manually when using the application OR
- One of the values in my chart was 0.
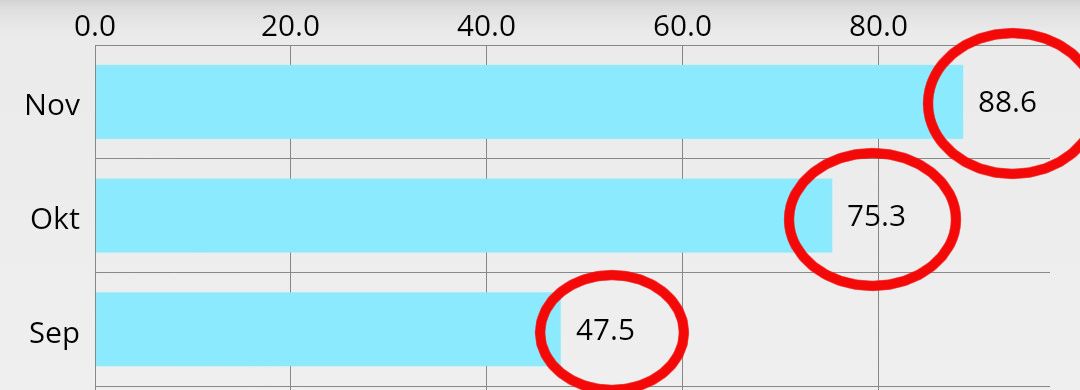
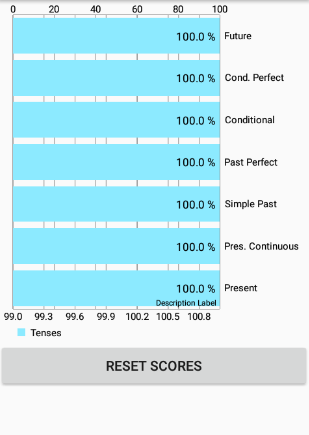
My chart contained labels with a maximum value of 100:
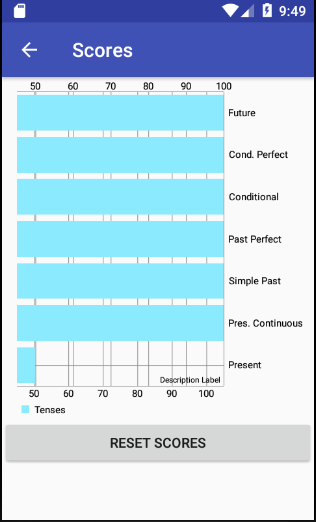
...but I noticed that the bars were cropped (i.e. the minimum shown value was 50). When having one value with 0 or when zooming out then the whole graph would be displayed and hence also its labels:

The solution which did it is just adding the axis minimum. In this way, no matter what the scores are, the bars were fully displayed. So the solution for me was just:
barChart.getAxisLeft().setAxisMaximum(100);
barChart.getAxisLeft().setAxisMinimum(0);
And now the result is:
I will close this issue now.
lucadln
on 2 Sep 2017
How delete precent?
 Emad-Alhattami
on 22 Apr 2020
Emad-Alhattami
on 22 Apr 2020
I need gust number with out precent % ?
Emad-Alhattami
on 22 Apr 2020
I am able to display the entry values, but its font size is very less. How to increase the font size?
 6vedant
on 7 Oct 2020
6vedant
on 7 Oct 2020
@6vedant In Kotlin I used this, where dataSet was my BarDataSet
dataSet.valueTextSize = 14f
In Java it must be something like
dataset.setValueTextSize(14.0f)
 MarcellHarmaci
on 11 Dec 2020
MarcellHarmaci
on 11 Dec 2020
Related issues
 mrZizik
·
3Comments
mrZizik
·
3Comments
 Giammaofwar
·
3Comments
Giammaofwar
·
3Comments
 AndroidJiang
·
3Comments
AndroidJiang
·
3Comments
 tsengvn
·
3Comments
tsengvn
·
3Comments
 galex
·
3Comments
galex
·
3Comments
Most helpful comment
Ok, I figured it out.
So the strangest part was that the labels were shown if one of the following conditions was met:
My chart contained labels with a maximum value of 100:

...but I noticed that the bars were cropped (i.e. the minimum shown value was 50). When having one value with 0 or when zooming out then the whole graph would be displayed and hence also its labels:

The solution which did it is just adding the axis minimum. In this way, no matter what the scores are, the bars were fully displayed. So the solution for me was just:
barChart.getAxisLeft().setAxisMaximum(100);
barChart.getAxisLeft().setAxisMinimum(0);
And now the result is:

I will close this issue now.