Mpandroidchart: remove old data in real time ploting
Hi everybody,
I would like to draw data in real time , then remove old data.
I found this code but in latest version of mpandroidchart I cant find this metho,
so what should I do? please help me.
in latest version of library ,What is the alternative to this command?:
== set.getValues() ==
//================================================================
private static final int VISIBLE_NUM = 5;
private void refreshData(float value) {
LineData data = mChart.getData();
if (data != null) {
// at least one entry exists
LineDataSet set = data.getDataSetByIndex(0); // should not be null, because we created it before
set.setColor(Color.BLUE);
set.setDrawCircleHole(false);
set.setValueTextSize(9f);
data.addDataSet(set);
// check and remove oldest entry
if(set.getEntryCount() == VISIBLE_NUM) {
set.removeEntry(0); // remove oldest
// change Indexes - move to beginning by 1
for (Entry entry : set.getValues()) {
entry.setX(entry.getX() - 1);
}
}
// add Entry to the end of Line with X position = getEntryCount(), Y pos as = value
data.addEntry(new Entry(set.getEntryCount(), value), 0);
} else {
// create all necessary stuff on the first run
ArrayList
data = new LineData(dataSets); // create
       LineDataSet mySet = new LineDataSet(null, getString(R.string.my_graph_name)); // create empty
       mySet.setColor(Color.BLUE);
       // ..... the rest of settings
       data.addDataSet(mySet); // should be assigned to parent BEFORE adding new Entry
       data.addEntry(new Entry(mySet.getEntryCount(), value), 0); // add FIRST Entry to single mySet with index=0
       mChart.setData(data);
    }
// notify about changes
mChart.notifyDataSetChanged();
mChart.invalidate();
}
/////////////////////////////////////
Thank you and best regard.
 avrpic8
All 7 comments
Is it correct? but not work yet, please help.
    `LineData` dataChart = mainChart.getData();

    if (dataChart != null) {

        ILineDataSet set = dataChart.getDataSetByIndex(0);

        if (set == null) {
            set = createSet(ColorTemplate.rgb(colorChart),ColorTemplate.rgb(colorFill));
            dataChart.addDataSet(set);
        }

        dataChart.addEntry(new Entry(set.getEntryCount(),sensorEvent.values[2]),0);
        dataChart.notifyDataChanged();

        if(set.getEntryCount() > 20){
            set.removeFirst();
            dataChart.notifyDataChanged();
        }

        // let the chart know it's data has changed
        mainChart.notifyDataSetChanged();
        // limit the number of visible entries
        mainChart.setVisibleXRangeMaximum(20);
        mainChart.moveViewToX(dataChart.getEntryCount());``
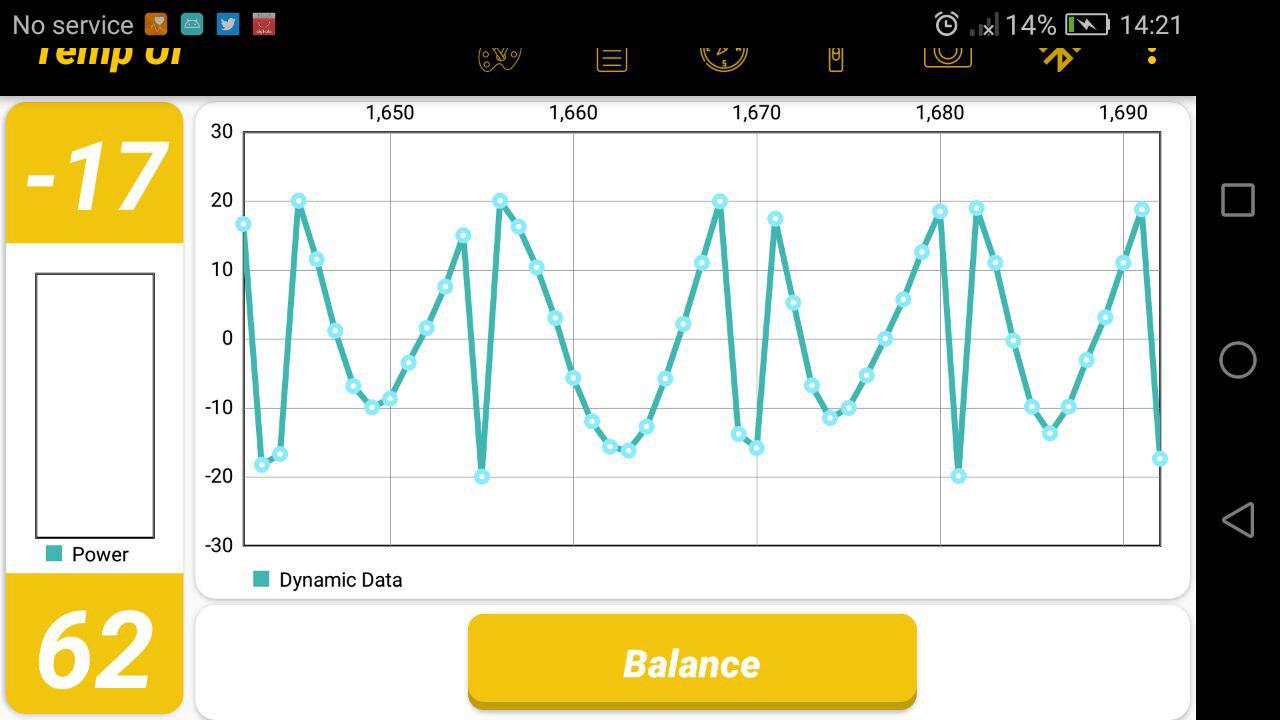
and when use this method my chart become ,
and when I remove this code "if(set.getEntryCount())......"
and then mainChart.setVisibleXRangeMaximum(20) to mainChart.setVisibleXRangeMaximum(300) become correct.
so,what should I do to remove old data from the chart?
avrpic8
on 14 Jun 2017
We have something like this in the code in utility class:
public class ChartUtils {
    private static final int MAX_ENTRIES = 50;
    // (more code, irrelevant for the issue...)
    public static void removeOutdatedEntries(DataSet... dataSets) {
        for (DataSet ds : dataSets) {
            while (ds.getEntryCount() > MAX_ENTRIES) {
                ds.removeFirst();
            }
        }
    }
}
We call it like this:
ChartUtils.removeOutdatedEntries(dataSet);
lineData.notifyDataChanged();
chart.notifyDataSetChanged();
chart.invalidate();
It works perfectly :)
 salceson
on 18 Jun 2017
salceson
on 18 Jun 2017
Hi my bro thanks for your answer,
but I have the same problem yet.
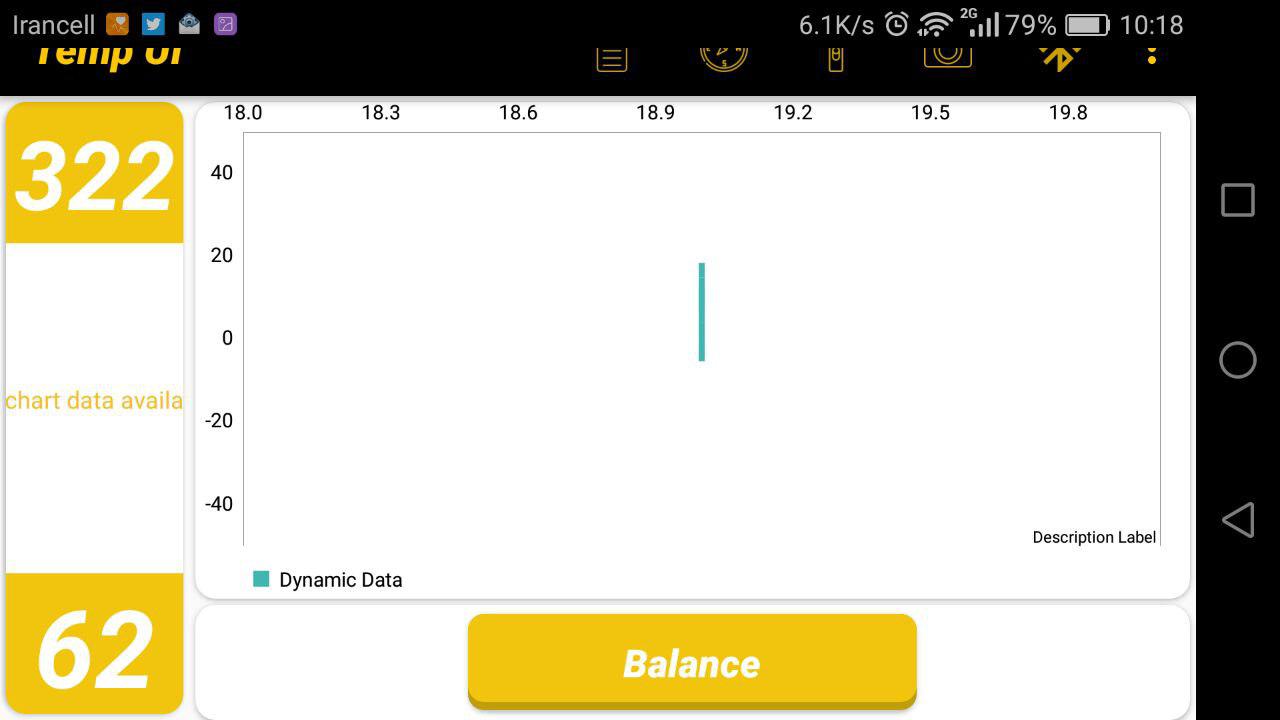
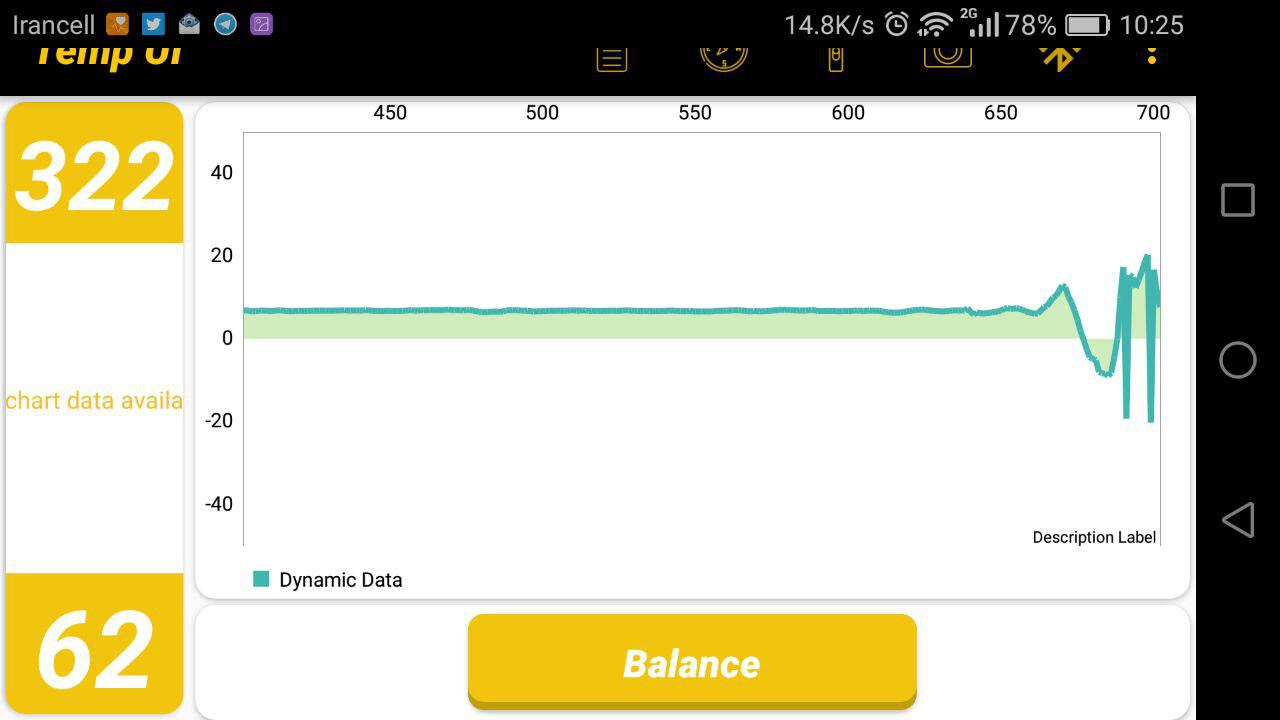
This is my output result:
(I set Max Entry to 50) -> when I use the bottom code the result is correct.
`
    dataChart = mainChart.getData();

    if (dataChart != null) {

        set = (LineDataSet) dataChart.getDataSetByIndex(0);
        if (set == null) {
            set = createSet(ColorTemplate.rgb(colorChart), ColorTemplate.rgb(colorFill));
            dataChart.addDataSet(set);
        }


        dataChart.addEntry(new Entry(set.getEntryCount(), sensorEvent.values[2]), 0);
        dataChart.notifyDataChanged();
        //ChartUtils.removeEntries(set);
        mainChart.notifyDataSetChanged();
        mainChart.invalidate();

        mainChart.setVisibleXRangeMaximum(MAX_ENTRIES);
        mainChart.moveViewToX(dataChart.getEntryCount());
    }
and when I use this code again the output is incorrect.
`dataChart = mainChart.getData();
    if (dataChart != null) {

        set = (LineDataSet) dataChart.getDataSetByIndex(0);
        if (set == null) {
            set = createSet(ColorTemplate.rgb(colorChart), ColorTemplate.rgb(colorFill));
            dataChart.addDataSet(set);
        }


        dataChart.addEntry(new Entry(set.getEntryCount(), sensorEvent.values[2]), 0);
        dataChart.notifyDataChanged();
        ChartUtils.removeEntries(set);
        mainChart.notifyDataSetChanged();
        mainChart.invalidate();

        //mainChart.setVisibleXRangeMaximum(MAX_ENTRIES);
        //mainChart.moveViewToX(dataChart.getEntryCount());
    }`
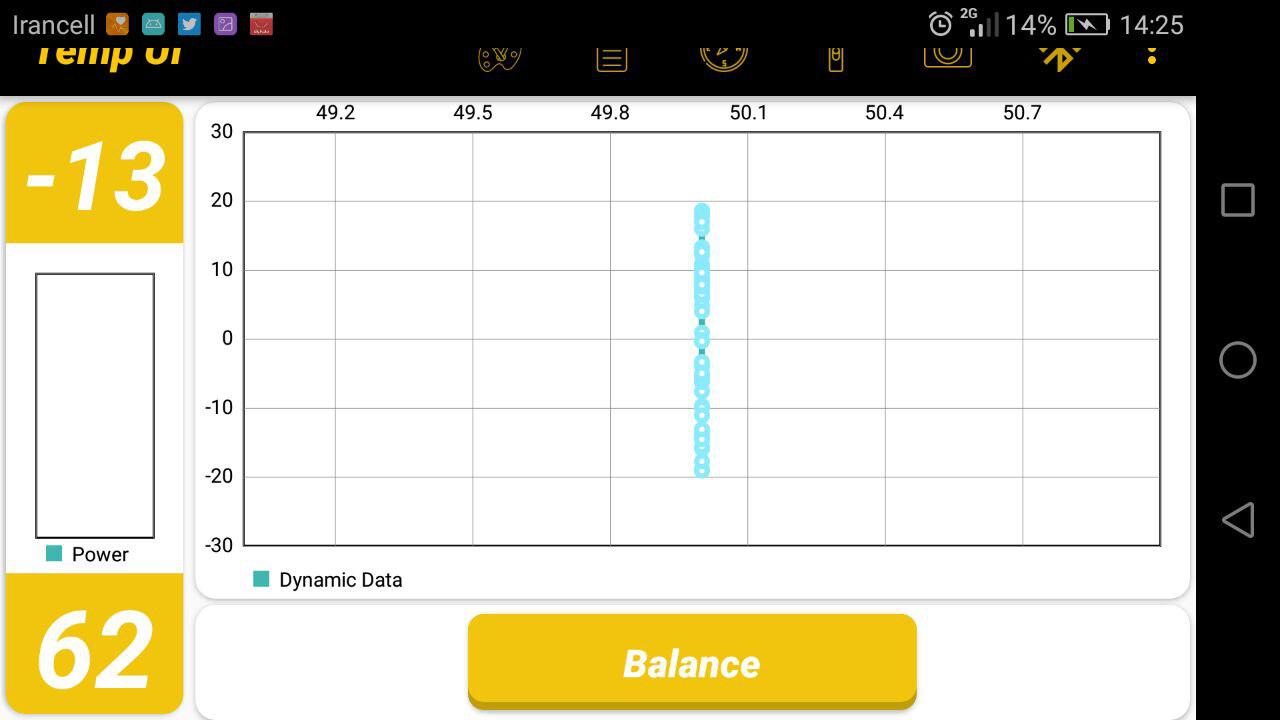
As you can see in the second case,points are connected vertically.
So what is wrong?
There is my other part of my code.
` private void initMainChart() {
    mainChart = (LineChart) findViewById(R.id.mainChart);

    //mainChart.getAxisLeft().setDrawGridLines(false);
    mainChart.getAxisRight().setDrawGridLines(false);
    mainChart.getAxisRight().setDrawLabels(false);
    //mainChart.getXAxis().setDrawGridLines(false);
    //mainChart.getAxisLeft().setDrawLabels(false);
    //mainChart.getXAxis().setDrawLabels(false);

    mainChart.setDescription(desc);
    //mainChart.setBackgroundColor(Color.LTGRAY);

    // setting Left Axis
    YAxis leftAxis = mainChart.getAxisLeft();
    leftAxis.setAxisMaximum(30f);
    leftAxis.setAxisMinimum(-30f);

    LineData data = new LineData();
    // add empty data
    mainChart.setData(data);

    //mainChart.animateX(1000);
    ///mainChart.animateXY(500,500);
    //mainChart.setTouchEnabled(false);
    //mainChart.setHardwareAccelerationEnabled(true);
    mainChart.setDrawBorders(true);
    mainChart.setDragEnabled(false);

    //mainChart.setVisibleYRangeMaximum(set.getYMax() + 12, YAxis.AxisDependency.LEFT);
`}
` private LineDataSet createSet(int colorChart, int colorFill) {
    LineDataSet set = new LineDataSet(null, "Dynamic Data");
    //set.setAxisDependency(YAxis.AxisDependency.LEFT);
    set.setColor(colorChart);
    //set.setDrawCircles(false);
    set.setCircleRadius(4f);
    set.setLineWidth(3f);
    //set.setDrawFilled(true);
    set.setFillColor(colorFill);
    set.setFillAlpha(65);
    set.setDrawHighlightIndicators(false);
    //set.setHighLightColor(Color.rgb(244, 117, 117));
    set.setDrawValues(false);
    return set;
}`
` private static class ChartUtils{
    public static void removeEntries(DataSet... dataSets) {

        for(DataSet ds: dataSets){

            while (ds.getEntryCount() > MAX_ENTRIES) {
                ds.removeFirst();
                ds.notifyDataSetChanged();
            }
        }
    }
}`
again, please help me and I am waiting for your answer.
Thanks sir,
best regard.
avrpic8
on 19 Jun 2017
This is happening due to the fact that you are adding entries to chart instead of data set.
Instead of this line:
dataChart.addEntry(new Entry(set.getEntryCount(), sensorEvent.values[2]), 0);
try:
set.addEntry(new Entry(set.getEntryCount(), sensorEvent.values[2]));
As no data is added to set, the set.getEntryCount() is returning same value all the time and that's why you have data with same x coordinate.
salceson
on 19 Jun 2017
Hi ,thanks for your answer my bro.
I try a lot but I have the same problem.
I dont Where is my mistake?
I'm so confused.
this is my code :
`dataChart = mainChart.getData();
    if (dataChart != null) {

        DataSet set = (DataSet) dataChart.getDataSetByIndex(0);
        if (set == null) {
            set = createSet(ColorTemplate.rgb(colorChart), ColorTemplate.rgb(colorFill));
            dataChart.addDataSet((LineDataSet) set);
        }


        ChartUtils.removeEntries(set);
        set.addEntry(new Entry(set.getEntryCount(), sensorEvent.values[2]));
        dataChart.notifyDataChanged();

        mainChart.notifyDataSetChanged();
        mainChart.invalidate();
}
private static class ChartUtils{
    public static void removeEntries(DataSet... dataSets) {

        for(DataSet ds: dataSets){

            while (ds.getEntryCount() > MAX_ENTRIES) {
                ds.removeFirst();
                //ds.notifyDataSetChanged();
            }
        }
    }
}`
Is it a bug in this version?,I dont know.
It seems no different between dataChart.addEntry and set.addEntry when I add them.
please help
thank you again.
avrpic8
on 19 Jun 2017
Hi everybody,
The problem was solved.
I should add this lines.
if(set.getEntryCount() == MAX_ENTRIES) {
                set.removeFirst();
                // change Indexes - move to beginning by 1
                for (Entry entry : set.getValues()
                    entry.setX(entry.getX() - 1);
  }
avrpic8
on 24 Jun 2017
The last comment by avrpic8 worked fine for me. Now I'm working with Visual C# on a similar line Chart and I need to implement the same solution to the problem of removing the first entry in a series, and the problem is that the series then collapses, so any suggestions on how to "translate" the following method for reordering the series:
for(Entry entry : set.getValues() entry.setX(entry.getX() -1)
in Visual C# ???
Thanks in advance.
 royseberg
on 6 Jul 2018
royseberg
on 6 Jul 2018
Related issues
 vishvendu
·
3Comments
vishvendu
·
3Comments
 SutharRohit
·
3Comments
SutharRohit
·
3Comments
 botondbutuza
·
3Comments
botondbutuza
·
3Comments
 OnlyInAmerica
·
3Comments
OnlyInAmerica
·
3Comments
 chathudan
·
3Comments
chathudan
·
3Comments
Most helpful comment
This is happening due to the fact that you are adding entries to chart instead of data set.
Instead of this line:
try:
As no data is added to set, the
set.getEntryCount()is returning same value all the time and that's why you have data with same x coordinate.