Mpandroidchart: setting labels on x axis in line chart
I don't know how to set labels in x axis in the new version of mpandroidchart. Have gone through the examples but didn't find any.
 arunrajput1007
All 15 comments
Same here bro
 chenshuiluke
on 3 Oct 2016
chenshuiluke
on 3 Oct 2016
I kind of figured it out:
package com.lukechenshui.chart;

import android.support.v7.app.AppCompatActivity;
import android.os.Bundle;

import com.github.mikephil.charting.charts.LineChart;
import com.github.mikephil.charting.components.AxisBase;
import com.github.mikephil.charting.components.XAxis;
import com.github.mikephil.charting.data.Entry;
import com.github.mikephil.charting.data.LineData;
import com.github.mikephil.charting.data.LineDataSet;
import com.github.mikephil.charting.formatter.AxisValueFormatter;

import java.util.ArrayList;
import java.util.Arrays;
import java.util.HashMap;
import java.util.List;

public class MainActivity extends AppCompatActivity {

    @Override
    protected void onCreate(Bundle savedInstanceState) {
        super.onCreate(savedInstanceState);
        setContentView(R.layout.activity_main);
        LineChart chart = (LineChart) findViewById(R.id.chart);

        int[] numArr = {1,2,3,4,5,6};

        final HashMap<Integer, String>numMap = new HashMap<>();
        numMap.put(1, "first");
        numMap.put(2, "second");
        numMap.put(3, "third");
        numMap.put(4, "fourth");
        numMap.put(5, "fifth");
        numMap.put(6, "sixth");

        List<Entry> entries1 = new ArrayList<Entry>();

        for(int num : numArr){
            entries1.add(new Entry(num, num));
        }

        LineDataSet dataSet = new LineDataSet(entries1, "Numbers");


        LineData data = new LineData(dataSet);

        XAxis xAxis = chart.getXAxis();
        xAxis.setValueFormatter(new AxisValueFormatter() {

            @Override
            public String getFormattedValue(float value, AxisBase axis) {

                return numMap.get((int)value);
            }

            @Override
            public int getDecimalDigits() {
                return 0;
            }
        });
        chart.setData(data);
        chart.invalidate();

    }
}

chenshuiluke
on 3 Oct 2016
Can not resolve symbol AxisValueFormatter.
Did the api change again?
 qacwnfq
on 28 May 2017
qacwnfq
on 28 May 2017
It did. use IAxisValueFormatter
XAxis xAxis = chart.getXAxis();
xAxis.setValueFormatter(new IAxisValueFormatter() {
@Override
public String getFormattedValue(float value, AxisBase axis) {
  return null;
}
});
 noelrmrz
on 29 May 2017
noelrmrz
on 29 May 2017
X axis value is not coming continuously. If I am using value 0 to 10 then it's coming as 0 ,2,4,6,8,10,
I am using IAxisValueFormatter to format x values.
In getFormattedValue(float value, AxisBase axis) methods values are coming as 0 ,2,4,6,8,10.
It should come as 0,1,2,3,4,5,6,7,8,9,10.
Can anyone help ?
 shaktipm
on 12 Jul 2017
shaktipm
on 12 Jul 2017
Try to put this line
xAxis.setLabelCount(numArr.length);
representing the number of your labels.
 ulaai
on 1 Aug 2017
ulaai
on 1 Aug 2017
how to set x axis value yearly basis
 FazalHussain
on 5 Oct 2017
FazalHussain
on 5 Oct 2017
even I am having the same problem as @shaktipm . the float value is incrementing as 0,2,4,6,8,10 instead of 0,1,2,3,4 . I have five labels in my lables array. xAxis.setLabelCount(lables.length); does'nt show any effect the output is the same. can you please help
 Sameera08
on 2 Nov 2017
Sameera08
on 2 Nov 2017
Yes I'm also facing this issue. When dataset increases, getFormattedValue value getting as 0,2,4,6, then 0,3,6,9... and 0,5,10,15.. Can anyone help me to get it as 0 to N without any intermediate interval?
 moorthysubu
on 29 Dec 2017
moorthysubu
on 29 Dec 2017
I think you can use xAxis.setGranularity(1.0f) or xAxis.setLabelCount(N, true)
 df1994
on 3 Jan 2018
df1994
on 3 Jan 2018
Hi, please someone explains, when I have below numbers as an array of Entries:
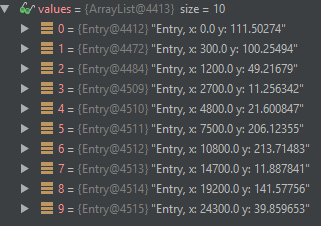
Why I receive completely different numbers as an argument for below method?
How can I have chart with XAxis lables in direct line with circles?
@Override
    public String getFormattedValue(float value, AxisBase axis) {}
 patzu
on 10 Mar 2018
patzu
on 10 Mar 2018
For the com.github.PhilJay:MPAndroidChart:v3.0.3
I am using a label list:
final List list_x_axis_name = new ArrayList<>();
list_x_axis_name.add("label1");
list_x_axis_name.add("label2");
list_x_axis_name.add("label3");
list_x_axis_name.add("label4");
list_x_axis_name.add("label5");
and setting the label like this:
BarChart chartBar = (BarChart) findViewById(R.id.chartBar);
XAxis xAxis = chartBar.getXAxis();
xAxis.setGranularity(1f);
xAxis.setCenterAxisLabels(true);
xAxis.setLabelRotationAngle(-90);
xAxis.setValueFormatter(new IAxisValueFormatter() {
@override
public String getFormattedValue(float value, AxisBase axis) {
if (value >= 0) {
if (value <= list_x_axis_name.size() - 1) {
return list_x_axis_name.get((int) value);
}
return "";
}
return "";
}
});
 Snehalsixthsense
on 21 Apr 2018
Snehalsixthsense
on 21 Apr 2018
Closing old issue. If anyone still has this question please open a new one.
 almic
on 28 Oct 2018
almic
on 28 Oct 2018
Awesome!
 nvquangth
on 29 Nov 2018
nvquangth
on 29 Nov 2018
xAxis.setLabelCount(lineData.entryCount, true);
2nd param must be true
 jonfabris
on 15 Jun 2020
jonfabris
on 15 Jun 2020
Related issues
 xainbutt
·
34Comments
xainbutt
·
34Comments
 bbrosius
·
14Comments
bbrosius
·
14Comments
 hongsonitptit
·
22Comments
hongsonitptit
·
22Comments
 onyame
·
116Comments
onyame
·
116Comments
 anitaa1990
·
18Comments
anitaa1990
·
18Comments
Most helpful comment
I kind of figured it out: