Mongoose: Memory leak on replica set
Detecting memory leak in my nodejs service using mongoose

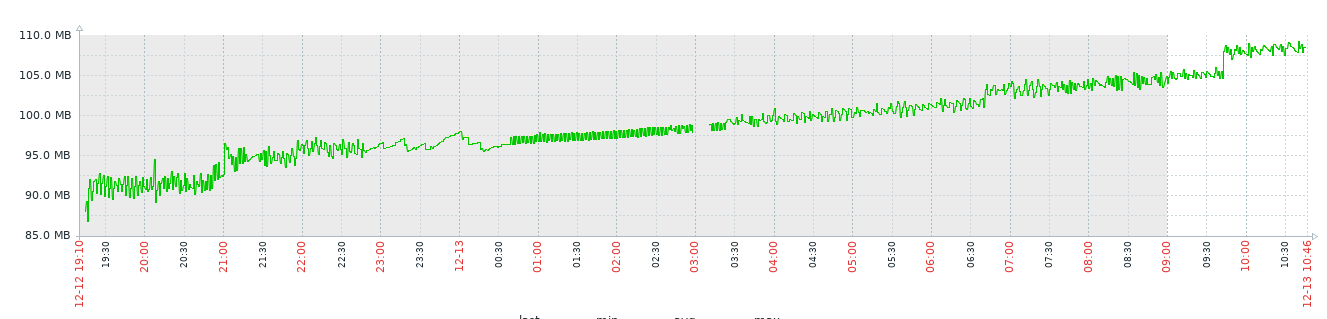
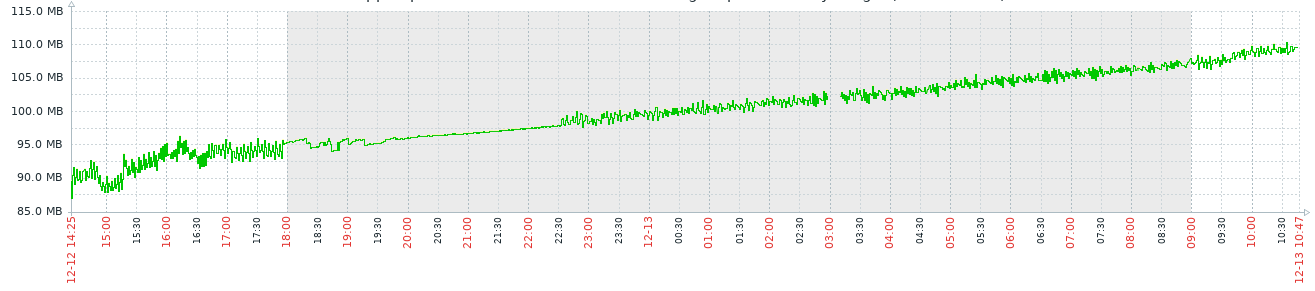
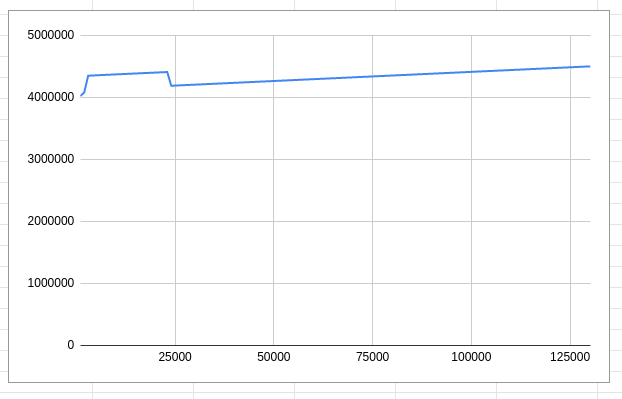
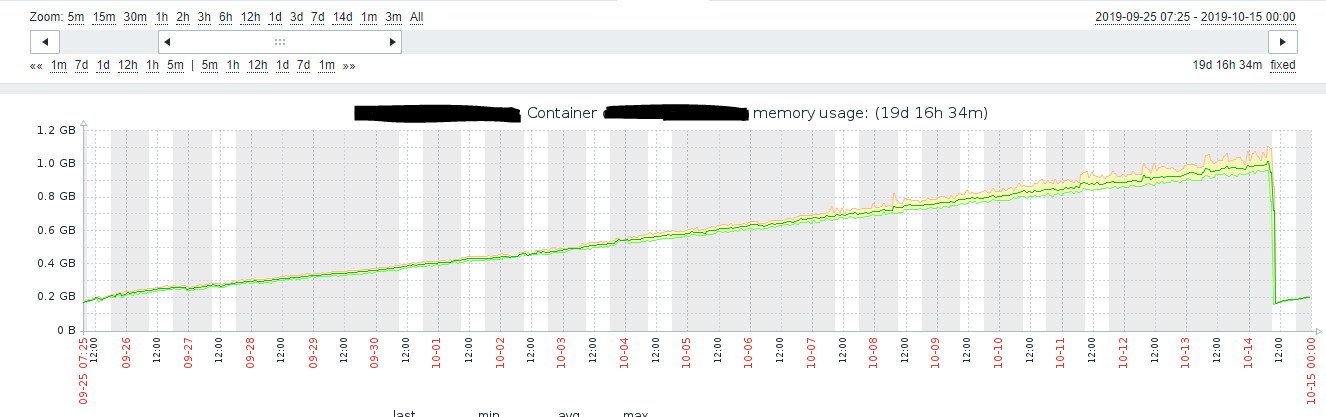
This is the memory graph when connected to replicaset.

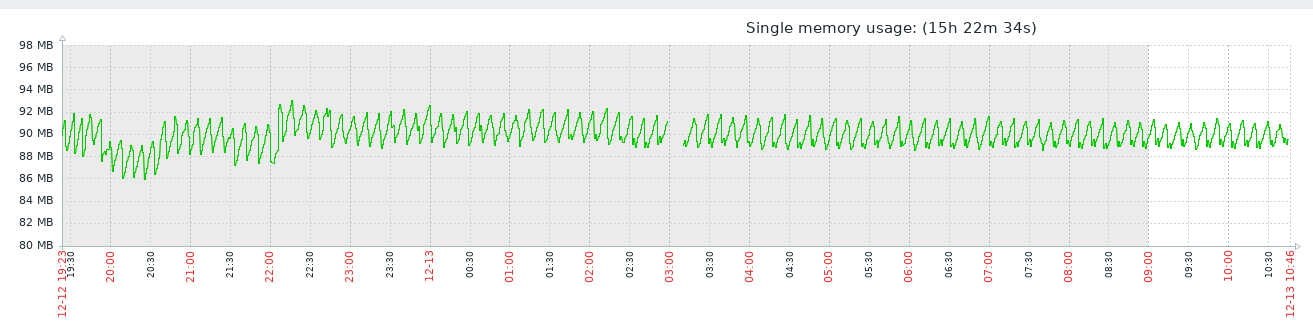
this is the memory graph when connected to a single mongo.
Both mongo is the same server
Mongoose version : ^5.6.2
var connection = mongoose.createConnection(connectionString)
 drmmyx
All 12 comments
Are you connecting to Atlas or a local replica set?
 vkarpov15
on 6 Dec 2019
vkarpov15
on 6 Dec 2019
Are you connecting to Atlas or a local replica set?
Local replica set
drmmyx
on 12 Dec 2019
i will prepare the service .. after clean up and reproduce the issue and upload in a while
drmmyx
on 12 Dec 2019
Hi , this is the clean project that can replicate the issue ..
The mongo connection is format: mongodb://username:password@node1:27017,node2:27017/db?replicaSet=mongo
You can build a docker image by docker build -t test-mongo-issue:1.0 .
The following link is the step my infrastructure team use to set up mongo replica set
https://www.howtoforge.com/tutorial/mongodb-replication-on-centos-7/
The mongo version of the database is 3.4
drmmyx
on 13 Dec 2019
Updated image of using single mongo db connection
Updated image of using replica set on mongo db connection
drmmyx
on 13 Dec 2019
I'm also investigating a memory leak that seems to be caused by mongoose with replica sets. It's a custom database setup on google cloud, not using atlas.
Sadly, I cannot provide a reproducible repo as it is confidential, however, I'll try and replicate with a similar setup and see if I could share it.
 TheImpressionist
on 16 Dec 2019
TheImpressionist
on 16 Dec 2019
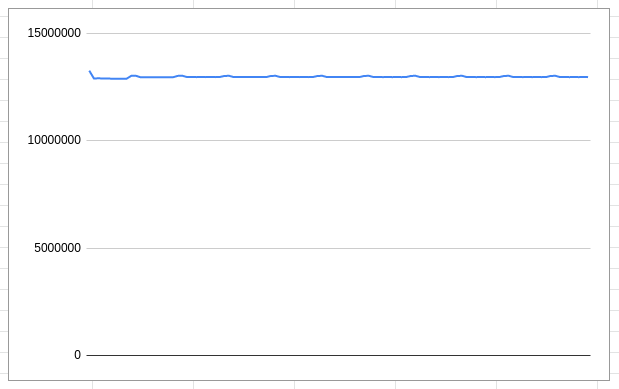
How are you measuring memory usage? Here's the memory usage from the below script:
'use strict';

const mongoose = require('mongoose');

run().catch(err => console.log(err));

async function run() {
  await mongoose.connect('mongodb://localhost:27017/test', {
    useNewUrlParser: true,
    useUnifiedTopology: true
  });

  const start = Date.now();
  while (true) {
    await new Promise(resolve => setTimeout(resolve, 1000));
    console.log(Date.now() - start, process.memoryUsage().heapUsed);

    global.gc();

    await new Promise(resolve => setTimeout(resolve, 1000));
    console.log(Date.now() - start, process.memoryUsage().heapUsed);
  }
}
If you get rid of the gc() call the above script does show increasing heap usage, but that's just due to the fact that Node's garbage collection runs at unpredictable intervals. Manual gc() demonstrates that there's no leak: Node can clean up the memory if it decides to run garbage collection.
vkarpov15
on 22 Dec 2019
@vkarpov15 tested with manually calling gc() will resolve the memory increasing issue with the tradeoff of increasing the cpu usage .... increasing to 175% +-
will let it run for a longer duration and see how it is
but considering .... having memory increasing on just mongo connection (replica set) even it is not memory leak ( as gc() will remove the memory usage ) might be somethings wrong .... and the memory increase faster than unpredictable intervals gc cleanup
manually running gc() with intervals might not be a good permanent solution ( also with high cpu usage trade off)
drmmyx
on 23 Dec 2019
I'm not suggesting that running gc() manually is the right solution, far from it, there's rarely any reason to run gc() in production. I'm saying that Node.js will be able to clean up the memory when it needs to, just V8's garbage collection doesn't necessarily run when you might expect it to. Seeing increasing memory usage isn't necessarily indicative of a leak - for example, the below script shows increasing memory usage after an early dip:
'use strict';

const start = Date.now();

setInterval(() => {
  console.log(Date.now() - start, process.memoryUsage().heapUsed);
}, 1000);
TLDR; I don't think this is a leak, testing with gc() shows that node can clean up the memory when it decides to run garbage collection.
vkarpov15
on 23 Dec 2019
@vkarpov15
yes .... my result for testing for calling gc() with interval of 1 hrs and 30sec for the past day show increasing in memory -- it doesnt really solve it unless i call it all the time with while(true)
we agree it is not a leak ....
so for a nodejs application with only mongo connection to replicaset having memory increase to 1gb ( where we force to restart it as service start to fail ) without doing anything
we are running on multiple similar application on the same service ( as docker container ) having all of the memory increasing reaching limit become a serious issue to us ...
now we got 2 options :
- schedule restart ( once per week , before memory hitting our limit ) which what we are doing now
- not connect to replicaset ( which infrastructor team will never agree to it )
what are the possible options we can go for ?
drmmyx
on 24 Dec 2019
Does your process actually run out of memory? Or is the issue just that your process hits a internal memory limit but doesn't actually run out of memory?
You can take a look at this article which tells you how to reduce Node.js' max heap size.
Another alternative is to run a function once a day or so that checks memory usage and runs global.gc() if you're getting close to your internal memory limit.
vkarpov15
on 26 Dec 2019
@drmmyx , i got the same problem in my project. so i have to restart my project every month. have you solved the problem now? thank you
the splunk log error :
<30>Aug  3 18:05:03 10.20.1.26 PandoraProd-api-ad[3475]: [24:0x55988238fea0] 2837207091 ms: Scavenge 487.6 (516.1) -> 486.1 (514.9) MB, 4.9 / 0.0 ms  (average mu = 0.297, current mu = 0.342) allocation failure
<30>Aug  3 18:05:03 10.20.1.26 PandoraProd-api-ad[3475]: [24:0x55988238fea0] 2837207786 ms: Mark-sweep 488.1 (516.9) -> 486.4 (515.2) MB, 667.7 / 0.0 ms  (average mu = 0.204, current mu = 0.098) allocation failure scavenge might not succeed
<30>Aug  3 18:05:03 10.20.1.26 PandoraProd-api-ad[3475]:
<30>Aug  3 18:05:03 10.20.1.26 PandoraProd-api-ad[3475]:
<30>Aug  3 18:05:03 10.20.1.26 PandoraProd-api-ad[3475]: <--- JS stacktrace --->
<30>Aug  3 18:05:03 10.20.1.26 PandoraProd-api-ad[3475]:
<30>Aug  3 18:05:03 10.20.1.26 PandoraProd-api-ad[3475]: ==== JS stack trace =========================================
<30>Aug  3 18:05:03 10.20.1.26 PandoraProd-api-ad[3475]:
<27>Aug  3 18:05:03 10.20.1.26 PandoraProd-api-ad[3475]: FATAL ERROR: Ineffective mark-compacts near heap limit Allocation failed - JavaScript heap out of memory
<30>Aug  3 18:05:03 10.20.1.26 PandoraProd-api-ad[3475]:     0: ExitFrame [pc: 0x55988058bb79]
<30>Aug  3 18:05:03 10.20.1.26 PandoraProd-api-ad[3475]: Security context: 0x1f135a080911 <JSObject>
<30>Aug  3 18:05:03 10.20.1.26 PandoraProd-api-ad[3475]:     1: /* anonymous */(aka /* anonymous */) [0x3874b0c09f89] [/app/node_modules/mongodb/lib/core/topologies/replset.js:~512] [pc=0x74d3fc6cfcf](this=0x251d2bb804d1 <undefined>,0x251d2bb801d9 <null>)
<30>Aug  3 18:05:03 10.20.1.26 PandoraProd-api-ad[3475]:     2: /* anonymous */(aka /* anonymous */) [0x3874b0c0a029] [/app/node_modules/mongodb/lib/core/topologies/replset.js:~411] [pc=0x74d3fc696f7](this=0x251d2bb804...
<30>Aug  3 18:05:03 10.20.1.26 PandoraProd-api-ad[3475]:
 yanqi321
on 5 Aug 2020
yanqi321
on 5 Aug 2020
Related issues
 efkan
·
3Comments
efkan
·
3Comments
 gustavomanolo
·
3Comments
gustavomanolo
·
3Comments
 adamreisnz
·
3Comments
adamreisnz
·
3Comments
 jeneser
·
3Comments
jeneser
·
3Comments
 rohan-paul
·
3Comments
rohan-paul
·
3Comments