Moleculer: Memory usage keeps increasing
We have a service that It's memory utilization keeps raising even when it pretty much doesn't do anything. Eventually the usage is so high what makes the service to crash.
I created a minimized service that all it does is creates a ServiceBroker and activates another "suspicious" module.
I created the service with the following parameters:
logLevel: 'debug',
logger: myLogger,
transit: {
              disableReconnect: true
            },
transporter: {
    type: 'MQTT',
    options: {
      username: 'admin',
      password: 'admin!',
      servers: [
        {
          host: 'localhost',
          port: 1883
        }
      ]
    }
  }
After a few hours I could tell that the memory issue still occurs although nothing is done by the service and the only thing written to the logs are the HEARTBEAT messages.
Then, I removed the part that creates the ServiceBroker and run the service again.
Now the memory usage is much more steady.
Any thoughts on what can cause it?
 Gadi-Manor
All 7 comments
Please check it with another transporter (e.g. NATS) and without disableReconnect. I think one of them will cause it.
 icebob
on 6 Dec 2018
icebob
on 6 Dec 2018
Another important thing: what are you using in myLogger?
 tinchoz49
on 6 Dec 2018
tinchoz49
on 6 Dec 2018
Another important thing: what are you using in myLogger?
Please check it with another transporter (e.g. NATS) and without disableReconnect. I think one of them will cause it.
I'm currently running the service with TCP transporter* and I will update on the result. In the meanwhile I looked in mqtt.js and saw there is an open issue about memory leak so maybe that's the problem.
- I know it's not ready for production, it just faster for me to test it then
NATS.
Gadi-Manor
on 6 Dec 2018
Hi @Gadi-Manor, Winston is really good. I asked you about the logger because maybe you have some winston transport leaking memory.
tinchoz49
on 7 Dec 2018
I tried different transporters (NATS and TCP), I also removed the logger parameter so no logs are showing at all but in all cases I'm still getting a constant climb in memory usage. Any other thoughts you think I should try?
Gadi-Manor
on 11 Dec 2018
Found it!
TL:DR - The memory leak wasn't in Moleculer.
The scenario:
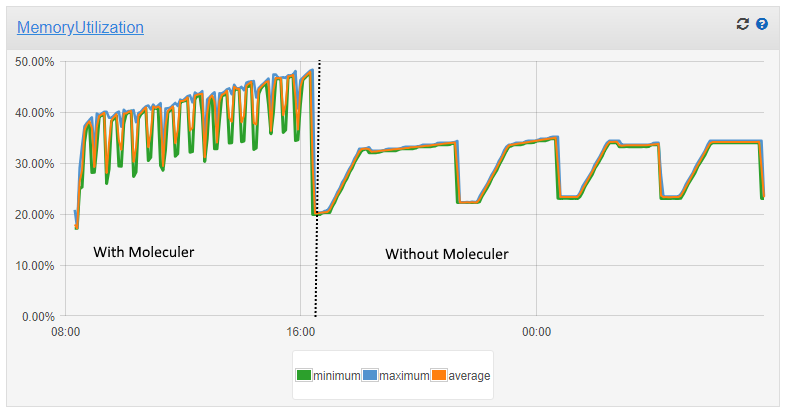
As I said before, I created a very simple service containing Moleculer and another module and played with the configuration, e.g. used both of them or only one to see how it affects the memory utilization.
What I've found was when Moleculer was used there was a memory leak and when it wasn't used there wasn't, so It's gotta be Moleculer right?
Well, it doesn't. It turns out that this other module used this while on debug mode (which by accident it was). I didn't go very deep into the code but from what I understand it keep trace of the application and since while I was using Moleculer there was much more stuff going on than when I wasn't the memory leak was more obvious.
Sorry for wasting your time :)
Gadi-Manor
on 11 Dec 2018
Thanks for sharing what you found it! :+1:
tinchoz49
on 11 Dec 2018
Related issues
 abdavid
·
4Comments
abdavid
·
4Comments
 dylanwulf
·
4Comments
dylanwulf
·
4Comments
 Kamil93
·
3Comments
Kamil93
·
3Comments
 SushKenyNeosoft
·
3Comments
icebob
·
3Comments
SushKenyNeosoft
·
3Comments
icebob
·
3Comments
Most helpful comment
Found it!
TL:DR - The memory leak wasn't in
Moleculer.The scenario:
As I said before, I created a very simple service containing
Moleculerand another module and played with the configuration, e.g. used both of them or only one to see how it affects the memory utilization.What I've found was when
Moleculerwas used there was a memory leak and when it wasn't used there wasn't, so It's gotta beMoleculerright?Well, it doesn't. It turns out that this other module used this while on
debugmode (which by accident it was). I didn't go very deep into the code but from what I understand it keep trace of the application and since while I was usingMoleculerthere was much more stuff going on than when I wasn't the memory leak was more obvious.Sorry for wasting your time :)