Models: Only a dot on evaluvation graphs
Hi
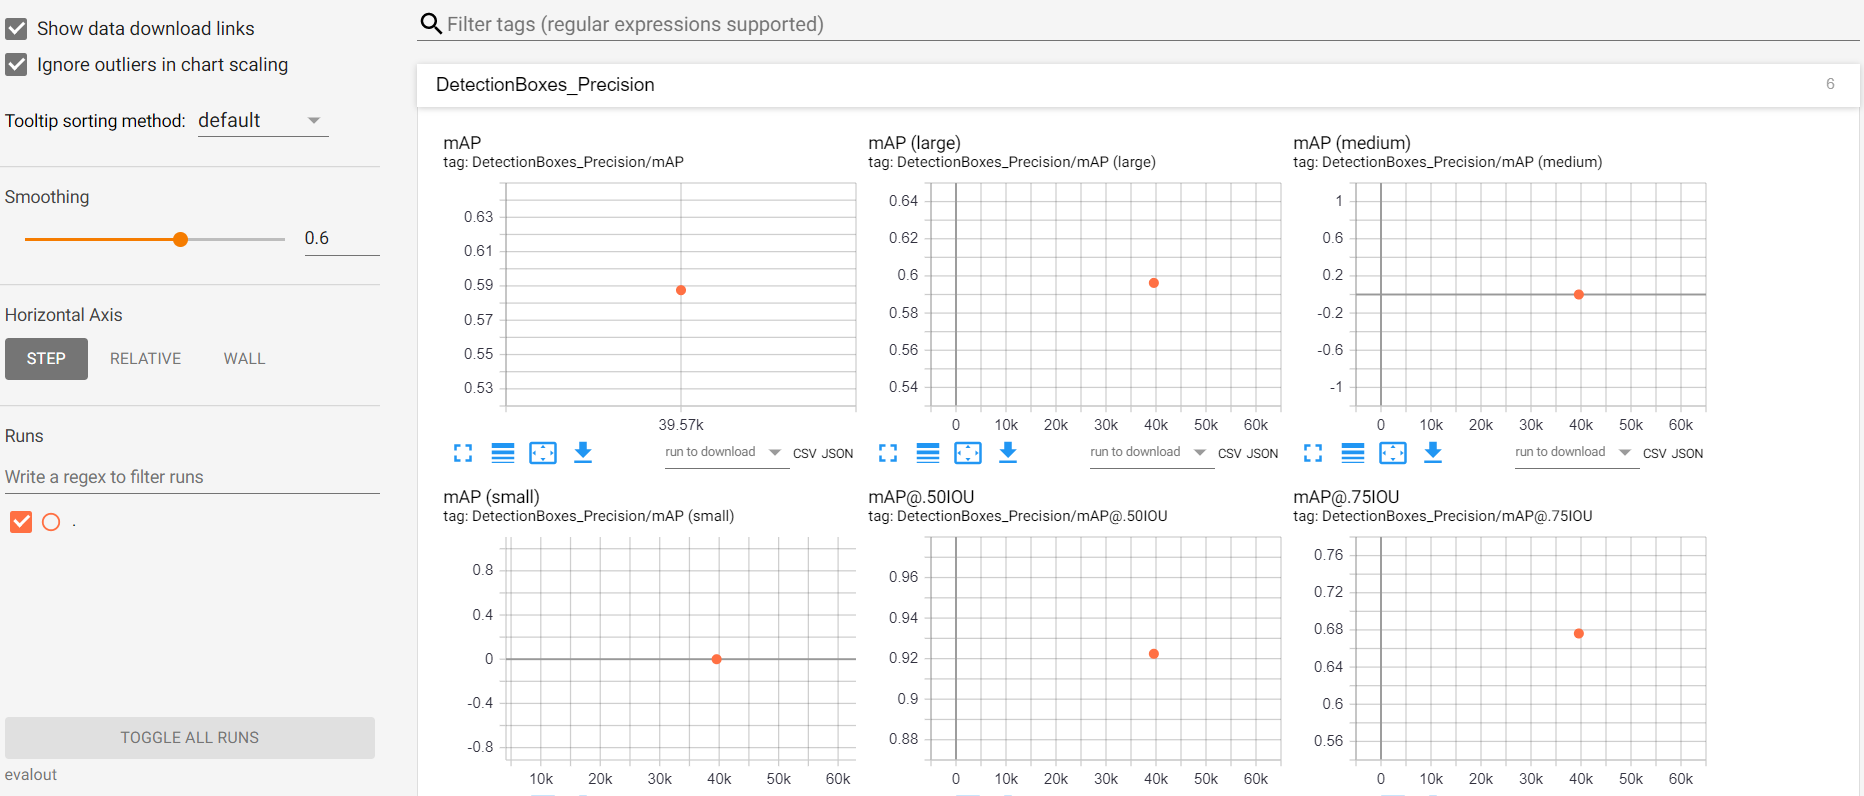
I am testing about 800 images on Faster RCNN model using my own data set. When I am running eval.py it only shows dot in the middle of each graph on Tensor board rather than a complete graph. Please guide. Does anyone know how to solve it? thanks.
 shahansha-c
All 8 comments
If you only evaluate once, it will just show one dot. The x-axis is the global step. As it is an eval job, it reads the checkpoint and restores the global step, which happens to be 40K?
I am not familiar with OD API though.
 saberkun
on 21 Mar 2020
saberkun
on 21 Mar 2020
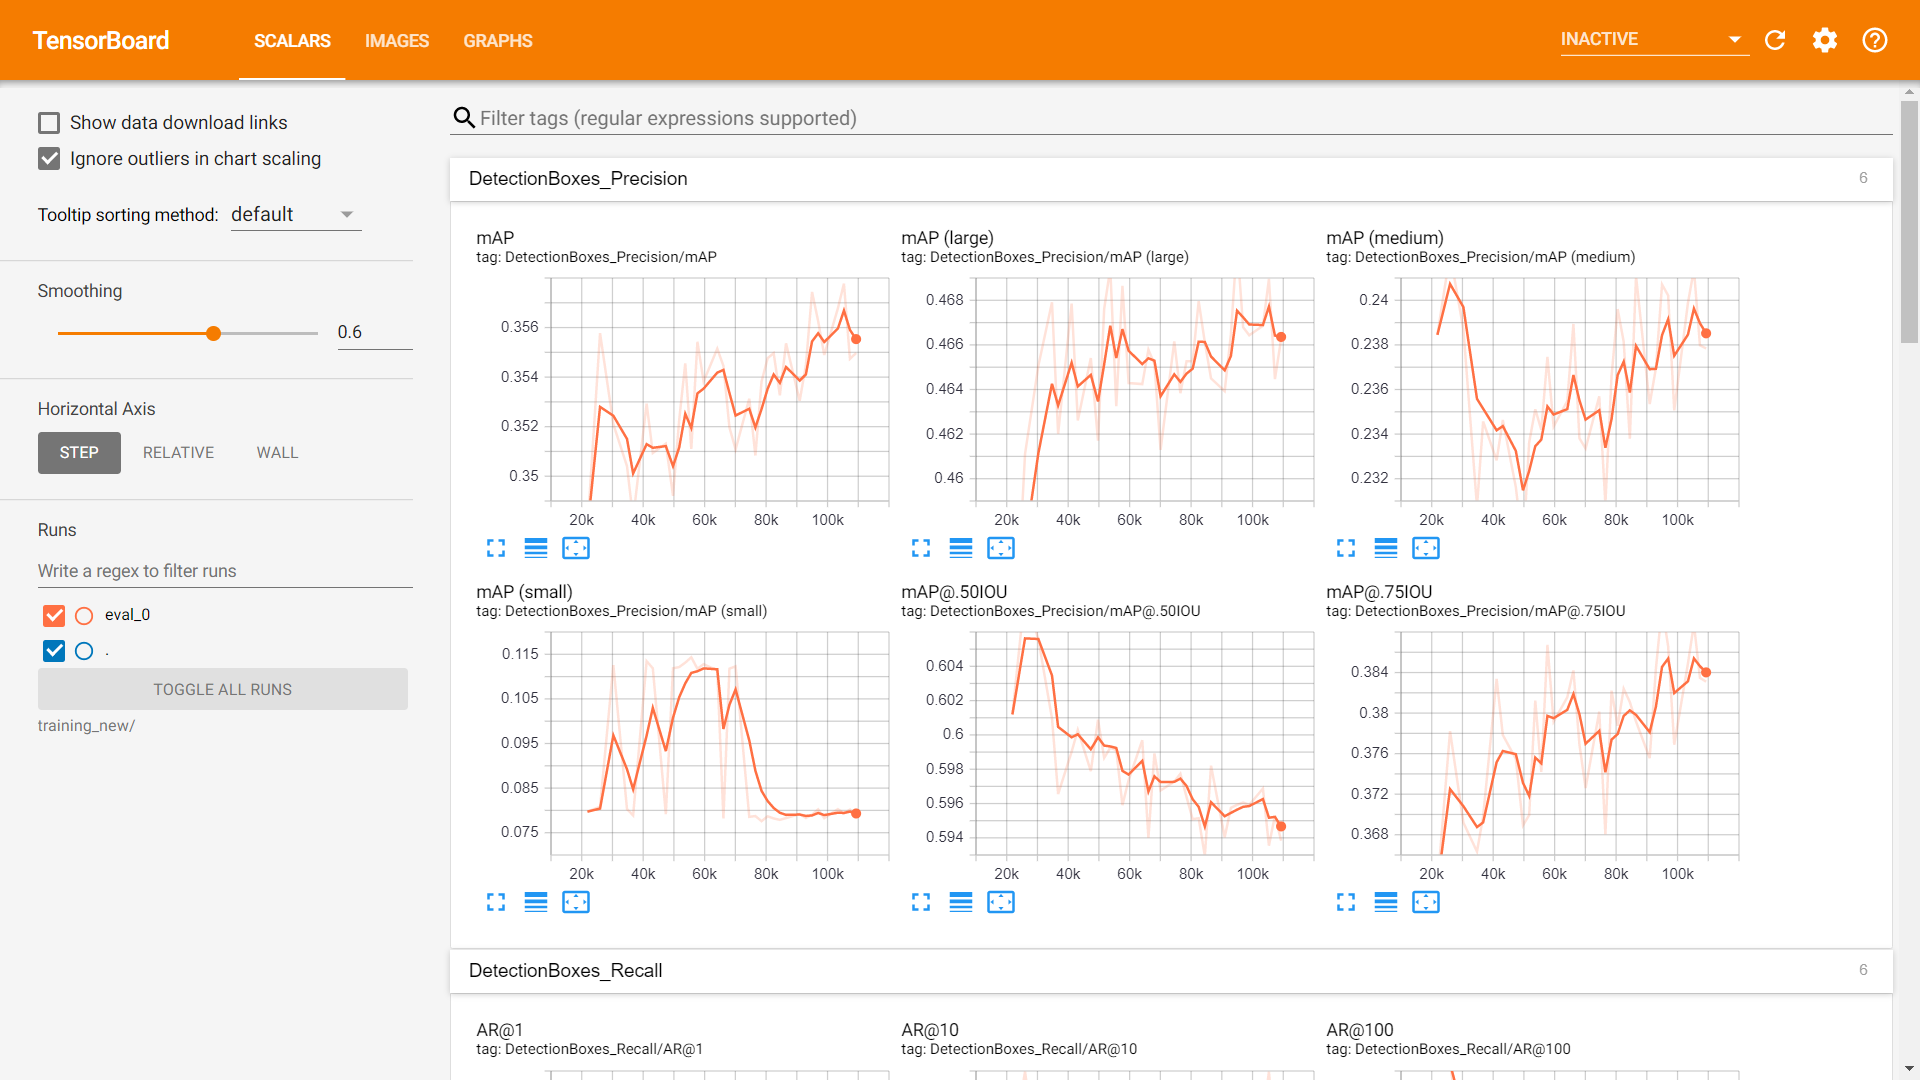
@saberkun is right. If you want a curve, leave the eval.py running. It will look for new checkpoints in the folder every 300 seconds or so. eval.py is usually run along with the training process, to evaluate the required metrics at different intervals. I think that is what you want.
Alternatively, you could use model_main.py to train the model, which alternates between training and evaluating the model. This way, you won't have to run the train and eval processes separately. Below are graphs I got from using model_main.py:
 divyanshusharma1709
on 25 Mar 2020
divyanshusharma1709
on 25 Mar 2020
@divyanshusharma1709
So to get a complete graph should i restart my training once again from start?? and need run the script eval simultaneously??
my training process in completed. is there any way to get the complete graph without restarting the training? Thanks
shahansha-c
on 25 Mar 2020
Yes, you will have to retrain the model if you want the validation loss curve. If you didn't check the validation curve during training, I would also suggest you to check for overfitting.
Also, if you can, use the newer model_main.py for training. This will save you the trouble of dividing your GPU between training and validation.
To switch, instead of python train.py --logtostderr --train_dir=<path> --pipeline_config_path=<path>,
Use python model_main.py --pipeline_config_path=<path_to_pipeline_config> --model_dir=<path_where_to_store_model_checkpoints_and_Logs> --alsologtostderr
divyanshusharma1709
on 25 Mar 2020
@divyanshusharma1709
OK thanks very much for your reply. Actually tried the model_main.py script
and i got the complete graph.
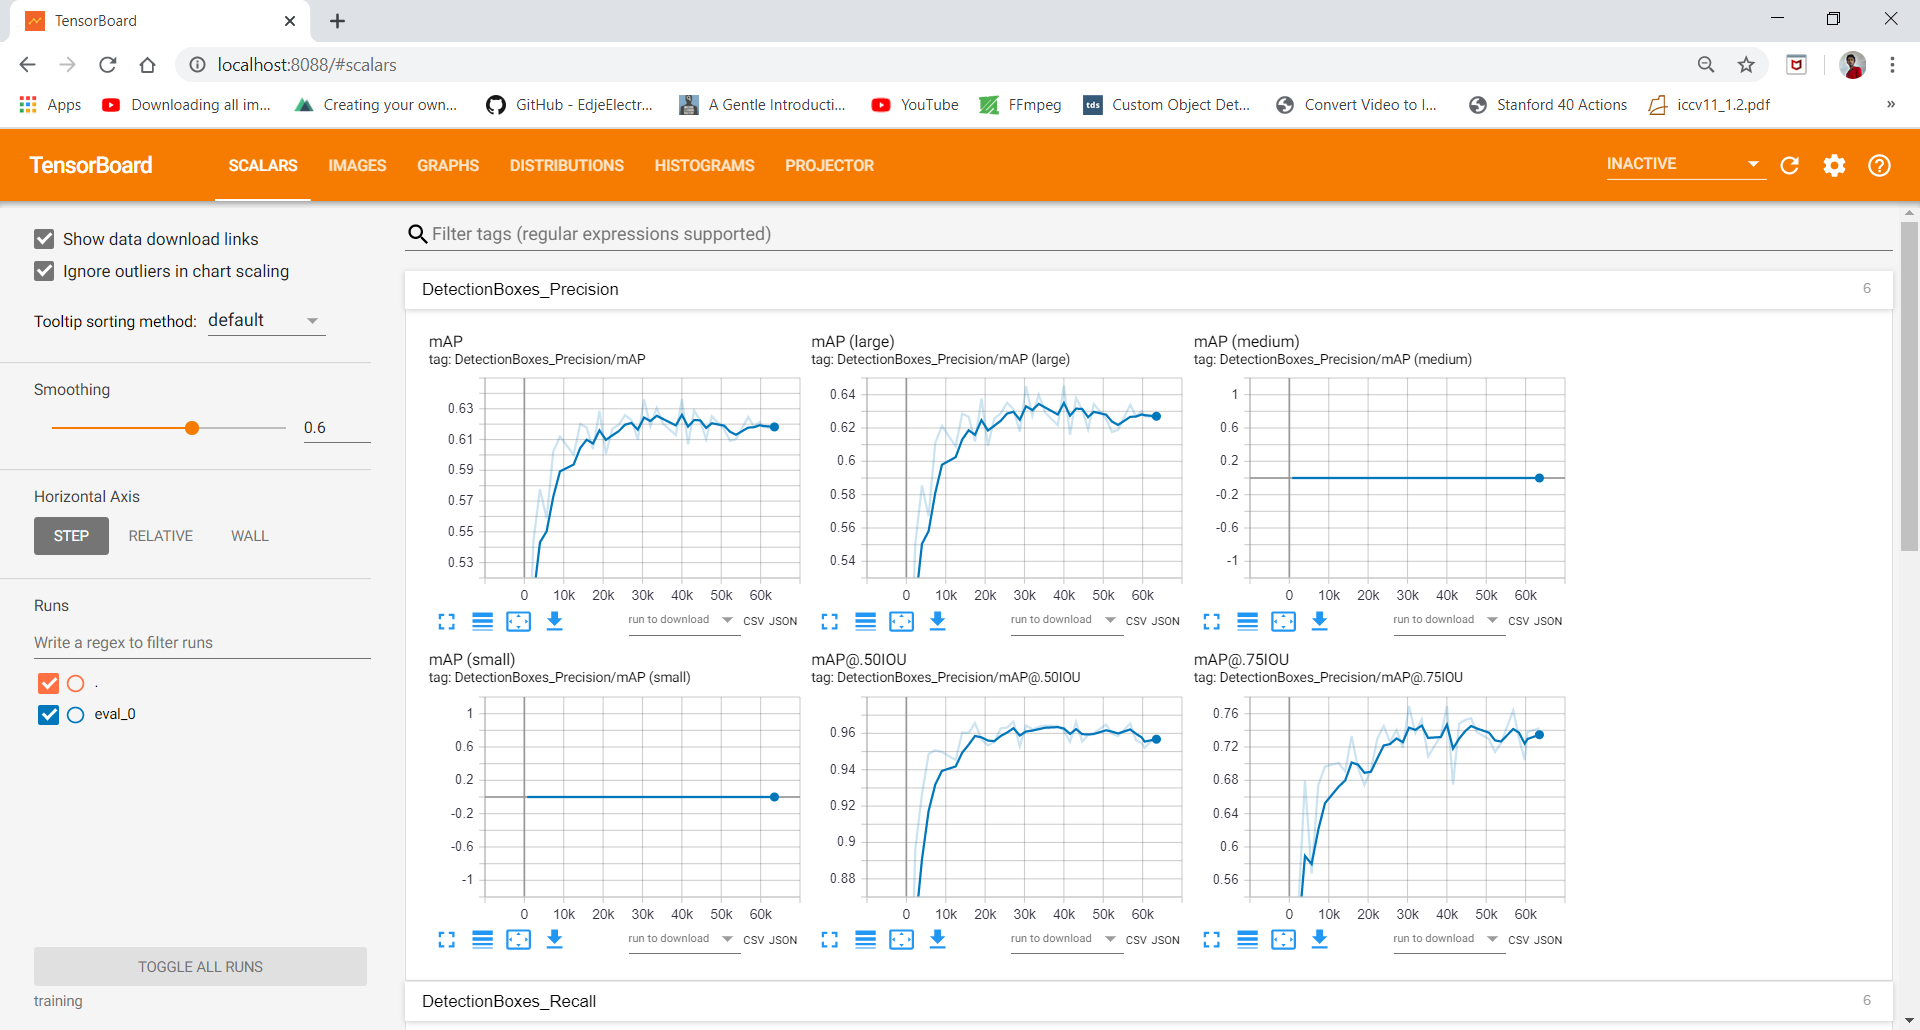
i posted this question to know that is there any way to get the complete graph without training.
i have one more doubt. For better analysis, I want to know the exact breakdown of my model's results into false positives, false negatives and true positives. I wish to be able to see this breakdown in terms of actual test images - that is, I want to see the total number of false positives, false negatives and true positives
How can I do that? Thanks in advance
shahansha-c
on 25 Mar 2020
If you have the entire set of checkpoints, you can write code with a for loop to read through them and evaluate. However, most frameworks will do garbage collection on old checkpoints, so they do not keep all checkpoints.
To see detailed false positives, false negatives and true positives, you would better dive into the eval code to add code to store these information or fine metrics that do these works. It would be a bit hard to TF 1.x style code base.
saberkun
on 26 Mar 2020
I recommend looking at object_detection/utils/object_detection_evaluation.py to pull out false negatives/ false positives etc.
 tombstone
on 28 May 2020
tombstone
on 28 May 2020
Closing this as the issue seems to be resolved!
 kyscg
on 19 Jun 2020
kyscg
on 19 Jun 2020
Related issues
 dsindex
·
3Comments
dsindex
·
3Comments
 rakashi
·
3Comments
rakashi
·
3Comments
 frankkloster
·
3Comments
frankkloster
·
3Comments
 trungdn
·
3Comments
trungdn
·
3Comments
 Mostafaghelich
·
3Comments
Mostafaghelich
·
3Comments