Models: Slow inference speed of object detection models and a hack as solution
System information
- What is the top-level directory of the model you are using:
models/research/object_detection/ - Have I written custom code:
No custom code for reproducing the bug. I have written custom code for diagnosing. - OS Platform and Distribution:
Linux Ubuntu 16.04 - TensorFlow installed from (source or binary):
Anaconda conda-forge channel - TensorFlow version:
b'unknown' 1.4.1 (output frompython -c "import tensorflow as tf; print(tf.GIT_VERSION, tf.VERSION)") - CUDA/cuDNN version:
CUDA 8.0/cuDNN 6.0 - GPU model and memory:
1 TITAN X (Pascal) 12189MiB - Exact command to reproduce:
Run the provided object detection demo (ssd_mobilenet_v1_coco_2017_11_17 model) with a small modification in the last cell to record the inference speed:
    i = 0
    for _ in range(10):
      image_path = TEST_IMAGE_PATHS[1]
      i += 1
      image = Image.open(image_path)
      # the array based representation of the image will be used later in order to prepare the
      # result image with boxes and labels on it.
      image_np = load_image_into_numpy_array(image)
      # Expand dimensions since the model expects images to have shape: [1, None, None, 3]
      image_np_expanded = np.expand_dims(image_np, axis=0)
      # Actual detection.
      options = tf.RunOptions(trace_level=tf.RunOptions.FULL_TRACE)
      run_metadata = tf.RunMetadata()
      start_time = time.time()
      (boxes, scores, classes, num) = sess.run(
          [detection_boxes, detection_scores, detection_classes, num_detections],
          feed_dict={image_tensor: image_np_expanded})
      print('Iteration %d: %.3f sec'%(i, time.time()-start_time))
The results show that the inference speed is much shower than the reported inference speed, 30ms, in the model zoo page:
Iteration 1: 2.212 sec
Iteration 2: 0.069 sec
Iteration 3: 0.076 sec
Iteration 4: 0.068 sec
Iteration 5: 0.072 sec
Iteration 6: 0.072 sec
Iteration 7: 0.071 sec
Iteration 8: 0.079 sec
Iteration 9: 0.085 sec
Iteration 10: 0.071 sec
Describe the problem
Summary:
By directly running the provided object detection demo, the observed inference speed of object detection models in the model zoo is much slower than the reported inference speed. With some hack, a higher inference speed than the reported speed can be achieved. After some diagnostics, it is highly likely that the slow inference speed is caused by:
- tf.where and other post-processing operations are running anomaly slow on GPU; or
- The frozen inference graph is lack of the ability to optimize the GPU/CPU assignment.
proof of the hypothesis: tf.where and other post-processing operations are running anomaly slow on GPU
By outputting trace file, we can diagnose the running time of each node in details.
To output the trace file, modify the last cell of object detection demo as:
from tensorflow.python.client import timeline
with detection_graph.as_default():
  with tf.Session(graph=detection_graph) as sess:
    # Definite input and output Tensors for detection_graph
    image_tensor = detection_graph.get_tensor_by_name('image_tensor:0')
    # Each box represents a part of the image where a particular object was detected.
    detection_boxes = detection_graph.get_tensor_by_name('detection_boxes:0')
    # Each score represent how level of confidence for each of the objects.
    # Score is shown on the result image, together with the class label.
    detection_scores = detection_graph.get_tensor_by_name('detection_scores:0')
    detection_classes = detection_graph.get_tensor_by_name('detection_classes:0')
    num_detections = detection_graph.get_tensor_by_name('num_detections:0')
    i = 0
    for _ in range(10):
      image_path = TEST_IMAGE_PATHS[1]
      i += 1
      image = Image.open(image_path)
      # the array based representation of the image will be used later in order to prepare the
      # result image with boxes and labels on it.
      image_np = load_image_into_numpy_array(image)
      # Expand dimensions since the model expects images to have shape: [1, None, None, 3]
      image_np_expanded = np.expand_dims(image_np, axis=0)
      # Actual detection.
      options = tf.RunOptions(trace_level=tf.RunOptions.FULL_TRACE)
      run_metadata = tf.RunMetadata()
      start_time = time.time()
      (boxes, scores, classes, num) = sess.run(\
      [detection_boxes, detection_scores, detection_classes, num_detections], \
      feed_dict={image_tensor: image_np_expanded}, \
      options=options, run_metadata=run_metadata)
      print('Iteration %d: %.3f sec'%(i, time.time()-start_time))
      # Visualization of the results of a detection.
      vis_util.visualize_boxes_and_labels_on_image_array(
        image_np,
        np.squeeze(boxes),
        np.squeeze(classes).astype(np.int32),
        np.squeeze(scores),
        category_index,
        use_normalized_coordinates=True,
        line_thickness=8)

    plt.figure(figsize=IMAGE_SIZE)
    plt.imshow(image_np)

    fetched_timeline = timeline.Timeline(run_metadata.step_stats)
    chrome_trace = fetched_timeline.generate_chrome_trace_format()
    with open('Experiment_1.json' , 'w') as f:
      f.write(chrome_trace)
The output json file has been included in the .zip file in the source code section below.
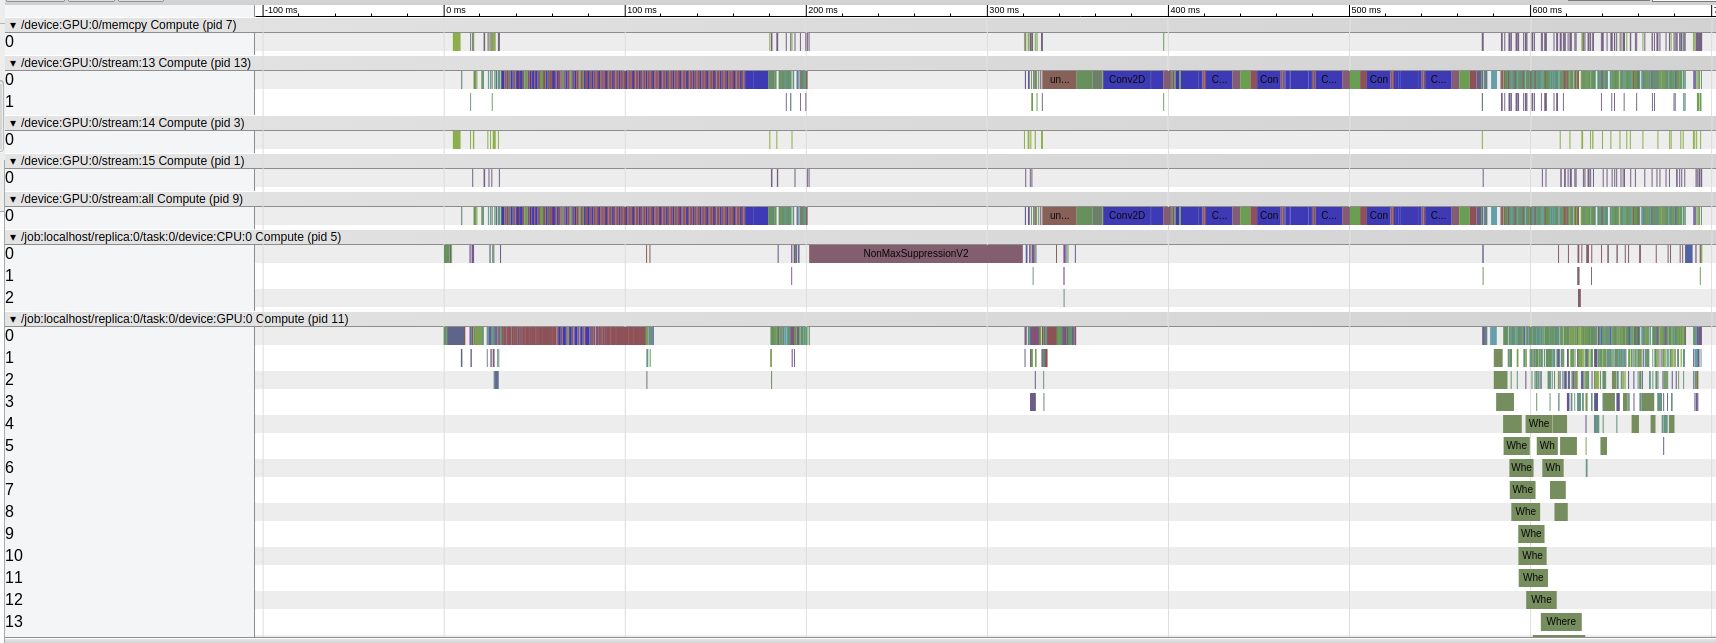
Visualizing the json file in chrome://tracing/ gives:
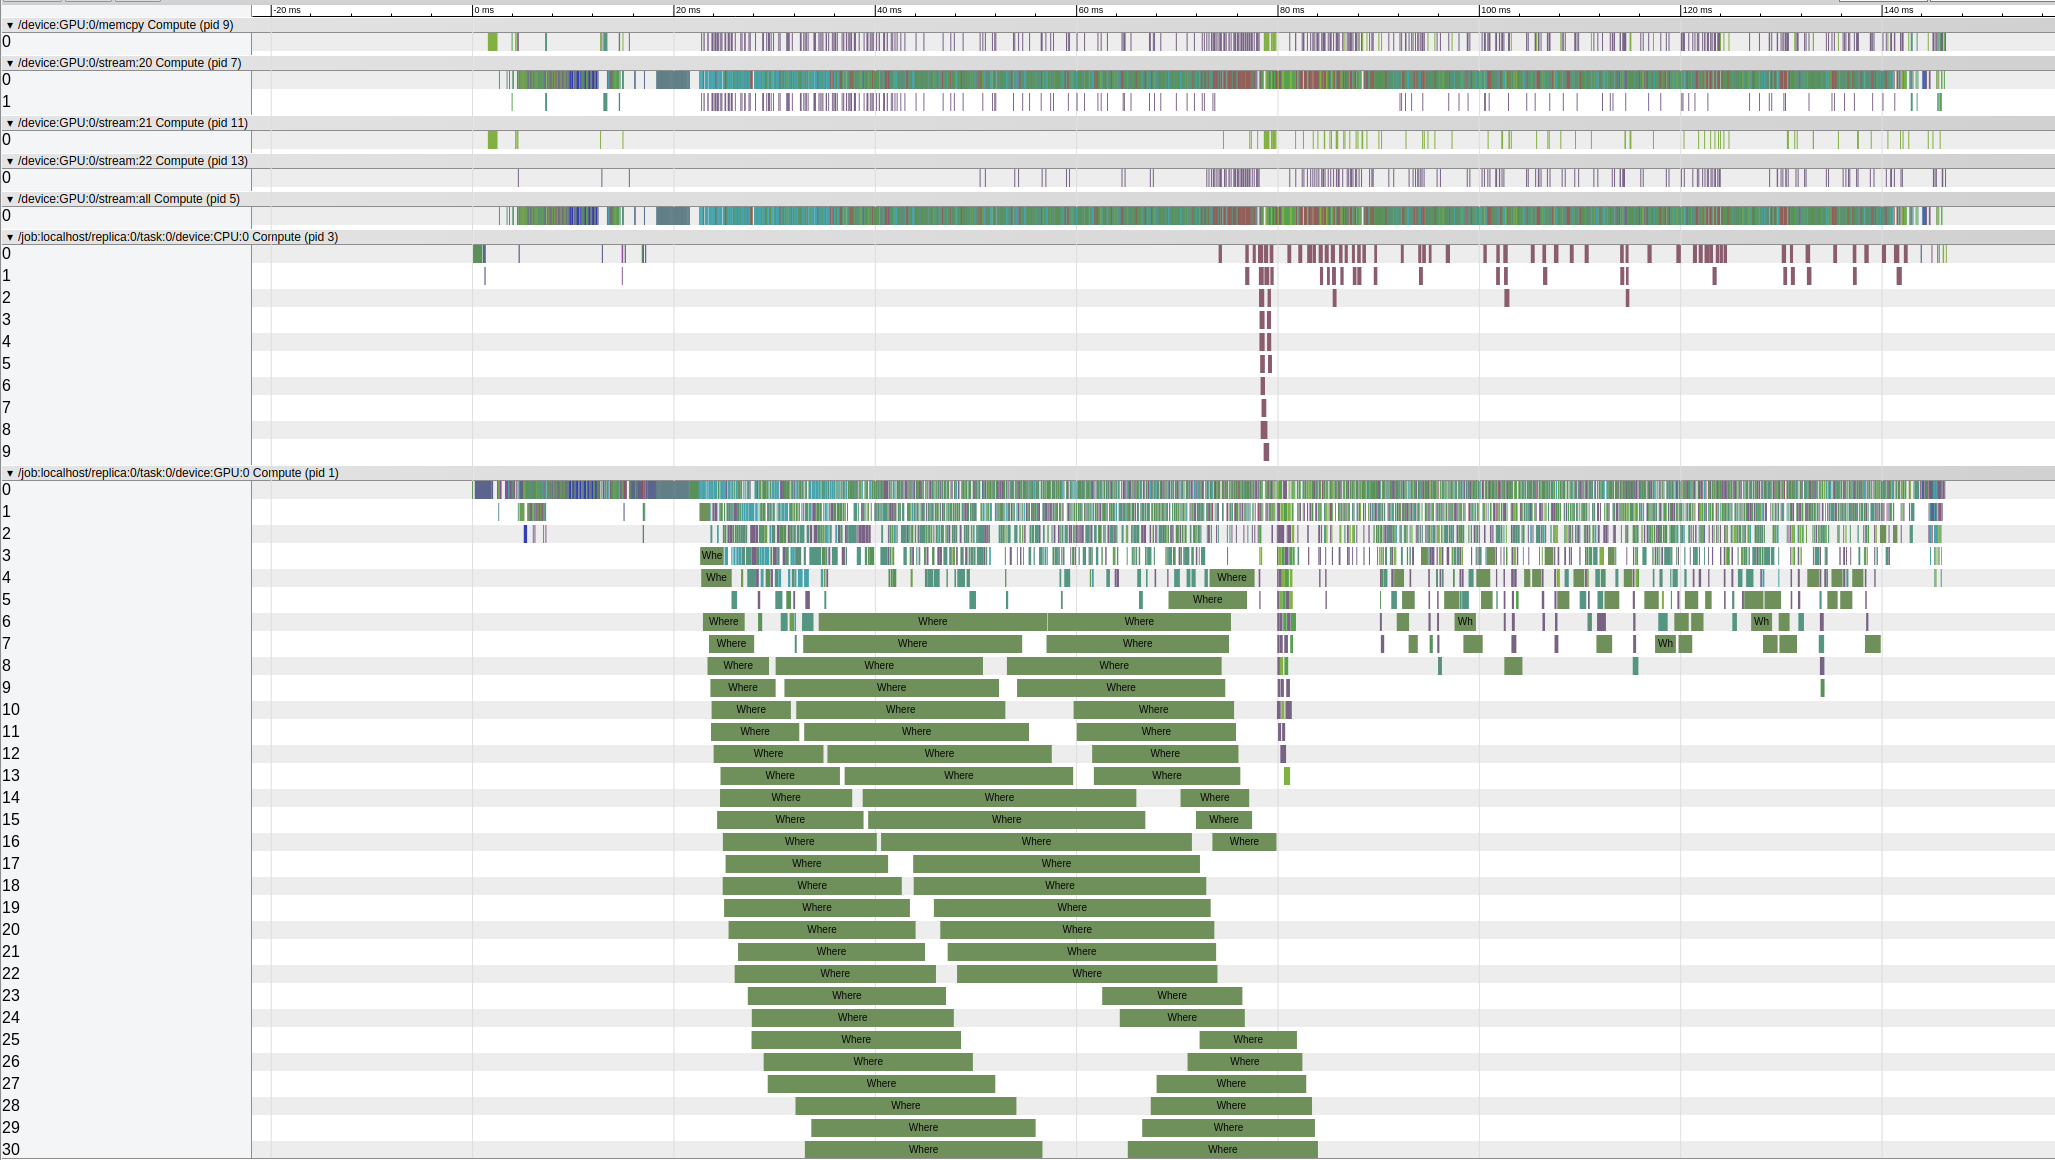
The CNN related operations end at ~13ms and the rest post-processing operations take about 133ms. We have noticed that adding the trace function will further slow down the inference speed. But it is shows clearly that the post-processing operations (post CNN) run very slowly on GPU.
As a comparison, one can run the object detection demo with GPU disabled, and profile the running trace using the same method. To disable GPU, add os.environ['CUDA_VISIBLE_DEVICES'] = '' in the first row of the last cell.
The output json file has been included in the .zip file in the source code section below.
Visualizing this json file in chrome://tracing/ gives:
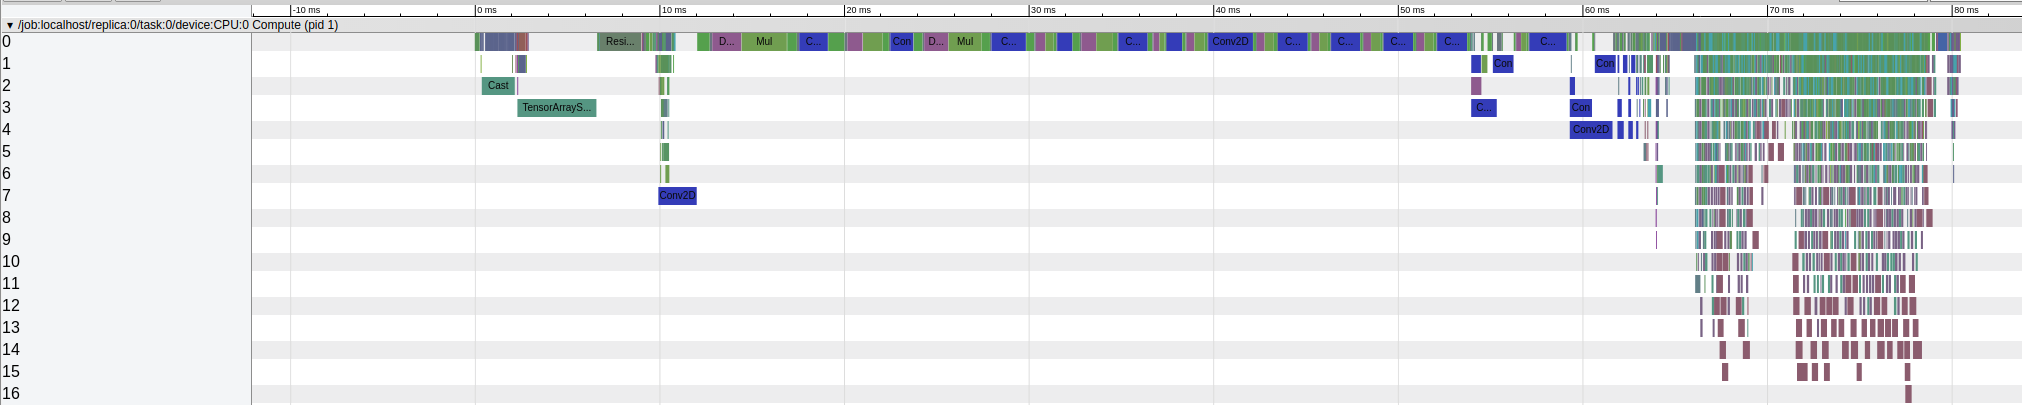
By running everything on CPU, the CNN operations end at roughly 63ms and the rest post-processing operations only takes about 15ms on CPU which is significantly faster than the time they take when running on GPU.
proof of the hypothesis: The frozen inference graph is lack of the ability to optimized the GPU/CPU assignment
We add some hack trying to see can we achieve a higher inference speed. The hack is manually assigning the CNN related nodes on GPU and the rest nodes on CPU. The idea is using GPU to accelerate only CNN operations and leave the post-processing operations on CPU.
The source code has been included in the .zip file in the source code section below.
With this hack, we are able to observe a higher inference speed than the reported speed.
Iteration 1: 1.021 sec
Iteration 2: 0.027 sec
Iteration 3: 0.026 sec
Iteration 4: 0.027 sec
Iteration 5: 0.026 sec
Iteration 6: 0.026 sec
Iteration 7: 0.026 sec
Iteration 8: 0.031 sec
Iteration 9: 0.031 sec
Iteration 10: 0.026 sec
To verify the hypothesis, here are some questions we need from the tensorflow team:
Are the numbers of inference speed reported on the detection model zoo page tested on the frozen inference graphs or original graphs?
Are the slow tf.where and other post-processing operations supposed to run on GPU or CPU? Is the slow running speed on GPU normal?
Is there a device assigning function to optimize the GPU/CPU use in the original tensorflow graphs? Is that function missing in the frozen inference graphs?
Source code / logs
 wkelongws
All 78 comments
Would something similar work with faster-rcnn meta architecture and it's SecondStagePostprocessing?
 nguyeho7
on 30 Jan 2018
nguyeho7
on 30 Jan 2018
Nice work!
@derekjchow is that something we could integrate in a general way?
CC @benoitsteiner (for placement) @ebrevdo
 drpngx
on 31 Jan 2018
drpngx
on 31 Jan 2018
Thank you for the detailed analysis! Looking deeper into the code, it seems we clear devices when freezing the graph for portability reasons. See this file.
 derekjchow
on 31 Jan 2018
derekjchow
on 31 Jan 2018
In that case, would you explain what is needed to recover the original device placement config for those frozen models currently listed in the Object Detection Model Zoo?
@wkelongws showed a hack to manually assign the nodes to GPU and CPU regained the advertised performance, but that requires careful inspection of each model network, so that is not really scalable.
 tokk-nv
on 31 Jan 2018
tokk-nv
on 31 Jan 2018
@nguyeho7 I haven't tried the trick on faster-rcnn architecture but I believe it will perform in a similar way. The point is the graph nodes have to be assigned to GPU or CPU accordingly to achieve the reported inference speed. The trick here is not the optimal way to assign the nodes as @tokk-nv mentioned above. Apparently the device tags are initially there and then removed in these frozen graphs. So these released frozen graphs cannot achieve the reported inference speed.
@derekjchow Since the frozen graphs cannot achieve the reported inference speed due to the lack of optimal device assignment, I think the tensorflow team should provide:
- A description of inference speed issue somewhere in the object detection API documentation;
- A version of frozen graphs with device tags for best inference speed on GPU
- Or, a way to recover the original device placement config for those frozen models currently listed in the Object Detection Model Zoo.
wkelongws
on 2 Feb 2018
@wkelongws thanks for this work! I am struggling to speed up SSD with the api since a while (https://github.com/tensorflow/models/issues/3136). This could be the reason.
Can you tell me how to apply your hack?
Which code modifications have to be done to achieve the correct GPU/CPU addressing?
 gustavz
on 5 Feb 2018
gustavz
on 5 Feb 2018
@GustavZ The source code (a jupyter notebook file) to apply the hack is in the attached .zip file. The hack is basically manually find a cut-off point to split the graph into two halves, assign the first half to GPU and the second half to CPU. The cut-off point I used here is manually decided and will vary for other graphs.
In your thread you mentioned optimize_for_inference.py, do you have any success in using it yet? I haven't tried it yet and will do later.
Apparently tensorflow team has the optimized GPU/CPU addressing before freezing the graphs, and the reported speed can be achieve only if we can restore that addressing.
wkelongws
on 5 Feb 2018
For the hack, it's a little more complicated to find a cutoff point with faster rcnn as the tensors are very interconnected. Notably the non maximum suppression is called twice, once after the first stage and once in the second stage post processing. I tried to use Squeeze_3 and Squeeze_2 which are the outputs of the second stage box proposals but there is always a missing tensor (i.e. wrong cut) somewhere.
nguyeho7
on 6 Feb 2018
@wkelongws, no i did not have success with it, it seems that optimize_for_inference is not supported any more. It is said to use the graph transform tool instead, but i haven't used it yet
https://www.tensorflow.org/mobile/prepare_models
gustavz
on 6 Feb 2018
@nguyeho7 You are correct. The hack is just as a demo here. It is not scalable. For the complicated model structures such as faster_rcnn we need to find a way to restore the device placement. I guess re-exporting the frozen graph from check point might do the work:
- Change line 389 to
clear_devices=False(as mentioned above by @derekjchow ) - and reexport frozen graph.
Due to some other errors on my machine, I personally haven't tried this method. But @tokk-nv tried and confirmed still the device placement is missing after reexporting from provided check point.
I guess we still need tensorflow team @derekjchow to provide a way of restoring the device placement.
wkelongws
on 6 Feb 2018
@wkelongws
If you look at line 371 which is run before line 389. It calls the function _write_graph_and_checkpoint() which deletes all devices in the graph def as well. However, printing the device name there yields mostly empty strings so I'm not sure they are even in the checkpoint. But yeah, at this point this is just hacking away at tensorflow and a proper device placement would be preferable.
nguyeho7
on 7 Feb 2018
@wkelongws @nguyeho7 I've tried removing the clear_devices bits from the exporter, but I don't see any change in speed. We'll need more time to look at this issue a bit closer.
derekjchow
on 7 Feb 2018
Would loading the checkpoint directly instead of the frozen graph help?
nguyeho7
on 7 Feb 2018
I encounter similar issue with SSD model. What's more confusing is that profiler reports that almost all of time spent in tf.where is actually on CPU, event though device placement log shows that the op is placed on GPU.
evaluator.py:61:_extract_predicti... (0us/27.04ms, 0us/897us, 0us/25.98ms)
            ssd_meta_arch.py:443:postprocess (0us/26.23ms, 0us/588us, 0us/25.50ms)
              post_processing.py:375:batch_multiclass_... (0us/26.23ms, 0us/588us, 0us/25.50ms)
                functional_ops.py:389:map_fn (0us/25.95ms, 0us/523us, 0us/25.28ms)
                  control_flow_ops.py:2816:while_loop (0us/25.95ms, 0us/523us, 0us/25.28ms)
                    control_flow_ops.py:2640:BuildLoop (0us/25.95ms, 0us/523us, 0us/25.28ms)
                      control_flow_ops.py:2590:_BuildLoop (0us/25.89ms, 0us/523us, 0us/25.22ms)
                        functional_ops.py:379:compute (0us/25.84ms, 0us/523us, 0us/25.17ms)
                          post_processing.py:351:_single_image_nms... (0us/25.38ms, 0us/519us, 0us/24.72ms)
                            post_processing.py:135:multiclass_non_ma... (0us/12.20ms, 0us/86us, 0us/12.10ms)
                              box_list_ops.py:686:filter_greater_than (0us/11.13ms, 0us/62us, 0us/11.06ms)
                                array_ops.py:2439:where (0us/10.49ms, 0us/0us, 0us/10.49ms)
                                  gen_array_ops.py:5930:where (0us/10.49ms, 0us/0us, 0us/10.49ms)
                                    op_def_library.py:787:_apply_op_helper (0us/10.49ms, 0us/0us, 0us/10.49ms)
                                      ops.py:2956:create_op (0us/10.49ms, 0us/0us, 0us/10.49ms)
                                        ops.py:1470:__init__ (10.49ms/10.49ms, 0us/0us, 10.49ms/10.49ms)
 mrfortynine
on 9 Feb 2018
mrfortynine
on 9 Feb 2018
Would loading the checkpoint directly instead of the frozen graph help?
@nguyeho7 I'm seeing this on checkpoint as well as frozen graph.
mrfortynine
on 9 Feb 2018
I am having similarly bad performance.
On my Macbook Pro in Tensorflow CPU model I get:
Inference time 0.13113617897033691 sec
On an AWS px2.large K80 GPU instance im getting:
Inference time 0.08756685256958008 sec
Tensorflow GPU is installed and says its connected and I see the process in the nvidia-smi tool.
Anyone have an idea why inference is so slow on GPU?
Is it simply not possible to do it faster? Thats like 12 fps on a K80...
Anyone have any ideas whats going on?
 madhavajay
on 18 Feb 2018
madhavajay
on 18 Feb 2018
The hack works on the pretrained model from the model zoo but not on finetuned model exported using export_inference_graph.py.
 gariepyalex
on 22 Feb 2018
gariepyalex
on 22 Feb 2018
@gariepyalex is it slower? Or how does it not work?
nguyeho7
on 23 Feb 2018
Why is that speed still faster than my Nvidia K80 on the AWS px2.large?
I suspect its only using the CPU.... but i see the python process being bound to the nvidia-smi tool. Do I need to re-export the graph using the same tensorflow-gpu / device setup that I want to run it on?
madhavajay
on 23 Feb 2018
@nguyeho7 It looks like the model in the model zoo has been generated from an older version of the code (november 17 if you look at the name of the tar.gz file). After running export_inference_graph.py, the graph is now slightly different and I have an error when I load the frozen graph. I try to add another cutoff point without success.
gariepyalex
on 23 Feb 2018
@madhavajay No you don't need to re-export the graph, it should pick the GPU automatically and from your previous message it does look like the speed improved when you added the GPU. There are many other factors (resolution, image loading is very notable, batch sizes) that affect the speed. Also note that their reported times are on an Titan X instead of a k80.
This thread is more about proper device placement and possible improvements from that angle.
nguyeho7
on 23 Feb 2018
What is weird is that if you look in tensorboard at the graph generated when running eval.py, there is no device information either. I propose to directly fix the device to CPU in ssd_meta_arch.py (see my pull request). This way, pre- and post-processing steps are correctly run on CPU in the exported graph.
I tested on a TX2 and I achieve around 18 FPS. Also, there is no more need for the original
hack by @wkelongws that split the graph. Please note that the default behaviour to clear devices is still there, but I added a flag clear_devices that you can set to False.
gariepyalex
on 26 Feb 2018
@nguyeho7 okay but surely the Titan X isnt as fast as the K80?
I understand that its possible that many images could be done in a batch, but if they are from a video source they are only coming in at a certain rate. Does that mean that SSD for inference can't be done faster than 8fps no matter the hardware currently? Is the entire model just too big and slow to execute through?
Thats what im trying to understand in terms of real time inference for say video vs batch inference for static images.
madhavajay
on 27 Feb 2018
@wkelongws sharing a few facts:
- We train models on cluster whose environment is different from a single machine, that's why we clear the device info as it's not useful at all (aka there isn't an optimized device assignment).
- The speed reported in model zoo is the mean time of running inference for hundreds of test images. It's not comparable with running inference for this one single image. We will update the document to make it more clear.
- I do observe the same speed gain by splitting SSD graph into GPU and CPU parts, let me look into that a bit more.
@gariepyalex this meta arch is not only used for a specific machine, so setting device info in meta arch might not be the right choice.
 pkulzc
on 28 Feb 2018
pkulzc
on 28 Feb 2018
@gariepyalex i tried your hack, running export_inference_graph.py was successful and a model got generated but when i do inference i see lot of false detection with big bounding box.. i am using Tensorflow 1.5 and clear_devices=False. U have any idea what could be the problem..
 SANTHAKUMAR91
on 19 Mar 2018
SANTHAKUMAR91
on 19 Mar 2018
@wkelongws your hack worked perfectly fine for all my ssd_mobilenet models.
But now i got a new ssd_mobilenet trained on 600x600 input images and when i try to apply the split_model hack while inference it gives me the following error:
  File "object_detection.py", line 160, in load_frozenmodel
    tf.import_graph_def(remove, name='')
  File "/usr/local/lib/python2.7/dist-packages/tensorflow/python/framework/importer.py", line 398, in import_graph_def
    % (input_name,)))
ValueError: graph_def is invalid at node u'Preprocessor/map/TensorArray_2': Input tensor 'Preprocessor/map/strided_slice:0' not found in graph_def..
so i had a look at the nodes_to_remove_list and nodes_to_keep_list and it seems that the node Preprocessor/map/TensorArray_2 is on top of the remove list and the node Preprocessor/map/strided_slice is also at the beginning of the keep list.
Is this normal? if not, what could have caused this?
gustavz
on 22 Mar 2018
Any updates here?
For your further examination, I want to note that the current version of the demo is somewhat broken, as it starts a new session for each image and is therefore slow:
https://github.com/tensorflow/models/blob/bf2942715fed7f039b9db43bd15853dc91acf86c/research/object_detection/object_detection_tutorial.ipynb
Compare to the older revision at the time of thread creation:
https://github.com/tensorflow/models/blob/196d173a24613a045e641ef21ba9863c77bd1e2f/research/object_detection/object_detection_tutorial.ipynb
@pkulzc is it possible to fix this?
 KDMueller
on 11 Apr 2018
KDMueller
on 11 Apr 2018
@Klamue The colab is for demo purpose and that's why we're using "run_inference_for_single_image".
For regular use you should run batch inference as eval.py do.
I benchmarked our models with a python binary instead of colab on a few internal machines, and was able to reproduce the reported speed (~30ms) without this hack. After applying this hack the inference time is ~26ms on my machine.
The small gap is likely caused by frequent data transfers between CPU and GPU in post processing. We're considering an optimization for that.
pkulzc
on 11 Apr 2018
Thanks! On Jetson TX2 I get a speedup from ~250ms to ~78ms using the hack, so I consider these optimizations quite relevant.
KDMueller
on 12 Apr 2018
@GustavZ, I had the same issue. I tried to regenerate to frozen graph without fine-tuning or whatsoever and observed the same error.
python object_detection/export_inference_graph.py \
    --input_type image_tensor  \
    --pipeline_config_path object_detection/samples/configs/ssd_mobilenet_v1_coco.config \
    --trained_checkpoint_prefix models/pretrained/ssd_mobilenet_v1_coco_2017_11_17/model.ckpt \
    --output_directory models/pretrained/ssd_mobilenet_v1_coco_2017_11_17/my_export
The code does not work with ssd_mobilenet_v2_coco_2018_03_29. Interestingly, the error is different but also concerns the preprocessing:
ValueError: graph_def is invalid at node 'Preprocessor/map/while/ResizeImage/stack_1': Control input '^Preprocessor/map/while/Identity' not found in graph_def..
_Ubuntu 16.04 / CUDA V9.0.176 / libcudnn 7.0.4.31 / tensorflow-gpu 1.7.0_
 antoinebrl
on 13 Apr 2018
antoinebrl
on 13 Apr 2018
So I've gone thru the solutions everyone has proposed above. The SSD solution proposed by @GustavZ kinda works with between 20-40 FPS but the CPU load is very heavy causing performance to still take the hit (500%) if your using a Tegra processor.
For Faster RCNN models, I tried to train the Low proposals Res 50 model from scatch,since re-exporting a frozen model doesn't work as highlighted by @wkelongws and @tokk-nv above and I tried myself as well. Running a session based on the unexported and re-trained checkpoints didn't make a difference to inference speeds and the chrome trace still registered the huge time gaps caused by tf.where. But there was one difference between using the off the shelf frozen graphs and running my own: The /CPU0 was identified this time in tensorboard with the /GPU0 still being unknown.
During training the CPU and GPU allocation was clear but what was strange the allocation of CPU for the first and second stage feature extractors(the Resnet CNN). The Batch NMS was running on GPU. See graphs below(Blue is for CPU and green is for GPU):
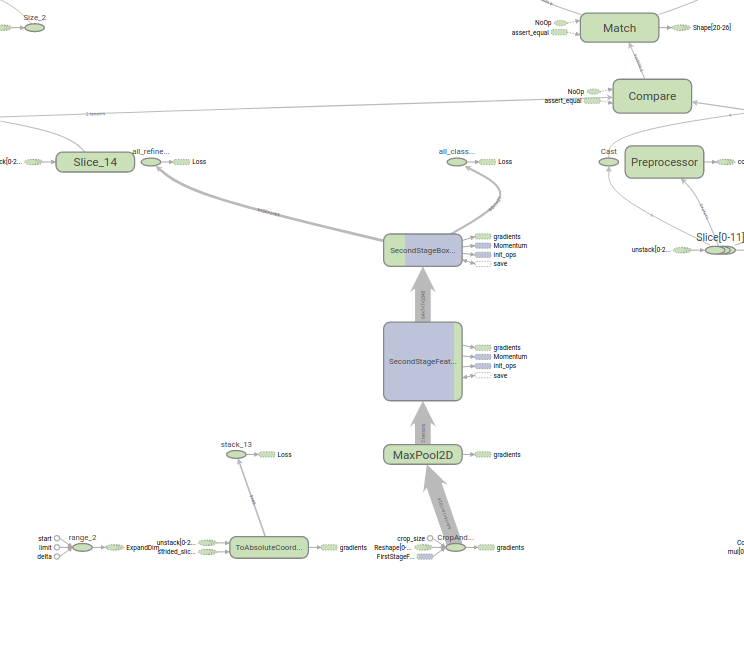
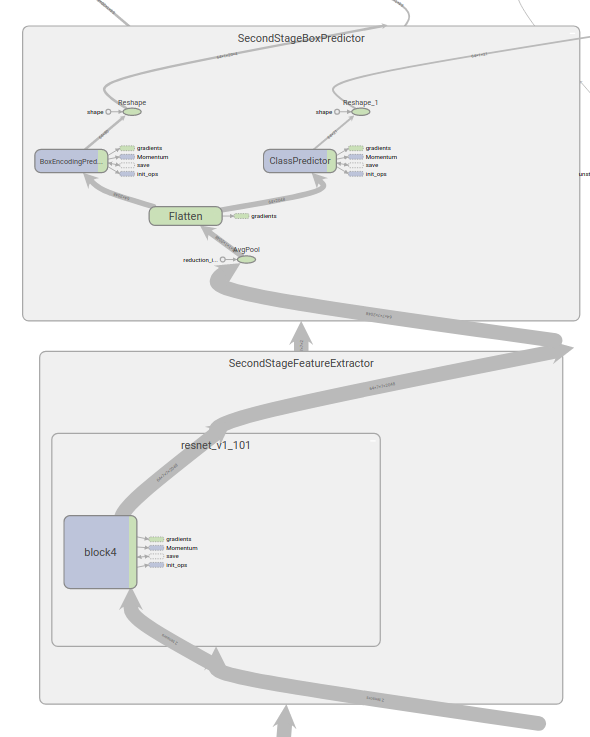
At inference time, the graph is different with there being two NMS steps and an additional SecondStage post processor(with the NMS in there) which appears to be the main components assigned /CPU0. However as per highlighted above, whilst the CPU0 assignment was given,in chrome trace, the first NMS was assigned to CPU(which too a longer time to run than the original frozen graph in the zoo surprisingly) and the second NMS still running on the GPU causing the tf.wheres.
Seems like the training graphs and inference graphs have some variations which makes this hard to debug on device allocation(with the unknown device still there) especially if we wanted to attempt the graph splitting method proposed by this issue or the method above to modify the faster-rcnn meta arch proposed by @gariepyalex . Anyone else has any other solutions to speed this up? Anyone tried the tensorflow C++ API? It compiles really slow for me so I haven't gotten around to speeding this up on that.
*Tested for inference and trace on Nvidia Drive PX 2 Ubuntu 16.04
*Trained on Amazon AWS P2 Cluster(K80)
*Python 2.7 and Tensorflow v1.7
 mpegew
on 11 May 2018
mpegew
on 11 May 2018
I created a function can take multiple images for inference, def run_inference_for_images(images, graph): , source can be found at my repo.
It's 10X ~ 30X faster than the original func in tutorial. But I still have a question as
- It seems not all GPU computing cycles are used, How to create a TF sessions pool with multiple sessions, so I can run more than one TF session at a time?
 dennywangtenk
on 30 May 2018
dennywangtenk
on 30 May 2018
@antoinebrl I also encounte the same problem. Have your found the solution?
 David-Lee-1990
on 13 Jun 2018
David-Lee-1990
on 13 Jun 2018
Hi I use ssdlite_mobilenet_v2 to detect hand . I have a similar problem , after using GTT(graph_transforms)the inference reduce 30%. But i want to make it faster, so i resize image to 100*100, but the presicion is very bad, do you know why ?
I'm training the model from scratch and have a try
 hengshan123
on 15 Jun 2018
hengshan123
on 15 Jun 2018
+Update,
- I tried creating TF sessions pool by init multiple Python processes, it didn't work, I got out-of-memory error right away.
- So I was requesting performance tuning documents from the team, (issue#4495)
dennywangtenk
on 18 Jun 2018
@dennywangtenk how did you utilize your code and function? Is this basically applying batch inference?
@pkulzc I need to use transfer learning to apply to models for my dataset. Which worked well, achieved ~ 47% AP, can use a bit more hyper parameter tuning maybe. But my inference time per image is ~330 ms (Azure NC12 series) for faster_rcnn_inception_resnet_v2, I did not apply any of the tricks mentioned above; used the model as is from the library. I am assuming the half lifetime is due to my GPU. But is it going to change more as we move towards these more complicated models or stay more less stable or around what is published in the model zoo metrics? You mentioned that I can improve my speed similar to eval.py file for batch inference, is this is same thing as denny doing above?
 BanuSelinTosun
on 26 Jun 2018
BanuSelinTosun
on 26 Jun 2018
Can anyone help me understand the code? I got the basic idea that it is trying to distribute operations on CPU and GPU but explanation on the two graphs, their structure and working would be very helpful. Thanks!
 ashwinijoshigithub
on 2 Jul 2018
ashwinijoshigithub
on 2 Jul 2018
At the first, I need to say thank you and nice work @wkelongws and @GustavZ.
This division technique is working similarly in ssd_mobilenet_v2, ssdlite_mobilenet_v2, ssd_inception_v2, and ssd_mobilenet_v1.
repository: https://github.com/naisy/realtime_object_detection
@ashwinijoshigithub,
I wrote simple howto here: https://github.com/naisy/realtime_object_detection/blob/master/About_Split-Model.md
Thank you.
 naisy
on 12 Jul 2018
naisy
on 12 Jul 2018
Thanks so much for the explanation @naisy .
ashwinijoshigithub
on 13 Jul 2018
@naisy any ideas how to do it in C++ ?
 ilidar
on 31 Jul 2018
ilidar
on 31 Jul 2018
Hi @ilidar,
I am not familiar with the C ++ API, but I think there are two ways.
A: It is the same method as Python. Create a new Input Placeholder and add that graph_def to the CPU part.
B: Once in Python, create frozen graph (divided into GPU part and CPU part) and save it in PB file. And use it in C++.
I don't have tried, but B seems easy.
naisy
on 1 Aug 2018
@naisy looks logical, thanks!
ilidar
on 1 Aug 2018
@naisy : Great explanation! Any idea how to extend the logic to faster rcnn model?
 priya-dwivedi
on 13 Aug 2018
priya-dwivedi
on 13 Aug 2018
Hi @priya-dwivedi,
I tried splitting about Faster R-CNN.
https://github.com/naisy/realtime_object_detection
First, check whether it becomes faster with device splitting.
This is very easy. It is possible to add several lines to the part loading pb file.
before:
        graph_def = tf.GraphDef()
        with tf.gfile.GFile(model_path, 'rb') as fid:
            serialized_graph = fid.read()
            graph_def.ParseFromString(serialized_graph)
            tf.import_graph_def(graph_def, name='')
after:
graph_def = tf.GraphDef()
with tf.gfile.GFile(model_path, 'rb') as fid:
serialized_graph = fid.read()
graph_def.ParseFromString(serialized_graph)
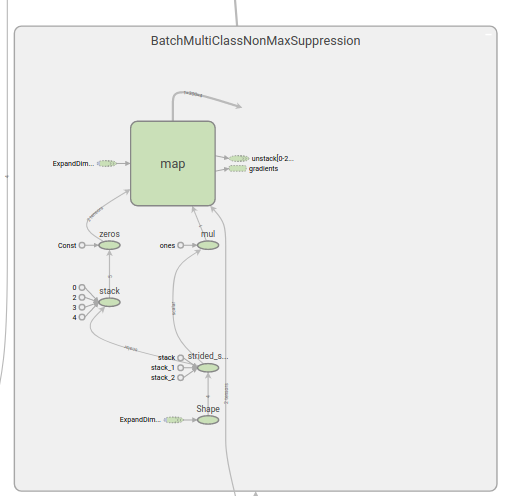
# force CPU device placement for NMS ops
for node in graph_def.node:
if 'BatchMultiClassNonMaxSuppression' in node.name:
node.device = '/device:CPU:0'
else:
node.device = '/device:GPU:0'
tf.import_graph_def(graph_def, name='')
Check these two timelines. (faster_rcnn_inception_v2_coco_2018_01_28)
before timeline:
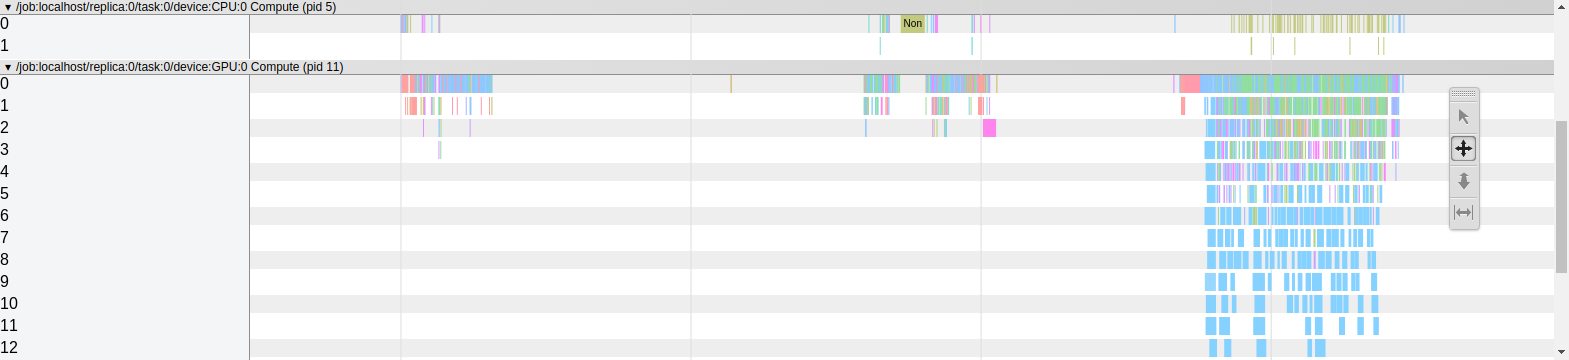
after timeline:
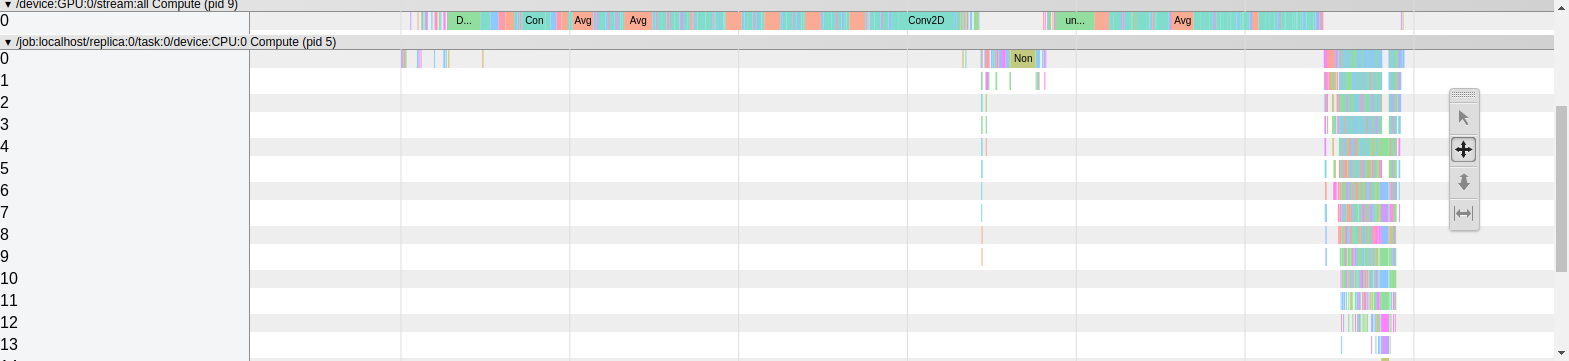
Speeding up is possible with split device. (17.9FPS -> 20.3FPS with 640x480)
Next, I tried threading.
It is not effective because there is a big difference in execution time between the GPU and the CPU, but it got faster. (20.3FPS -> 22.1FPS with 640x480)
Although splitting is possible in other places, expansion of the CPU part seems to be a model likely to become a bottleneck, because there is a place where GPU should be used also in the latter part.
naisy
on 16 Aug 2018
@naisy : Wow, this is quite cool. You were able to get a jump from 17.9 FPS to 22.1 FPS by splitting and threading. Thanks a lot for trying. Are you able to share your code so I can try and replicate it?
priya-dwivedi
on 16 Aug 2018
Hi @priya-dwivedi,
Of course. The code is in github. Please use it freely.
naisy
on 17 Aug 2018
This is good work @naisy thank you 😁🤜👍
 jlertle
on 17 Aug 2018
jlertle
on 17 Aug 2018
@wkelongws @naisy When i try to split the FRCNN model or move few operations from CPU to GPU the model is getting executed but not getting the detected output , when debugged could identify that there is data loss between moving of operations from CPU and GPU . Any suggestions for this problem faced
Thanks in advance
 abhigoku10
on 3 Sep 2018
abhigoku10
on 3 Sep 2018
Hi @abhigoku10,
I can not say correctly because I have not seen your code,
I think your sess.run() is incorrect.
Splitting node means that two graphs are created.
It should work correctly by getting the output of the first graph and giving it to the input of the second graph.
naisy
on 4 Sep 2018
@naisy Hi , have you tried splitting the graph for the Faster RCNN architecture where you successful in executing it with inference time
abhigoku10
on 4 Sep 2018
Hi @abhigoku10,
Here is the code to split Faster RCNN.
https://github.com/naisy/realtime_object_detection/tree/master/lib
naisy
on 4 Sep 2018
@naisy thanks for the pointer, can u pls suggest which file should i use detection_faster_v2.py or load_graph_faster_v2.py
abhigoku10
on 4 Sep 2018
Hi @abhigoku10,
Both are necessary.
load_graph_faster_v2.py splits the graph.
detection_faster_v2.py detects using the splitted graph.
If you have other questions about my repository, please write to my repository issue.
naisy
on 5 Sep 2018
I had noticed that load_image_into_numpy_array took about 900ms. https://github.com/tensorflow/models/issues/5356
 tispratik
on 30 Sep 2018
tispratik
on 30 Sep 2018
Hi @abhigoku10,
Both are necessary.
load_graph_faster_v2.py splits the graph.
detection_faster_v2.py detects using the splitted graph.If you have other questions about my repository, please write to my repository issue.
Hi @naisy, I saw that you did a good work in accelerating the code in splitting the graph. I am just starting with tensorflow and object detection API. I used the "object_detection_tutorial.ipynb" with some modifications to read frames from a video file, predict the bounding boxes and write the predicted frames to a new video file. Even using a GPU (tesla P100), I am getting predictions that take 1 second per frame. As I read here, I have the feeling that there might have something wrong in my code, because it is too slow for a single frame.. Do you have any advice for what I should look in order to make it faster? thank you a lot.
 engineer1982
on 13 Oct 2018
engineer1982
on 13 Oct 2018
Hi @engineer1982,
If you write session creation inside the loop, that will be late.
In the tutorial, session is created after loading frame, but if you want to predict consecutively,
- Create session.
- Read frame and predict in a while loop.
I think that this will be improved considerably.
naisy
on 14 Oct 2018
Hi @engineer1982,
If you write session creation inside the loop, that will be late.
In the tutorial, session is created after loading frame, but if you want to predict consecutively,
1. Create session.

2. Read frame and predict in a while loop.
I think that this will be improved considerably.
Thank you so much @naisy for a quick reply! I will try it today and get back to you. One more doubt: I am using train.py (legacy folder) to train a faster rcnn inception resnet v2. I have 93 images on my "train folder" and in the config file has batchsize = 1. When I run it using a GPU (tesla P100), each step takes 0,9s. As I am using a provided function from tensorflow, I believe it should have everything ok in the code.
1) is a step taking 0,9s to do foward and backpropagation in the whole 93 images or just 1? batchsize = 1.
2) If it is just a single image, is 0,9 seconds per step a good speed in training with a GPU?
thank you again for your help!
engineer1982
on 15 Oct 2018
Hi @engineer1982,
Sorry, I’m not familier about training code. And I have not trained with faster rcnn. So I cannot answer that.
naisy
on 16 Oct 2018
Hi @engineer1982,
Sorry, I’m not familier about training code. And I have not trained with faster rcnn. So I cannot answer that.
@naisy, ok :)
And in what application and hardware did you get 22 FPS?
engineer1982
on 19 Oct 2018
Hi @engineer1982,
with my repository and PC (GTX1060 6GB/TF1.6.1)
https://github.com/naisy/realtime_object_detection
naisy
on 20 Oct 2018
Here and here are explained some manners to divide the graph dynamically over several devices, reaching better performance in some tasks than manual placement. Maybe this can be useful to someone.
 daviduarte
on 9 Nov 2018
daviduarte
on 9 Nov 2018
Do you know why only first time takes longer time?
 hgsyo76
on 12 Nov 2018
hgsyo76
on 12 Nov 2018
@naisy @wkelongws How would this work with TensorRT? Would TensorRT have the same problems of improper cpu/gpu assignment or would it solve the problem?
 atyshka
on 4 Dec 2018
atyshka
on 4 Dec 2018
Hi @atyshka,
I think that similar processing is good in TensorRT.
As you can see from TF-TRT sample code, this problem can be easily solved.
https://github.com/NVIDIA-AI-IOT/tf_trt_models/blob/master/tf_trt_models/graph_utils.py#L80
naisy
on 4 Dec 2018
@naisy Pardon me if I'm wrong, but changing that one line with the NMS isn't what you meant by splitting the graph. You had a lot more code in there that used two separate graphs to run.
atyshka
on 4 Dec 2018
Hi @atyshka,
When spliting the graph, consider the dividing point by looking at the graph.
It is possible if it is TF-TRT, but I do not know about TensorRT/C++. It's not tensorflow.
naisy
on 4 Dec 2018
@dennywangtenk - In your code you are trying to have the graph loaded at once for all the images. Which would mean a significant reduction in i/o operations. right?
I'm working on my faster RCNN and trying the solutions mentioned in this issue.
 Manish-rai21bit
on 2 Jan 2019
Manish-rai21bit
on 2 Jan 2019
@naisy where you able to run the faster rcnn model built on tensorflow using tensor rt . Can you share some pointers on how to run it using tensor rt
abhigoku10
on 2 Jan 2019
@abhigoku10,
For tf-trt please refer to the following URL.
https://github.com/NVIDIA-AI-IOT/tf_trt_models
Looking at the code, it seems that not only SSD but also part of Faster R-CNN and Mask R-CNN correspond.
https://github.com/NVIDIA-AI-IOT/tf_trt_models/blob/master/tf_trt_models/detection.py#L51
naisy
on 4 Jan 2019
@naisy hi thanks for the pointers , but i am particularly looking for faster rcnn + inceptiion v2 architecture which is currently not available in the links you provided . can you pls give references on this
abhigoku10
on 4 Jan 2019
@abhigoku10,
When you read the code, you can see that it corresponds to inception_v2.
https://github.com/NVIDIA-AI-IOT/tf_trt_models/blob/master/tf_trt_models/classification.py
From this you can expect to work if you add faster_rcnn_inception_v2_coco setting to detection.py.
Please try it.
faster_rcnn_inception_v2_coco will also work.
naisy
on 4 Jan 2019
Hi @naisy thanks for the tips but when i looked into the file i am not able to find the faster_rcnn_inception_v2_coco in the file , but https://github.com/NVIDIA-AI-IOT/tf_trt_models/blob/master/tf_trt_models/detection.py i could see that there faster_rcnn_resnet50_coco
but not with inception . since if i convert the pf model for tensor rt i get execution errors during inference
Can you pls share more insights on this ,
abhigoku10
on 11 Jan 2019
It appears that @naisy code works for the pretrained faster rcnn 01_28 that is in Google's model zoo, but NOT for a retrained custom model based on that graph, because the retrained models lack the squeeze_2 and squeeze_3 nodes.
@abhigoku10 Were you able to solve this problem with the squeeze nodes? I noticed you encountered it before
 iocuydi
on 12 Jan 2019
iocuydi
on 12 Jan 2019
@iocuydi i was able to run the squeezenet but there was some error due to which i was getting wrong results during prediction
abhigoku10
on 12 Jan 2019
@abhigoku10,
Add faster_rcnn_inception_v2_coco settings into detection.py.
MODELS = {
...
    'faster_rcnn_inception_v2_coco': DetectionModel(
        'faster_rcnn_inception_v2_coco',
        'http://download.tensorflow.org/models/object_detection/faster_rcnn_inception_v2_coco_2018_01_28.tar.gz',
        'faster_rcnn_inception_v2_coco_2018_01_28',
    ),
You'd better ask TF-TRT questions at the TensorRT forum.
https://devtalk.nvidia.com/default/board/304/tensorrt/
naisy
on 14 Jan 2019
@naisy thanks for the info. I have asked the questions in the community but not getting any positive responses
abhigoku10
on 14 Jan 2019
Did anyone come up with a reliable reproducible solution?
 solitarysandman
on 9 Sep 2019
solitarysandman
on 9 Sep 2019
Hi There,
We are checking to see if you still need help on this, as this seems to be considerably old issue. Please update this issue with the latest information, code snippet to reproduce your issue and error you are seeing.
If we don't hear from you in the next 7 days, this issue will be closed automatically. If you don't need help on this issue any more, please consider closing this.
 tensorflowbutler
on 30 Jan 2020
tensorflowbutler
on 30 Jan 2020
Related issues
 hanzy123
·
3Comments
hanzy123
·
3Comments
 trungdn
·
3Comments
trungdn
·
3Comments
 nmfisher
·
3Comments
nmfisher
·
3Comments
 Mostafaghelich
·
3Comments
Mostafaghelich
·
3Comments
 dsindex
·
3Comments
dsindex
·
3Comments
Most helpful comment
@nguyeho7 I haven't tried the trick on faster-rcnn architecture but I believe it will perform in a similar way. The point is the graph nodes have to be assigned to GPU or CPU accordingly to achieve the reported inference speed. The trick here is not the optimal way to assign the nodes as @tokk-nv mentioned above. Apparently the device tags are initially there and then removed in these frozen graphs. So these released frozen graphs cannot achieve the reported inference speed.
@derekjchow Since the frozen graphs cannot achieve the reported inference speed due to the lack of optimal device assignment, I think the tensorflow team should provide: