Moby: [SWARM] Very poor performance for ingress network with lots of parallel requests
Description
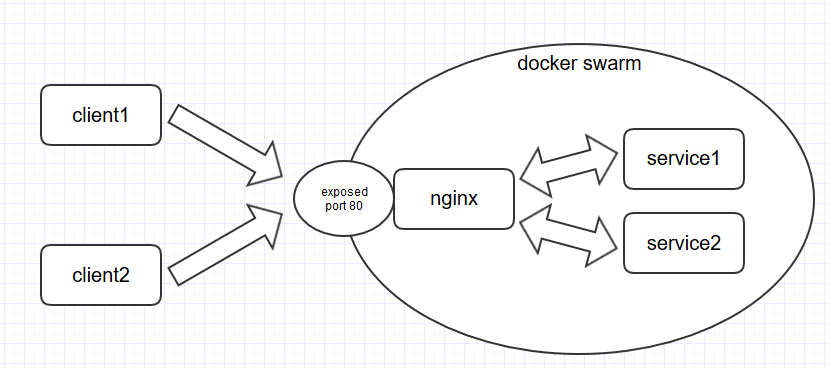
Executing a large number of parallel connections against plain Docker and Docker Swarms leads to 2 completely different perfomance results, with Swarm being the slowest one by a 50x factor!
The test is reproducible (at least on my VMs) easily with Siege and the official Nginx image, but I'm actually experiencing the problem in production with our custom java-based HTTP microservice. I cannot see any obvious error message in Docker logs or kernel logs.
Steps to reproduce the issue:
Run the nginx container:
[root@stresstest01 ~]# docker run -d --rm --net bridge -m 0b  -p 80:80  --name test nginx
35c231e361d7e5ca73fb1bcfbeeaf57a066da057b708055477855e6d16af575d
Siege the container, and the results are good, over 13k trans/sec, and CPU in stresstest01 is 100% used by the nginx process.
[root@siege01 ~]# siege -b -c 250 -t 20s -f test_vm_docker.txt >/dev/null
** SIEGE 4.0.2
** Preparing 250 concurrent users for battle.
The server is now under siege...

Lifting the server siege...
Transactions:             260810 hits
Availability:             100.00 %
Elapsed time:              19.03 secs
Data transferred:         140.03 MB
Response time:              0.02 secs
Transaction rate:       13705.20 trans/sec
Throughput:             7.36 MB/sec
Concurrency:              245.51
Successful transactions:      231942
Failed transactions:               0
Longest transaction:            7.03
Shortest transaction:           0.00
Now, lets try with Docker Swarm (1 node swarm, 1 container stack)
[root@stresstest01 ~]# cat docker-compose.yml
services:
  server:
    deploy:
      replicas: 1
    image: nginx:latest
    ports:
    - published: 80
      target: 80
version: '3.3'
[root@stresstest01 ~]# docker stack deploy test --compose-file docker-compose.yml
Creating network test_default
Creating service test_server


md5-f4221894196c970ed7866e093bb50670


[root@siege01 ~]# siege -b -c 250 -t 20s -f test_vm_docker.txt >/dev/null
** SIEGE 4.0.2
** Preparing 250 concurrent users for battle.
The server is now under siege...

Lifting the server siege...
Transactions:              65647 hits
Availability:             100.00 %
Elapsed time:              19.44 secs
Data transferred:          35.28 MB
Response time:              0.07 secs
Transaction rate:        3376.90 trans/sec
Throughput:             1.81 MB/sec
Concurrency:              246.66
Successful transactions:       58469
Failed transactions:               0
Longest transaction:            3.02
Shortest transaction:           0.00

[root@siege01 ~]# siege -b -c 250 -t 20s -f test_vm_docker.txt >/dev/null
** SIEGE 4.0.2
** Preparing 250 concurrent users for battle.
The server is now under siege...

Lifting the server siege...
Transactions:               4791 hits
Availability:             100.00 %
Elapsed time:              19.47 secs
Data transferred:           2.59 MB
Response time:              1.00 secs
Transaction rate:         246.07 trans/sec
Throughput:             0.13 MB/sec
Concurrency:              245.61
Successful transactions:        4291
Failed transactions:               0
Longest transaction:            1.20
Shortest transaction:           0.00


md5-f5189b7a8b687270178c2e57464b1815


Client:
 Version:      17.09.0-ce
 API version:  1.32
 Go version:   go1.8.3
 Git commit:   afdb6d4
 Built:        Tue Sep 26 22:41:23 2017
 OS/Arch:      linux/amd64

Server:
 Version:      17.09.0-ce
 API version:  1.32 (minimum version 1.12)
 Go version:   go1.8.3
 Git commit:   afdb6d4
 Built:        Tue Sep 26 22:42:49 2017
 OS/Arch:      linux/amd64
 Experimental: false


md5-68e3b4fb54f0418f4434fd7a6bb1eed7


Containers: 0
 Running: 0
 Paused: 0
 Stopped: 0
Images: 2
Server Version: 17.09.0-ce
Storage Driver: overlay
 Backing Filesystem: xfs
 Supports d_type: false
Logging Driver: json-file
Cgroup Driver: cgroupfs
Plugins:
 Volume: local
 Network: bridge host macvlan null overlay
 Log: awslogs fluentd gcplogs gelf journald json-file logentries splunk syslog
Swarm: active
 NodeID: s2ei2tx1nbf6lgn6d2yi9k782
 Is Manager: true
 ClusterID: s2dwwy929baleeoyk943wh2r9
 Managers: 1
 Nodes: 1
 Orchestration:
  Task History Retention Limit: 5
 Raft:
  Snapshot Interval: 10000
  Number of Old Snapshots to Retain: 0
  Heartbeat Tick: 1
  Election Tick: 3
 Dispatcher:
  Heartbeat Period: 5 seconds
 CA Configuration:
  Expiry Duration: 3 months
  Force Rotate: 0
 Autolock Managers: false
 Root Rotation In Progress: false
 Node Address: 192.168.10.187
 Manager Addresses:
  192.168.10.187:2377
Runtimes: runc
Default Runtime: runc
Init Binary: docker-init
containerd version: 06b9cb35161009dcb7123345749fef02f7cea8e0
runc version: 3f2f8b84a77f73d38244dd690525642a72156c64
init version: 949e6fa
Security Options:
 seccomp
  Profile: default
Kernel Version: 3.10.0-693.2.2.el7.x86_64
Operating System: CentOS Linux 7 (Core)
OSType: linux
Architecture: x86_64
CPUs: 16
Total Memory: 7.609GiB
Name: stresstest01
ID: 4XPS:KBEY:W53L:YAK6:4MZL:4HDN:DMUR:DD4T:5RWA:IUK6:522E:TCAL
Docker Root Dir: /var/lib/docker
Debug Mode (client): false
Debug Mode (server): false
Registry: https://index.docker.io/v1/
Experimental: false
Insecure Registries:
 127.0.0.0/8
Live Restore Enabled: false
Additional environment details (AWS, VirtualBox, physical, etc.):
It's a KVM virtual machine (under oVirt) but the same happens when using a physical machine.
 vide
vide
All 137 comments
This issue is a total blocker for me and for deploying Swarm in production. This is a graph of how response time changed after switching a component in our architecture from Swarm to plain docker, on the same exact hosts
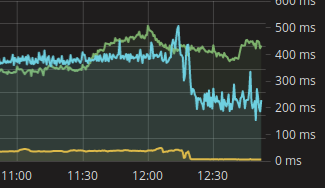
I think I'll start moving to Kubernetes
(green line is operations/sec, left Y-axis)
(comment copied from #35009 because at first I thought it was the same issue)
vide
on 4 Oct 2017
@vide the swarm-mode ingress is handled by IPVS and the connections are dispatched to the backend tasks over the overlay ingress network. But since it is a single node setup, the performance dip cannot happen due to the VXLAN headers used in overlay network. The only possible reason could be IPVS and it might require performance tuning for your case.
We can confirm the theory if you can change your stack file with an additional parameter mode:host under the ports section. This will bypass the IPVS and use the native port mapping just like docker run does. Can you pls confirm ?
ports:
  - target: 80
    published: 80
    protocol: tcp
    mode: host
 mavenugo
on 4 Oct 2017
mavenugo
on 4 Oct 2017
@mavenugo Yep, IPVS was my number 1 suspect too, didn't think about the mode: host trick.
Benchmarking again with the settings you suggested:
```# siege -b -c 250 -t 20s -f test_vm_docker.txt >/dev/null
* SIEGE 4.0.2
* Preparing 250 concurrent users for battle.
The server is now under siege...
Lifting the server siege...
Transactions: 238493 hits
Availability: 100.00 %
Elapsed time: 19.85 secs
Data transferred: 128.05 MB
Response time: 0.02 secs
Transaction rate: 12014.76 trans/sec
Throughput: 6.45 MB/sec
Concurrency: 245.38
Successful transactions: 212106
Failed transactions: 0
Longest transaction: 3.22
Shortest transaction: 0.00
```
Which is comparable to the plain docker results.
So, what tuning can I do on IPVS in this case? Upgrading kernel maybe? Obviously I need IPVS load balancing in production :)
vide
on 4 Oct 2017
@vide thanks for confirmation. We should spend a bit more time analyzing the issue before looking at IPVS as the source of performance issue (though I mentioned that in my previous comment :) ). I will give siege a try and get back to you.
mavenugo
on 5 Oct 2017
@mavenugo I've tried again on the same CentOS box with latest 4.13 kernel (4.13.4-1.el7.elrepo.x86_64) and the results are the same.
Plus, I've tried on my laptop's Ubuntu 17.04 install and results are bad here too.
vide
on 6 Oct 2017
@mavenugo could you reproduce it on your machine?
vide
on 10 Oct 2017
I can exactly reproduce the issue. The testing makes a new connection on each request.
Inactive connections soon piled up in ipvs.
$ sudo nsenter --net=/var/run/docker/netns/ingress_sbox ipvsadm -l
IP Virtual Server version 1.2.1 (size=4096)
Prot LocalAddress:Port Scheduler Flags
  -> RemoteAddress:Port           Forward Weight ActiveConn InActConn
FWM  274 rr
  -> 10.255.0.29:0                Masq    1      0          14074
If you can't wait for InActConn down to zero and run the testing again, you would get even poor result as described above.
On client side are full of "SYN_SENT".
tcp        0      1 192.168.105.67:47010    192.168.105.68:8000     SYN_SENT
tcp        0      1 192.168.105.67:46978    192.168.105.68:8000     SYN_SENT
tcp        0      1 192.168.105.67:47100    192.168.105.68:8000     SYN_SENT
tcp        0      1 192.168.105.67:47028    192.168.105.68:8000     SYN_SENT
tcp        0      1 192.168.105.67:47074    192.168.105.68:8000     SYN_SENT
tcp        0      1 192.168.105.67:47016    192.168.105.68:8000     SYN_SENT
tcp        0      1 192.168.105.67:46966    192.168.105.68:8000     SYN_SENT
tcp        0      1 192.168.105.67:47102    192.168.105.68:8000     SYN_SENT
tcp        0      1 192.168.105.67:46986    192.168.105.68:8000     SYN_SENT
...
If you want to work around this issue, set connection = keep-alive in your .siegerc file (use siege.config to generate a template .siegerc).
 xinfengliu
on 30 Oct 2017
xinfengliu
on 30 Oct 2017
@vide @xinfengliu I could reproduce it and narrowed it down to the Conntracker states causing the issue. We see much better performance making IPVS not to use conntracker (via --sysctl net.ipv4.vs.conntrack=0 for the siege container alone).
BTW, Pls also note that am using the Service VIP directly. Using the service name results in performance impact since Siege does DNS lookup for every query and that delays the process. Using the Service VIP directly removes the DNS lookups and the performance is much better.
$ docker run --rm  -itd --name sg3 --sysctl net.ipv4.vs.conntrack=0 --network testol2 ubuntu bash
ddddb204d2f70705b0044df7cced023e54d3a85745ecefe1c7915413c18eba81
root@Ubuntu-vm docker (master) $ docker exec -it sg3 bash
root@ddddb204d2f7:/# apt-get update && apt-get install siege
root@ddddb204d2f7:/# siege -c 100 -b -t20s http://10.0.1.3:5000
** SIEGE 3.0.8
** Preparing 100 concurrent users for battle.
The server is now under siege...
Lifting the server siege...      done.

Transactions:              79772 hits
Availability:             100.00 %
Elapsed time:              19.40 secs
Data transferred:           3.12 MB
Response time:              0.02 secs
Transaction rate:        4111.96 trans/sec
Throughput:             0.16 MB/sec
Concurrency:               95.35
Successful transactions:       79777
Failed transactions:               0
Longest transaction:            0.61
Shortest transaction:           0.00

FILE: /var/log/siege.log
You can disable this annoying message by editing
the .siegerc file in your home directory; change
the directive 'show-logfile' to false.
root@ddddb204d2f7:/#
@mavenugo Ok, so, how do I set virtual server conntrack to 0 in Swarm mode? According to https://docs.docker.com/compose/compose-file/#not-supported-for-docker-stack-deploy sysctl tuning is not supported with docker stack deploy :(
There's an open issue about that: https://github.com/moby/libentitlement/issues/35
vide
on 3 Nov 2017
This issue seems related, too: https://github.com/moby/moby/issues/31746
vide
on 3 Nov 2017
@vide idk about the docker stack deploy support. But can you pls confirm if the suggested workaround works in a non-stack deploy case ?
mavenugo
on 3 Nov 2017
--sysctl net.ipv4.vs.conntrack=0 can not use at ingress routing mesh on ingress_sbox. As the ipvs will do SNAT after forwarding.
In kubenetes's kube-proxy service. will set those kernel parameters:
https://github.com/kubernetes/kubernetes/blob/master/pkg/proxy/ipvs/proxier.go#L88-L91
and net.netfilter.nf_conntrack_buckets, net.netfilter.nf_conntrack_max.
 BSWANG
on 4 Nov 2017
BSWANG
on 4 Nov 2017
Hello,
i'm on RHEL7.4 and docker 1.12. Testing on 2 node cluster with nginx:latest deployed in mash mode. I can reproduce the results @vide . But my test case is slightly different.
Instead of running siege as a container, i run it from outside of the cluster to load test the a pair of nginx containers. I experience a 10x degradation in response time and throughput.
against the cluster:
[root@l1vnetwt-2 siege-4.0.4]# siege  -r1000 172.16.1.7:8080/index.html
[alert] Zip encoding disabled; siege requires zlib support to enable it
** SIEGE 4.0.4
** Preparing 255 concurrent users for battle.
The server is now under siege...
Transactions:             255000 hits
Availability:             100.00 %
Elapsed time:            1004.25 secs
Data transferred:         148.83 MB
Response time:              1.00 secs
**Transaction rate:       253.92 trans/sec**
Throughput:             0.15 MB/sec
Concurrency:              254.90
Successful transactions:      255000
Failed transactions:               0
Longest transaction:            1.20
Shortest transaction:           0.00
against a stand alone nginx:
[az@netdev virt]$ siege -r1000 10.253.130.49/index.html

================================================================
WARNING: The number of users is capped at 255.  To increase this
         limit, search your .siegerc file for 'limit' and change
         its value. Make sure you read the instructions there...
================================================================
** SIEGE 4.0.4
** Preparing 255 concurrent users for battle.
The server is now under siege...
Transactions:             255000 hits
Availability:             100.00 %
Elapsed time:              92.20 secs
Data transferred:         148.83 MB
Response time:              0.09 secs
**Transaction rate:      2765.73 trans/sec**
Throughput:             1.61 MB/sec
Concurrency:              241.86
Successful transactions:      255000
Failed transactions:               0
Longest transaction:            1.70
Shortest transaction:           0.00
this is a complete blocker for any further implementation of docker swarm for us. What is the proposed fix and timing on this? thank you.
 az-z
on 15 Dec 2017
az-z
on 15 Dec 2017
Hello,
We bumped into this same problem with the meshed LVS balancing, we have very poor performance.
Currently I worked around with host mode configuration, but I hope it's only a temporary solution.
Any plan to fix this?
test in host mode with ab (only 1 container):
Requests per second: 3424.63 [#/sec] (mean)
test in ingress mode with ab:
netstat on client:
tcp        0      1 10.41.0.3:35078             10.41.1.1:11007             SYN_SENT    51986/ab            on (0.29/0/0)
tcp        0      1 10.41.0.3:35742             10.41.1.1:11007             SYN_SENT    51986/ab            on (0.78/0/0)
...
tcp        0      1 10.41.0.3:35976             10.41.1.1:11007             SYN_SENT    51986/ab            on (0.84/0/0)
tcp        0      1 10.41.0.3:35520             10.41.1.1:11007             SYN_SENT    51986/ab            on (0.72/0/0)
ipvsadm output in ingress namespace:
-> 10.255.0.33:0                Masq    1      0          4619
-> 10.255.0.35:0                Masq    1      0          4599
-> 10.255.0.36:0                Masq    1      0          4611
ab:
Requests per second: 356.31 [#/sec] (mean)
 EmarMikey
on 9 Jan 2018
EmarMikey
on 9 Jan 2018
Solved mine by upgrading to the latest docker from centos repo.
On Jan 9, 2018 12:10, "EmarMikey" notifications@github.com wrote:
Hello,
We bumped into this same problem with the meshed LVS balancing, we have
very poor performance.
Currently I worked around with host mode configuration.
Any plan to fix this?—
You are receiving this because you commented.
Reply to this email directly, view it on GitHub
https://github.com/moby/moby/issues/35082#issuecomment-356349718, or mute
the thread
https://github.com/notifications/unsubscribe-auth/AExz3Srkpl5IvrQoS7IJJOuTjFUeMVw8ks5tI52hgaJpZM4PtUll
.
az-z
on 9 Jan 2018
@az-z which is? docker-ce 17.12 or the old one 1.12 or smth?
 JacksonHill
on 17 Jan 2018
JacksonHill
on 17 Jan 2018
@vide have you checked if there are TCP retransmissions going on in your swarm setup. We see a lot of retransmissions for traffic heading through the ingress-sbox (where the IPVS is handled). The ingress-sbox would be the one with IP 172.18.0.2 on the docker_gwbridge.
This could easily be seen in our case between an nginx and a memcached container, where 1 second often was added on top of the total request time - something which strongly indicated retransmissions. Capturing 20 seconds of traffic with wireshark on the host showed that indeed a lot of retransmissions were going over the docker_gwbridge.
We have still not come to a solution on the issue #36032 which I have to say is fairly critical. We have this issue in a running production system, and we're starting to become quite desperate about it.
We're running ubuntu 16.04 and Docker 17.09 (we recentely upgraded to 17.12, but that was a disaster in many ways, so we downgraded again).
 sbrattla
on 1 Feb 2018
sbrattla
on 1 Feb 2018
Jacek,
Ce 17.12.
On Jan 17, 2018 10:59, "Jacek Grzechnik" notifications@github.com wrote:
@az-z https://github.com/az-z which is? docker-ce 17.12 or the old one
1.12 or smth?—
You are receiving this because you were mentioned.
Reply to this email directly, view it on GitHub
https://github.com/moby/moby/issues/35082#issuecomment-358349957, or mute
the thread
https://github.com/notifications/unsubscribe-auth/AExz3Wl-Hd7IeJkfmT2cxqDfC7tMydJ2ks5tLhj4gaJpZM4PtUll
.
az-z
on 1 Feb 2018
@vide hi, is there any progress on this case?
 wuzhefang
on 31 Mar 2018
wuzhefang
on 31 Mar 2018
@wuzhefang Nope, sorry, I moved to Kubernetes due to this issue
vide
on 3 Apr 2018
According to this issue and the post from #31746, I can add a bit of info here.
Very easy steps to reproduce, with a single swarm node.
Docker version:
Client:
 Version:       18.03.0-ce
 API version:   1.37
 Go version:    go1.9.4
 Git commit:    0520e24
 Built: Wed Mar 21 23:10:01 2018
 OS/Arch:       linux/amd64
 Experimental:  false
 Orchestrator:  swarm

Server:
 Engine:
  Version:      18.03.0-ce
  API version:  1.37 (minimum version 1.12)
  Go version:   go1.9.4
  Git commit:   0520e24
  Built:        Wed Mar 21 23:08:31 2018
  OS/Arch:      linux/amd64
  Experimental: false
OS of the machine where docker runs:
Distributor ID: Ubuntu
Description:    Ubuntu 16.04.4 LTS
Release:        16.04
Codename:       xenial
a) Install swarm on a single node, and on that node:
docker service create --name nginx -p 80:80 --replicas 1 nginx
b) On the same console, execute:
watch -n 0.5 "sudo nsenter --net=/var/run/docker/netns/ingress_sbox cat /proc/net/ip_vs_conn | grep TIME_WAIT | wc -l"
This will monitor the ingress network for connections in TIME_WAIT state and every half second will spit how many of them do exist in that moment.
c) From another machine on the same network, use some load generator (I used ab from apache2-utils):
(The IP of my docker swarm machine is 192.168.1.11)
ab -n 10000 -c 100 http://192.168.1.11/
d) If you execute the snippet from c), +/- the following will be shown in the watch command from b) during a good amount of time:
Every 0.5s: sudo nsenter --net=/var/run/docker/netns/ingress_sbox cat /proc/net/ip_vs_conn | grep...

10064
Where 10064 are the 10k connections from the load test plus a few additional connections (don't really matter for our thing).
e) If you manage to execute the snippet from c) so that the result from b) gets the same value as the result from following command on the swarm node:
sysctl net.ipv4.ip_local_port_range | awk '{print $4 - $3}'
Congestion will start to happen. There are no more available source ports for this 'source IP + dest IP + dest port' combination.
f) Elaborating from here, it happens that the load-balancing mechanism in docker swarm uses facilites from ipvs (a module in the Linux Kernel that can itself act as a load balancer).
g) A variation of command in b) is:
sudo nsenter --net=/var/run/docker/netns/ingress_sbox cat /proc/net/ip_vs_conn | head
If you execute that right after executing the load test, you will see something like:
Pro FromIP   FPrt ToIP     TPrt DestIP   DPrt State       Expires PEName PEData
TCP C0A8010C BAF8 AC120002 0050 0AFF006A 0050 TIME_WAIT       119
TCP C0A8010C A830 AC120002 0050 0AFF006A 0050 TIME_WAIT       118
TCP C0A8010C A51A AC120002 0050 0AFF006A 0050 TIME_WAIT       117
TCP C0A8010C B807 AC120002 0050 0AFF006A 0050 TIME_WAIT       119
TCP C0A8010C B331 AC120002 0050 0AFF006A 0050 TIME_WAIT       118
TCP C0A8010C B424 AC120002 0050 0AFF006A 0050 TIME_WAIT       119
TCP C0A8010C BD14 AC120002 0050 0AFF006A 0050 TIME_WAIT       119
TCP C0A8010C B81D AC120002 0050 0AFF006A 0050 TIME_WAIT       119
TCP C0A8010C AF8F AC120002 0050 0AFF006A 0050 TIME_WAIT       118
Which is telling us that the timeout value for the TIME_WAIT state on the connections is very probably (at least in my test setup) 120s.
h) You can sysctl the node where swarm runs searching for that 120 value (obtained from g) )
sysctl -a | grep 120
i) And the docker swarm network for this same value:
sudo nsenter --net=/var/run/docker/netns/ingress_sbox sysctl -a |grep 120
j) And this is the end
From this point, no parameter that I tuned using either
sysctl -w ...
Or
sudo nsenter --net=/var/run/docker/netns/ingress_sbox sysctl -w ...
affected that TIME_WAIT timeout.
Don't really know if ipvs / netfilter (the underlying mechanism used by ipvs) is really using those sysctl-ed values (at least when triggered by docker swarm).
And from this point in a cul-de-sac.
 tmarti
on 18 Apr 2018
tmarti
on 18 Apr 2018
Finally found the problem.
As a last-resort option, and knowing that swarm relies on netfilter facilites to do its internal load balancing for overlay networks (as the very simple case for the service in the prevous post which by default uses an overlay network), I downloaded the Linux Kernel and tampered a little bit with the files.
The sources of interest reside in the following folder:
[kernel source dir]/net/netfilter
That TIME_WAIT timeout is hardcoded inside this file from the ip_vs module, inside:
[kernel source dir]/net/netfilter/ipvs/ip_vs_proto_tcp.c
You can check the latest version of this file (which suffers from the same problem) here:
https://github.com/torvalds/linux/blob/master/net/netfilter/ipvs/ip_vs_proto_tcp.c
Inside this file, you can see following piece of code:
static const int tcp_timeouts[IP_VS_TCP_S_LAST+1] = {
    [IP_VS_TCP_S_NONE]      =   2*HZ,
    [IP_VS_TCP_S_ESTABLISHED]   =   15*60*HZ,
    [IP_VS_TCP_S_SYN_SENT]      =   2*60*HZ,
    [IP_VS_TCP_S_SYN_RECV]      =   1*60*HZ,
    [IP_VS_TCP_S_FIN_WAIT]      =   2*60*HZ,
    [IP_VS_TCP_S_TIME_WAIT]     =   2*60*HZ,
    [IP_VS_TCP_S_CLOSE]     =   10*HZ,
    [IP_VS_TCP_S_CLOSE_WAIT]    =   60*HZ,
    [IP_VS_TCP_S_LAST_ACK]      =   30*HZ,
    [IP_VS_TCP_S_LISTEN]        =   2*60*HZ,
    [IP_VS_TCP_S_SYNACK]        =   120*HZ,
    [IP_VS_TCP_S_LAST]      =   2*HZ,
};
So the guilty of that high timeout is:
[IP_VS_TCP_S_TIME_WAIT] = 2*60*HZ,
If the previous one is changed to:
[IP_VS_TCP_S_TIME_WAIT] = 2*HZ,
The TIME_WAIT timeout is lowered from 120s to 2s.
Then recompiling the module, replacing the system module with the compiled one, rebooting the swarm machine, restarting the service and repeating the load test yields incredibly good results. No more flooding of connections in TIME_WAIT state is observed for moderately high loads (2000 req/s).
If the code from the rest of the file is inspected, there is really no way (or I don't see it) to reload those timeouts. That tcp_timeouts vector seems to be used to initialize the internal timeout table that will be used for the connection management, (without apparently any way to tune it) in this function:
/* ---------------------------------------------
 *   timeouts is netns related now.
 * ---------------------------------------------
 */
static int __ip_vs_tcp_init(struct netns_ipvs *ipvs, struct ip_vs_proto_data *pd)
{
    ip_vs_init_hash_table(ipvs->tcp_apps, TCP_APP_TAB_SIZE);
    pd->timeout_table = ip_vs_create_timeout_table((int *)tcp_timeouts,
                            sizeof(tcp_timeouts));
    if (!pd->timeout_table)
        return -ENOMEM;
    pd->tcp_state_table =  tcp_states;
    return 0;
}
The file ip_vs_ctl.c, which seems to be in charge of updating the tuning for the module, exposes following systctl parameters:
IPVS sysctl table (under the /proc/sys/net/ipv4/vs/)

.procname       = "amemthresh",
.procname       = "am_droprate",
.procname       = "drop_entry",
.procname       = "drop_packet",
.procname       = "conntrack",
.procname       = "secure_tcp",
.procname       = "snat_reroute",
.procname       = "sync_version",
.procname       = "sync_ports",
.procname       = "sync_persist_mode",
.procname       = "sync_qlen_max",
.procname       = "sync_sock_size",
.procname       = "cache_bypass",
.procname       = "expire_nodest_conn",
.procname       = "sloppy_tcp",
.procname       = "sloppy_sctp",
.procname       = "expire_quiescent_template",
.procname       = "sync_threshold",
.procname       = "sync_refresh_period",
.procname       = "sync_retries",
.procname       = "nat_icmp_send",
.procname       = "pmtu_disc",
.procname       = "backup_only",
.procname       = "conn_reuse_mode",
.procname       = "schedule_icmp",
.procname       = "ignore_tunneled",
.procname       = "debug_level",
Nothing like timeouts exposed here.
So there is no effective way to update the TIME_WAIT timeout parameter for this module once it has started (nor to tweak it so the module reads the tuned value during init).
If anybody has an idea of how this problem could be workarounded (s)he will deserve big hugs.
Currently, in a cul-de-sac again. (it is not very practical to recompile kernel modules after each kernel image upgrade)
tmarti
on 19 Apr 2018
Fantastic work!! But the kernel mailing list seems to be the next step..
 raarts
on 20 Apr 2018
raarts
on 20 Apr 2018
Thanks @tmarti that's definitely an interesting find!
 thaJeztah
on 20 Apr 2018
thaJeztah
on 20 Apr 2018
A 2 minute timeout for TIME_WAIT is very standard in practice. It's 2 times the maximum internet lifetime (projected) of a TCP segment and the intent is to ensure that the final ACK gets delivered. If it gets lost the other side will try to resend the FIN and the state needs to still be there in order for the other end to re-respond with the final ACK. (see https://en.wikipedia.org/wiki/Maximum_segment_lifetime and of course https://www.ietf.org/rfc/rfc793.txt) You can set the MSL in the linux kernel ... but it's rarely something one does. Apparently IPVS doesn't even give you the option.
Wasn't aware of this issue, but will read back over it. A larger maximum number of IPVS mappings might well solve the issue and would presumably be something one could set. (if the max mappings were sufficient to absorb steady-state behavior.) What is the desired connection rate?
 ctelfer
on 20 Apr 2018
ctelfer
on 20 Apr 2018
Of course! How silly from my part.
I have a small theory that want to share with you.
Had to stumble with this post...
https://stackoverflow.com/questions/10085705/load-balancer-scalability-and-max-tcp-ports
... to realise one very simple fact.
We're some of us tired of inspecting netsat -nolap output from time to time.. and everyday we see that a TCP connection is identified by for values:
- source IP
- source port
- destination IP
- destination port
Usually, there are 2 degrees of freedom in this combination:
the source ip: because you normally accept connections from many diferent clients, you can assume this value to spread among different values
source port: this will correspond to some ephemeral port from the client (those in (ubuntu land) range usually from 32768 to 60999
And the other two are fixed:
- destination IP: the server public IP
- destination port: the webserver port (80 in this case)
What is the problem with the initial load test from @vide? (and mine, of course)
The problem with that setup is that you're actually fixing the source IP (because connections under the load test come all from a single PC, which is the node from where we launch the loa test) and getting one less degree of freedom.
So, for the load test, the possible combinations of the "key" that uniquely identifies one connection are reduced to the available number of ephemeral ports on the client (that magic number 28231), because all the other parameters are fixed.
What made look into other plalces for this problem?
I tried it reall hard this afternoon to dig into the code of ipvs module. Not as easy as it sounds: 16k lines of code and it implements its own TCP stack with load blancing and NAT as a bonus track.
Nice thing about that, is that I was able to see that the "current connections" list "key" is composed of precisely the source address:port (the client one!) and the destination adress:port (as done in function nf_nat_used_tuple of the module).
So what happens when the client tries to reuse a port (remember that the other 3 parameters are always the same in this tainted load test) that correspond to a connection in TIME_WAIT state? Well, at the end, the connection attempt gets discarded (not sure if it's due to a mismatching TCP seq. number in the connection state or whatever).
So what next?
In order to confirm that, no sysctl tweaks are needed, no kernel module source tampering is needed, nothing that low-level is actually needed.
Instead of doing a load test with 2000 req/s from a single source IP (which will exhaust connections in about 14s according to the port range 32767-60999 and the other parameters fixed), just launch 200req/s from 10 different source IPs, and confirm that the throughput remains steady.
During monday I'll try to do the proposed test and come back to here.
Many thanks @raarts and @thaJeztah for the encouragement.
And many many thanks @ctelfer for your comment. I was really stuck with the idea of sysctl-ing the ipvs module, and your comment totally overwhelmed me at the beginning, but finally led me to look into other places.
tmarti
on 20 Apr 2018
Finished a slightly different variant of the proposed test.
Test 1: First, let's recap and reproduce the tainted load test connection table saturation
For this test we need:
- a machine where docker swarm will run
- a machine from where to launch the tainted load test
Very simple steps to reproduce the tainted test:
a) create a single-replica swarm service on the swarm machine:
docker service create --name nginx -p 80:80 --replicas 1 nginx
In my case, this gives me 28232
b) now, go to the node from where we will execute this first load test and execute:
sysctl net.ipv4.ip_local_port_range | awk '{print $4 - $3}'
This will give us the number of different ephemeral ports from which the load test will be launched.
c) now, go to the swarm machine and execute:
watch -n 0.5 "sudo nsenter --net=/var/run/docker/netns/ingress_sbox cat /proc/net/ip_vs_conn | grep TIME_WAIT | wc -l"
This will continuosly monitor (each half second) the ipvs module (the real load balancer module used by docker swarm) for the number of connections in TIME_WAIT state.
d) now, go to the node from where the load test will be launched and execute:
ab -n 30000 -c 100 http://192.168.1.11/
Please note two things here:
- 192.168.1.11 is the IP of my swarm machine
- it is very important that 30000 is a number slightly above the number obtained from b)
e) on the node from the load test is launched, you will notice that ab gets stuck before ending
f) on the swarm node (the one where you are executing the watch command), you will see that the number of connections in TIME_WAIT state is a little bit below the number obtained from b)
What does this first load test tell us?
Nothing new according to previous comments in this issue.
We see a limit on the maximum number of requests the load test can absorb.
We only see that once the swarm node "fills" the connection table, a drop in accepted throughput happens, and this can be seen because the ab test on the load injector machine gets stuck without finishing.
It seems that we cannot get more than 28k-and-a-bit-more connections in TIME_WAIT state on the swarm machine.
Test 2: What does it mean to "fill" the connection table?
Now let's do a variation on the test, 5 minutes after the previous test (so that connection in TIME_WAIT state do expire and the connection table in the swarm machine is emptied).
a) go to the node from where we launched the load test and execute the following:
sudo sysctl -w net.ipv4.ip_local_port_range="10000 61000"
This will set the ephemeral port range to that 51k different ports can be used.
Wait! This will be executed on the machine from where we will launch the load test? Yes my friend, rememeber that this is a tainted load test, so things are not as they seem.
b) now, keeping the watch command in execution on the swarm machine, execute the following on the node from which we do the load test:
ab -n 60000-c 100 http://192.168.1.11/
Wait! Now we've increased the number of requests! Yes, so that it's slightly above the magical number 51k from a).
c) Monitor the output of the watch command in the swarm machine.
We will see that the ab command on the traffic injector machine gets stuck again, but this time... the watchcommand output on the docker machine gives us a number that's slightly below 51k!
No way! What's happening here!?
Simply put, and recapping from a previous post in this issue.
What does identify "an entry in the connection table"?
A tuple composed of source IP+source port+dest IP+dest port.
Remember from previous the post that in the tainted version of the load test, we're making 3 (out of the previous 4) parameters fixed.
So in the swarm machine, we are allowed to have as many different connections as source ports are used.
And guess what? The number of different source ports in the previous two tests corresponds to the sysctl parameter net.ipv4.ip_local_port_range from the machine where we lauched the load test.
Test3: And how we do un-taint the load test!?
Let's do an exercise:
- remember that the TCP TIME_WAIT state timeout for the ipvs module is hardcoded to 120s, and that value can't be
sysctl'ed - rememeber that the swarm node will not be able to keep more connections created from a node injector than the value of
sysctl net.ipv4.ip_local_port_range | awk '{print $4 - $3}'executed on the injector machine (in my case around 28k)
28k requests / 120s = approx 230 req/s
So simply put, inject 150 requests/s from 10 different nodes and see what happens
In this case, I will do a variation, so prepare:
- the docker swarm machine without connection in TIME_WAIT state (wait a little from the last test you executed)
- 3 machines from which we will inject requests using
abinto the swarm machine
Let's begin!
a) before starting the test, execute the following on each of the 3 nodes from which we will launch ab:
sudo sysctl -w net.ipv4.ip_local_port_range="10000 61000"
This will give us a higher number of connections when we reach the point to see the test result.
b) now on the swarm node, as usual, execute:
watch -n 0.5 "sudo nsenter --net=/var/run/docker/netns/ingress_sbox cat /proc/net/ip_vs_conn | grep TIME_WAIT | wc -l"
c) go into JUST ONE of the traffic injector nodes and execute:
ab -n 60000-c 100 http://192.168.1.11/
d) eventually, the output value from b) will stop growing and the ab command from c) will get stuck
e) go into the SECOND of the traffic injector nodes and execute:
ab -n 60000-c 100 http://192.168.1.11/
f) magic! the number of connections as shown in b) increases!
g) even more! go into the THIRD of the traffic injector nodes and execute:
ab -n 60000-c 100 http://192.168.1.11/
Wait until this ab command gets stuck.
i) WOW! The number of connections as shown in b) increases more!
In my case, the output from b) is:
Every 0.5s: sudo nsenter --net=/var/run/docker/netns/ingress_sbox cat /proc/net/ip_vs_conn | grep TIME_WAIT | wc -l

124299
And that's it. We want from 28k simultaneous connections in TIME_WAIT state to well above 100k.
Hey! But 51k*3 = 153k connections, and we only got 124k!
Well, as the result from the test went well, I won't investigate further, but I suspect this could be caused by the ipvs module calculating some hash in order to do the connection keying and, as in my case I'm injecting traffic from IPs which are very bitwise similar, maybe there are some hash collisions. Or maybe each hash structure bucket does not contain enough space to hold that high number of collisions. Don't really know.
Maybe it's simply this this still is a semi-tainted test (we've spread a little the number of IP addressed from where we lauched the test, but in real world scenarios we will have many more client IPs with lots fewer requests/s from each IP).
Conclusion
At first glance, it seemed that due to the swarm ingress network not being ablt to aborb a At first glanc high-and-sustained in terms of requests/s, some tweaking should have to be done via sysctl on the swarm machine.
Investingating a little, it seemed that a good option would be to patch the ipvs kernel module in order to reduce the TIME_WAIT timeout, because it seemed that the cause of the poor throughput in the ingress network was "filling" the connection table with connections in TIME_WAIT state, so it looked like a good idea to quickly clean up those connections.
Further testing showed that the real cause was a bad designed load test, and the limit was not on "filling" the connection table on the swarm machine but of the number of different combinations of "source IP"+"source port" in the load test requests.
So far so good, we've seen how a bad desinged load test can lead to switching to Kubernetes.
And there might be other perfectly valid reasons for the switch, but not the results of bad load test.
Simply... next time (and this includes me of course) remember to launch load tests from different machines!
tmarti
on 23 Apr 2018
@tmarti Please read carefully all the comments before jumping to conclusions. The test is not flawed, the test is basically a reproduction of what was already happening in real production with real production load in my environment (thousand of connections per second from real clients on the internet, proxied to Swarm by load balancers). And the same test works as expected with the same exact configuration, just without Swarm mode (or using host networking). So, Swarm is still broken and this issue is still valid and unresolved.
vide
on 23 Apr 2018
I'm sorry @vide, it wasn't my intention in any way to unerdmine your problem.
I suppose the emotion prevented me from taking into account this statement from yours:
but I'm actually experiencing the problem in production with our custom java-based HTTP microservice
I did a small test removing the service from docker swarm and executing in the docker machine:
docker container run -p 80:80 --name nginx -d nginx
And then, from another machine, executing:
curl 192.168.1.11
Now, in the docker machine, I don't observe any connection in TIME_WAIT state.
BUT in the "another machine", if I do:
netstat -noal | grep TIME_WAIT
I can see:
tcp 0 0 192.168.1.12:19841 192.168.1.11:80 TIME_WAIT timewait (58.73/0/0)
What happens here? Now the TIME_WAIT state does not happen in the docker machine but on the machine from where we do the request.
Strange, eh?
According to the TCP protocl RFC (https://www.ietf.org/rfc/rfc793.txt, section 3.5. Closing a Connection and around), the endpoint that ends up in TIME_WAIT state is the endpoint that does a closeon the connection
What this tells us is that:
- on the load test case with swarm, and on your java-microservices case, ther
docker service createcase, the endpoint that is closing the connection is theipvsmodule, and it is it who ends in TIME_WAIT state. - on the simplest case, the
docker container runcase, it is the client who closes the connection and hence ends in TIME_WAIT state.
_Is it possible that your java micro-service is invoked always from the same IP (or from a few IPs but with high throughput from each of them?)._
Or either:
_Is it possible that it is your java micro-service the one that is invoking some other micro-service balanced with swarm also with high throughput?_
Keep in mind that either of the endpoints (even it's possible that both endpoints exeperience this) that closes the TCP connection will end up in TIME_WAIT state.
I suspect that in your scenario, it would be more convenient to avoid ipvs closing the connection and letting the remote endpoiont close the connection and deal with the TIME_WAIT timeout. But in any case, in the case of micro-services which call other load-balanced micro-services, either of the two must deal with connections in TIME_WAIT state.
Also in this case it would be interesting to be able to tweak the TIME_WAIT timeout for the ipvs module.
I cannot guess much more without knowing the details of your case, but in any case I'm not an expert on the subject.
tmarti
on 23 Apr 2018
@vide, you edited your last comment and added this:
proxied to Swarm by load balancers
Next time create a new comment, so the responses to your comments keep coherent.
Based on you edit, here you have your problem.
Load balancers are surely source-NAT-ing the connections from real clients, so swarm sees them as comming from very few different IPs (as many different IPs as proxyfier load balancers you have), which trigger the described problem.
So here you have the same case as the tainted load test.
Maybe (I'm a little bit new to this arquitecture world) you could assign several different outbound IPs to each proxifer-load-balancer to add a little bit of diversity to the IPs swarm _sees_ and mitigate this problem. Of course, this would only be a workaround.
tmarti
on 23 Apr 2018
@tmarti the java microservice receives/received (I don't work there anymore, so I can't really say) all the connections from a couple of haproxy instances, we just switched the backend servers from pointing to several separated instances to the several Swarm slave IPs having the service port exposed, and you can see the response time difference when rolling back to the non-swarm configuration in the screenshot I've attached. The only difference in the setup was Swarm, hence I put the blame on it.
Maybe the TIME_WAIT on the IPVS side has some implication on the issue (generating socket starvation), or maybe in the end my test was not an exact reproduction of what was happening in production, but as I said I can not give you more details or test changes because I don't have access to that infra anymore. :(
vide
on 23 Apr 2018
@tmarti I swear I've only edited typos, and just a few seconds after adding the comment
vide
on 23 Apr 2018
No need to swear.
From whay you say about the haproxy instances, the problem is the same as in the bad load test: swarm balancer seeing too little different IPs given the high inbound troughput, which leads to connection saturation (according to ipvs hash-keying the connections by sourceIP:sourcePort + destIP:destPort).
I don't really think it's a swarm or ipvs design problem, there is really skilled people behind those products.
But this case teaches all of us a great lesson. As well as we do test our code, we must test our architecture so that it makes a proper use of the underlying technologies, and before blaming a product, trying to see the real cause of what's happening.
At the end I'm gratefull to you because this series of posts showed me a good point about chaining load balancers (haproxy + ipvs).
Big hugs @vide.
tmarti
on 23 Apr 2018
This is one of the best threads, ever.
Thanks for taking the extra time to analyze.
 cpuguy83
on 26 Apr 2018
cpuguy83
on 26 Apr 2018
@tmarti would it be possible for you to summarize this thread in the form of a recommendation? For example something like: "_if you use the default ipvs swarm load-balancer, and put an external load-balancer in front of it, than make sure that ....... or else ..... will happen, because ......_". Or something along those lines?
That would make things way easier for people reading this thread later. (And for some reading it now...)
raarts
on 26 Apr 2018
@raarts and @tmarti a recommendations writeup would be fantastic for the rest of us who's been following this thread (but unable to grasp all the details and implications of it).
On thing that strikes me though : does anyone really expose their swarm directly onto the internet? Wouldn't most setups involve a proxy of some sort?
sbrattla
on 26 Apr 2018
I do. I run a Swarm that is mostly on-premise, but some nodes are in public cloud, connected through a Zerotier VPN (which I love by the way). Three of them expose only two ports: 80/443 (going into Traefik proxies in network host mode). They are loadbalanced by DNS round-robin.
raarts
on 26 Apr 2018
@tmarti Very nice analysis. Definitely provides some great insight and thoughts to consider for future architectures as well.
ctelfer
on 26 Apr 2018
@tmarti Execellent analysis and insight. I just encountered this issue recently. Thank you to help me find the reason why my load testing on docker swarm always get stuck.
 liviaerxin
on 27 Apr 2018
liviaerxin
on 27 Apr 2018
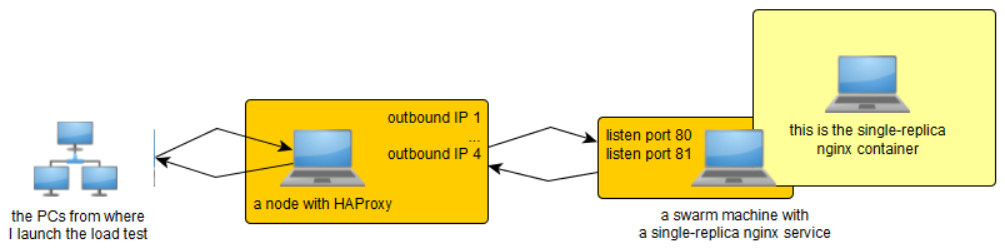
Did a first test with HAProxy in front of swarm.
Tested injecting load with ab and siege from different other nodes.
On the swarm service, mapped both ports 90 and 81 to port 80 of the nginx contanier.
And on the HAProxy node assigned 4 IP addresses to the network device.
Then, in the HAProxy backend definition, added 8 servers pointing to the same swarm machine IP, but with combinations of:
- targeting port 80 and 81
- setting either of the HAProxy's 4 IPs as source IP address
So that gave me a total of 8 server combinations in the backend definiton.
The good point is that each of those servers implies a different pair of source IP+dest port on the TCP communication between the HAProxy and swarm/IPVs.
So in the swarm machine this should suppose allowing as much as a total of 28k (ephemeral port range in the HAProxy machine) * 8 connections.
The HAProxy frontend listens to 0.0.0.0, we will later see why.
Also, some tuning on the HAProxy machine: increase max number of open file descriptors, increase ephemeral port range, increase max number of TCP connections in TIME_WAIT state, increase max netfilter_conntrack concurrent connections, and some extra tuning on the HAProxy config file (mainly to increase max connection number).
And then launched the load tests.
Increasing ephemeral port range on the load generator machines and launching 30k requests from 3 other nodes (256 concurrent connections from each node) to the SAME IP of the HAProxy machine (remember it has 4 IPs and listens to 0.0.0.0), I observe that the docker machine raise to between 70% and 80% CPU and an aggregated throughput of between 1700 and 2000 req/s, which is satisfactory.
But the annoying thing is that if I launch the test again from the 3 load generators, now pointing to ANOTHER of the IP addresses of the HAProxy machine (but all 3 to the SAME IP), although I observe a troughput now of about between 1000 and 1300 req/s, as much as about 9% of the requests do not receive a response.
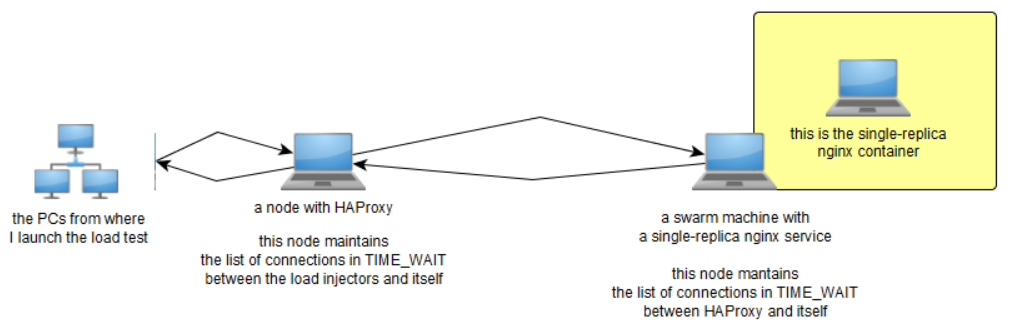
One of the most annoying things that happen is that it seems that:
the HAProxy node holds TIME_WAIT connections between load injector and HAProxy nodes
the swarm node holds TIME_WAIT connections between HAProxy and swarm nodes
Due to 1, the second round of load is injected to a different IP from the HAProxy node (the clients have no way to know if they recycle an ephemeral port for the same destination, it will (or not) already be in TIME_WAIT state on the HAProxy node and hence rejected/discarded).
Due to 2 (and I suspect this is the problem), similarly to 1, the HAProxy node has no way to know which ports it should recycle, and I think the problem actually comes from here: for a given pair of source IP (out of the 4 IPs of HAProxy node) and destination port (redirected ports 80 and 81 on the swarm service), the HAProxy node has no way to know that a concrete ephemeral port does not have to be reused during the TIME_WAIT timeout on the docker machine (hardcoded to 120s on IPVS).
If only HAProxy could be force to also close the socket, it would enter in TIME_WAIT state too, preventing that ephemeral port to be reused during the timeout. BUT THEN another problem would surface: TIME_WAIT timeout in docker machine is hardcoded by IPVS to 120s, and it seems that the TIME_WAIT timeout on the HAProxy machine is set (Ubuntu Server 16.04, seen no way to change it) to 60s.
By the moment you see, a relatively easy setup that bringa another question :-).
tmarti
on 27 Apr 2018
Well, did a new test, so prepare a bowl of popcorn and join this new comment.
Where we left on last comment
I prepared a small setup involving the following:
The idea behind all those 4 outbound IP addresses on the HAProxy node and listening to ports 80 and 81 (redirected to port 80 of the nginx container) on the swarm node was to add diversity in order to increase the number of ephemeral ports that could be used from the HAProxy node and hence increase the number of concurrent connections.
As I noticed today, the idea of assigning more outbound IPs to the HAProxy is good. This acts a multlplier for the number of available connections.
But not the idea to listen to serveral TCP ports and redirect them. The reason is when connection from the HAProxy node to the swarm node (during balancing), if an emphemeral port for a given IP is already taken, it will not be taken agin while in use (either TIME_WAIT or not). Although a connection is identified by sourceIP+sourcePort+destIP+destPort, from the same IP you cannot reuse the same ephemeral port although it's pointing to some other destionation.
The final point from the previous comment was based on this observation:
And following facts:
- on the HAProxy node, TIME_WAIT timeout is set to 60s (it's harcoded on kernel source file
include/net/tcp.h, search there for#define TCP_TIMEWAIT_LEN) - on the swarm node, IPVS module sets TIME_WAIT timeout to 120s (harcoded at compile time)
The idea was that as the HAProxy node was no way to know that it has already used a given ephemeral port for TCP connection establishment between itself and the swarm node, it could potentially reuse ephemeral ports, beeing that the root of the disaster.
Let's elaborate from here.
First test: let's see what happens when we reuse an ephemeral port
Thanks curl for existing, because this will be the tool for this test.
For this first test, we just need the docker node and the HAProxy node.
We will have a total of 3 terminals open (ideally all of them visible on the screen).
Preparation on the docker node:
docker service create --name nginx --replicas 1 -p 80:80 nginx
Now execute the following at the 1st on-screen terminal on the docker node (there is a reason for that 0.1) and execute:
watch -n 0.1 sudo nsenter --net=/var/run/docker/netns/ingress_sbox cat /proc/net/ip_vs_conn
Preparation on the HAProxy node: just have curl installed.
Now, open the 2nd on-screen terminal to the HAProxy node and execute:
watch -n 0.1 "netstat -noal|grep TIME_WAIT"
Now, open the 3rd on-screen terminal to the HAProxy node and execute:
time curl --interface [some outbound IP of the HAProxy node] --local-port 61235 http://[the swarm node IP]
And that's the nice curl into action. It allows us to choose the ephemeral port to use (--local-port).
The timing for the curl command in my case tells me that:
real 0m0.015s
In the order of a few milliseconds.
From this point, you will notice:
- on 1st terminal (swarm node) you will see just one connection which starts to timeout from 120s
- on 2nd terminal (HAProxy node) you will see just ont connection which starts to timeout from 60s
Nothing new. Just wait for the 2nd terminal connection to expire (after 60s), and WHILE the connection on the swarm node is still on TIME_WAIT, launch THE SAME curl command from 3rd terminal and observe carefully.
Hold on! That ephemeral port belongs to a connection in TIME_WAIT on the swarm node. Sure! Can you imagine what will happen then? Just keep reading.
If you observe carefully the ouptut from the 1st terminal, you will notice that since the moment we launch the second curl command, the connection in TIME_WAIT will disappear for approx 1 second, and then start counting from 120 again.
Now obseve the output from the second curl command timing info. It will not be anymore on the order of a few milliseconds, but in the order of about a few milliseconds PLUS 1 extra second:
real 0m1.013s
(Second test): What the...! What just happened previously!?
Another tool enters the game: tshark. Install it on the HAProxy node.
If tshark is used to inspect what's happening between HAProxy and swarm, which can be done executing the following on the HAProxy terminal (replace [swarm node IP] with the real IP of the swarm node and '[device]' with the name of the network device (as seen in ifconfig))...
sudo tshark -l -i [device] -o "capture.prom_mode:TRUE" -Y "(ip.src == [swarm node IP] or ip.dst == [swarm node IP]) and tcp.flags.syn == 1" -T fields -e ip.src -e tcp.srcport -e ip.dst -e tcp.dstport -e tcp.flags.syn -e tcp.flags.ack -e tcp.analysis.retransmission
... previous command will capture data corresponding to the first two messages of the 3-way handshake of the TCP connection betwen HAProxy and swarm: SYN and SYN+ACK).
With tshark running, excute again the curl command (at this point we assume that TIME_WAIT connections from previous test have already expired on both HAProxy and swarm nodes).
Somthing like the following will be shown on the tshark ouput:
192.168.1.20    61235   192.168.1.11    80  1   0
192.168.1.11    80  192.168.1.20    61235   1   1
Frist two numbers are source IP+port (our HAPRoxy node IP and the ephemeral port we told curl to use).
3rd and 4th are destination IP+port (our swarm node IP and port 80).
5th is SYN flag, and 6th is ACK.
So that seems pretty good for establishing a TCP connection.
Now, wait until the connection in TIME_WAIT expires on the HAProxy node (but NOT on the swarm machine) and execute curl again. Please also keep monitoring 1st terminal open at swarm node with the nsenter command.
Following will be shown on tshark output:
192.168.1.20    61235   192.168.1.11    80  1   0
(here a delay of 1s will happen)
192.168.1.20    61235   192.168.1.11    80  1   0   1
192.168.1.11    80  192.168.1.20    61235   1   1
Wow! It seems that the SYN message from the HAProxy node to the swarm node is sent twice. And btw, what is this new 7th number 1 in tshark output? (spolier: that 7th number 1 is the _retransmit_ flag).
This is what happens:
- when HAProxy node tries to establish a connection to the swarm node (sending a SYN message), and the ephemeral port chosen by HAProxy node is on TIME_WAIT on the swarm node, the connection is removed from the connection table on the swarm node (on IPVS module) (for this reason it disappears during 1 second), but it does not respond with a SYN+ACK.
- what happens now? Well, it enters into action the RTO (retransmission timeout) mechanism on the HAProxy node. It waits for 1 second and tries to send a new SYN message (this time with the retransmit flag we see in the second fragment of the
tsharkouput). - Now, on the swarm node IPVS module, as the connection was already dropped on step 1 and the slot freed, it now says
oh! this slot is free!and the connection is accepted. - The connection is fully established and the communication can continue.
And this is the reason for the dropped performance. If we now repeat the test from the previous comment with siege from the load injector node and tshark capturing on the HAProxy node, we'll see LOTS of SYN message retransmits. This means that lots of connections from the HAProxy node to the swarm node will suffer a 1-second delay, eventually leading to a performance degradation.
Right now, I think this is the ultimate cause of the degraded performance of the load test.
Wait! There's more
3 more points:
a) This kind of recycling connections in TIME-WAIT state is also known as _TIME-WAIT Assasination_:
Googling a little brings up some links talking about it, like https://blogs.technet.microsoft.com/networking/2010/08/11/how-tcp-time-wait-assassination-works/
b) Is seems that it also would be nice to lower the 1s of the RTO timeout:
See here (https://unix.stackexchange.com/questions/210367/changing-the-tcp-rto-value-in-linux) for some comments about it.
It would be nice but wait for c).
c) Ultimately, it seems that the IPVS module should support this kind of TIME-WAIT connection recycling
See following thread for a discussion that dates back to 2014 from (guess who? yes!) some mantainers of the IPVS module, and yes, about implications of these last paragraphs about TIME-WAIT Assassination and degraded performance:
http://archive.linuxvirtualserver.org/html/lvs-devel/2014-12/msg00016.html
Regarding this last point, if the take a look at the code mentioned in the last link, we end up in (IPVS code again) ip_vs_core.c source file (https://github.com/torvalds/linux/blame/master/net/netfilter/ipvs/ip_vs_core.c).
In that file, there is following piece of code (2 years since it was last touched):
/*
 * Check if the packet belongs to an existing connection entry
 */
cp = pp->conn_in_get(ipvs, af, skb, &iph);
conn_reuse_mode = sysctl_conn_reuse_mode(ipvs);
if (conn_reuse_mode && !iph.fragoffs && is_new_conn(skb, &iph) && cp) {
    bool uses_ct = false, resched = false;
    if (unlikely(sysctl_expire_nodest_conn(ipvs)) && cp->dest &&
        unlikely(!atomic_read(&cp->dest->weight))) {
        resched = true;
        uses_ct = ip_vs_conn_uses_conntrack(cp, skb);
    } else if (is_new_conn_expected(cp, conn_reuse_mode)) {
        uses_ct = ip_vs_conn_uses_conntrack(cp, skb);
        if (!atomic_read(&cp->n_control)) {
            resched = true;
        } else {
            /* Do not reschedule controlling connection
             * that uses conntrack while it is still
             * referenced by controlled connection(s).
             */
            resched = !uses_ct;
        }
    }
    if (resched) {
        if (!atomic_read(&cp->n_control))
            ip_vs_conn_expire_now(cp);
        __ip_vs_conn_put(cp);
        if (uses_ct)
            return NF_DROP;
        cp = NULL;
    }
}
As debugging the kernel was an overkiller, I just added some printk's, recompiled, replaced and rebooted, and seen that from the four conditions on the most-external if, for the case that would be a great candiate to reuse a connection in TIME_WAIT (instead of dropping it and waiting an entire RTO):
if (conn_reuse_mode && !iph.fragoffs && is_new_conn(skb, &iph) && cp)
When a new SYN is received for a connection that was in TIME_WAIT, the cp pointer is null. It's like the connection was not there previously as regarding to IPVS. Although it DOES drop the previous connection (as seen by using the nsenter command) and does not respond to the SYN message, forcing HAProxy node to wait an entire RTO in order to try to send a SYN message again (which succeeds).
And that's all for now. Hope the popcorn was tasty :-).
tmarti
on 30 Apr 2018
Thanks for this great walk-through. It looks as though the IPVS maintainers knew about this, and thought this was the best they could do.
Since both timers are hardcoded, you can't make them both the same, which might (?) improve things, but for the moment it now seems better to NOT put a load-balancer in front of a swarm when connection volumes are high and using the swarm ingress ipvs load-balancer.
I use something like this (with mode: host for the published ports for the nginx proxies):
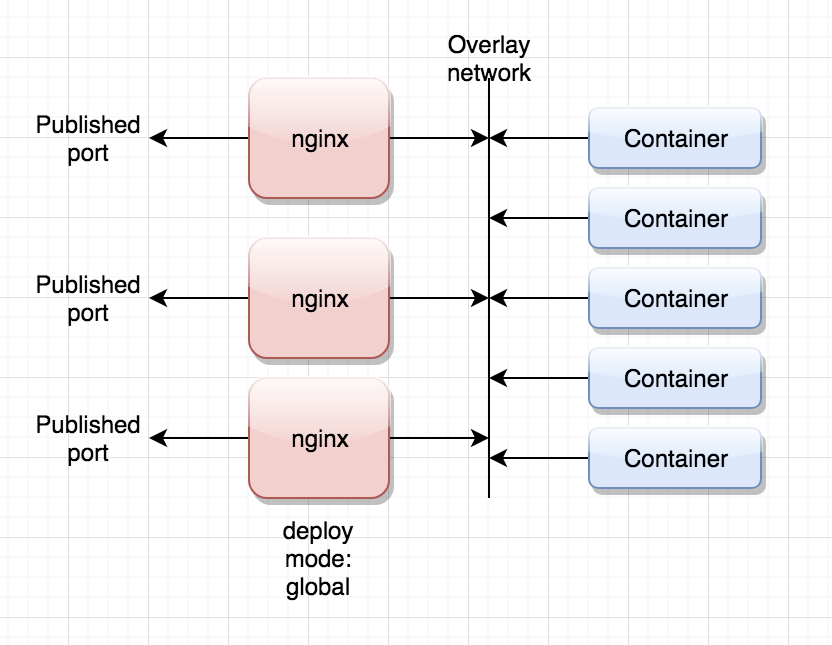
Which results in more or less the same situation, but inside the swarm itself. So I can expect the same to happen, but at least this way you can expand the number of frontend proxies/nodes, and you can front this with multiple load balancers if you want.
raarts
on 30 Apr 2018
Yes, it seems a good idea by the moment to avoid an external LB in front of swarm under high load.
What your picture shows, though, seems the same as assigning for example 32 outbound IP's to the HAProxy node. Under heavy load the same problem will happen.
Good thing is that as long as HAProxy (our the nginx proxies in you picture) are tuned to handle a high number of concurrent connections, the delay on each of those connections will be at most (as long as the balanced services absorb the load) 1 additional second for each connection (due to the RTO in the port-recycling-scenario).
So i imagine that in this case, 500req/s will be able to be served, only with a delay of 1s on each request.
But also (really) think (by looking at that maintainers' forum thread) that this situation SHOULD be well-handled by IPVS.
There is no point in the pasted _if_ if no matter how the condition is never satisfied. And that _might_ (not really sure) be the IPVS bug.
tmarti
on 30 Apr 2018
Hi,
we have a similar issue, but the problem only seems to occur with swarm-internal traffic.
But let me first describe our test-setup (bare metal):
Output of docker version:
Client:
 Version:      18.03.1-ce
 API version:  1.37
 Go version:   go1.9.5
 Git commit:   9ee9f40
 Built:        Thu Apr 26 07:20:16 2018
 OS/Arch:      linux/amd64
 Experimental: false
 Orchestrator: swarm

Server:
 Engine:
  Version:      18.03.1-ce
  API version:  1.37 (minimum version 1.12)
  Go version:   go1.9.5
  Git commit:   9ee9f40
  Built:        Thu Apr 26 07:23:58 2018
  OS/Arch:      linux/amd64
  Experimental: false
Output of docker info:
Containers: 8
 Running: 3
 Paused: 0
 Stopped: 5
Images: 21
Server Version: 18.03.1-ce
Storage Driver: devicemapper
 Pool Name: centos-thinpool
 Pool Blocksize: 524.3kB
 Base Device Size: 10.74GB
 Backing Filesystem: xfs
 Udev Sync Supported: true
 Data Space Used: 707.3MB
 Data Space Total: 24.95GB
 Data Space Available: 24.24GB
 Metadata Space Used: 794.6kB
 Metadata Space Total: 8.38GB
 Metadata Space Available: 8.379GB
 Thin Pool Minimum Free Space: 1.247GB
 Deferred Removal Enabled: false
 Deferred Deletion Enabled: false
 Deferred Deleted Device Count: 0
 Library Version: 1.02.140-RHEL7 (2017-05-03)
Logging Driver: json-file
Cgroup Driver: cgroupfs
Plugins:
 Volume: local
 Network: bridge host macvlan null overlay
 Log: awslogs fluentd gcplogs gelf journald json-file logentries splunk syslog
Swarm: active
 NodeID: 2iid0zm1nain8awsdvfw8r1e4
 Is Manager: true
 ClusterID: ufq20qvv0djznlg1bl0ked0m8
 Managers: 1
 Nodes: 1
 Orchestration:
  Task History Retention Limit: 5
 Raft:
  Snapshot Interval: 10000
  Number of Old Snapshots to Retain: 0
  Heartbeat Tick: 1
  Election Tick: 3
 Dispatcher:
  Heartbeat Period: 5 seconds
 CA Configuration:
  Expiry Duration: 3 months
  Force Rotate: 0
 Autolock Managers: false
 Root Rotation In Progress: false
 Node Address: 172.18.2.128
 Manager Addresses:
  172.18.2.128:2377
Runtimes: runc
Default Runtime: runc
Init Binary: docker-init
containerd version: 773c489c9c1b21a6d78b5c538cd395416ec50f88
runc version: 4fc53a81fb7c994640722ac585fa9ca548971871
init version: 949e6fa
Security Options:
 seccomp
  Profile: default
Kernel Version: 3.10.0-693.21.1.el7.x86_64
Operating System: CentOS Linux 7 (Core)
OSType: linux
Architecture: x86_64
CPUs: 16
Total Memory: 94.25GiB
Name: whoopwhooptest
ID: IE4X:DZ5F:3JLI:GIPF:YYCP:SLQ6:T6QP:7XYC:AZXY:Y2IG:QL6X:NXQN
Docker Root Dir: /var/lib/docker
Debug Mode (client): false
Debug Mode (server): false
Registry: https://index.docker.io/v1/
Labels:
Experimental: false
Insecure Registries:
 127.0.0.0/8
Live Restore Enabled: false
The nginx-service works as a reverseproxy to route to our different microservices by URI.
We are seeing a massive rise of response times under load. The response times range from 10 to 70ms under low load and rise to 1000 to 3000ms under "higher" load after ~14.000 requests.
The main problem is, TCP connection times are rising above 1000ms and lead to TCP connection timeouts in our production system where HAProxy is in front of the Docker Swarm.
We did some testing using jmeter to identify the issue / bottleneck.
This is what we did and found out:
Test 1
- no docker
- nginx installed via yum
- services started using java directly
1 client (10 parallel requests, 10 threads)
result
100.000 requests
- max response time: 426ms
- avg response time: 97ms
throughput: ~630 req/sec
=> no problemTest 2
nginx dockerized
- services dockerized
- no swarm
1 client (10 parallel requests, 10 threads)
result
100.000 requests
- max response time: 474ms
- avg response time: 94ms
throughput: ~670 req/sec
=> no problemTest 3
single node docker swarm
- nginx as stack service
- services as stack services
1 client (10 parallel requests, 10 threads)
result
100.000 requests
- max response time: 3099ms
- avg response time: 692ms
throughput: ~130 req/sec
=> problemTest 4
single node docker swarm
- nginx as stack service
- services as stack services
1 client (10 requests, 1 thread)
- lowered request rate in jmeter to find out the max the swarm can handle from 1 client
result
- lowered request rate in jmeter to find out the max the swarm can handle from 1 client
100.000 requests
- max response time: 388ms
- avg response time: 15ms
throughput: ~65 req/sec
=> no problemTest 5
same as Test 4 but 2 clients generating the same load (each client supplying half of the load)
result
client 1 (10 requests, 1 thread)
- 50.000 requests
- max response time: 1039ms
- avg response time: 16ms
- throughput: ~58 req/sec
- client 2 (10 requests, 1 thread)
- 50.000 requests
- max response time: 1032ms
- avg response time: 17ms
- throughput: ~58 req/sec
=> little problem
#
During all these tests, I had the following command running in our nginx and service container:
netstat -an|awk '/tcp/ {print $6}'|sort|uniq -c
Every time the response times rise to more than 1000ms, TIME_WAIT count (seen via command above) rises to about 12.000 to 13.000 in our service container. At the same time SYN_SENT count rises to about 90 to 100 in our nginx container while TIME_WAIT count is at about 15 to 25 there.
If wo do Test 5 again, but call our backend service directly (port exposed), effectively bypassing the nginx, there is no problem at all. No extreme rise in response times, no high TIME_WAIT counts.
All these tests lead to following conclusions for me:
- It doesn't matter if one, two (or more) clients generate the load (so one single client should not be a problem)
- The problem is related to swarm-internal communication only (nginx -> service), not related to communication from external client to a service within the swarm.
#
Does anyone have any hints to further debug what's going on in docker swarm's network?
Or are there any options we could try to tune the internal network?
Any help or idea would be appreciated.
xoxo
 PhilPhonic
on 8 May 2018
PhilPhonic
on 8 May 2018
Indeed looks like the same issue. Several things come to mind looking at this:
How many instances of the backend service do you run, is that really 2 as shown in the diagram?
Also, a single node swarm is basically useless, I would not use that in production especially since single node without swarm runs fine.
On the other hand, if you want to run a multi-node swarm in production, then this test is not representative at all.
So my $0.02 would be, add an extra node with an exposed nginx proxy (load-balance using DNS), see if that improves the max # of req/sec.
raarts
on 8 May 2018
First of all thanks for your reply @raarts.
Let me clarify some things:
We have a multi-node swarm in production (multiple managers, multiple workers) with HAProxy in front as loadbalancer (instead of your suggested DNS loadbalancing). All services have 2+ replicas.
We first tested on a "production-like" system with multiple nodes and HAProxy in front. Then we "minified" the setup for our tests on purpose, to leave out certain things, e.g. HAProxy, physical network, firewalls.
With our test setup we can surely say: It is neither HAProxy nor the physical network or a firewall that is causing the rise in response times under load. We could narrow it down to "virtual" docker-internal traffic this way.
This is exactly what we tried to achieve, to put our fingers onto the bleeding spot.
To get to your question about the number of instances of the backend services:
There are two different backend services in our test setup (we only use one of these in our tests). Each with replicas set to 1. We tried to scale up (2, 4, 8) both the service (we are using) and nginx wich did not change anything. We also tried this on a multi-node swarm with HAProxy in front with same behaviour.
PhilPhonic
on 9 May 2018
In my mind the actual cause of the problem being discussed here, is that _to the ipvs-based internal swarm load-balancer_ all requests are coming from the same ip address. And since it hashes on source-ip/port it easily runs out of space in the hash-table. It also explains why adding multiple ip addresses to haproxy (in the way described by @tmarti) alleviates/solves the problem.
In your test environment you are using nginx as a proxy, which again causes all requests to originate from one (nginx's internal) ip address. In your production setup you use haproxy, which has the same effect.
I would take another good look at your tests with this principle in mind.
raarts
on 9 May 2018
I understand that. I just hoped, someone had a good solution for this problem without externalizing the routing (via multiple IPs).
To recap, as I understand it the only viable solution would be:
- routing to services with nginx / HAProxy / whatever has to be done outside the swarm with multiple source IPs
- only backend services in swam
- every service has to expose its port so we can route to it from outside the swarm
- communication between services (wich generates internal load and would also lead to "port-exhaustion") has also to be done via routing outside the swam (to get multiple source IPs)
- service (in docker swarm) -> nginx with multiple IPs (outside the swarm) -> service (in docker swarm via exposed port)
Why should we use docker swarm then?
Yeah, you can scale services up and down easily and the traffic is loadbalanced internally. But what more benefits remain?
Rolling updates? Okay, this one stays great.
Automatic service discovery? Not needed anymore, cause routing to services is done via hardcoded servernames (hosts participating in swarm) and exposed ports in nginx or whatever you have in front of your docker swarm.
The overlay network is just great for services communicating directly to each other without "extra-hops" to a "router" outside the swarm, but it's useless if you can't take advantage of it due to the connection/port limit issue.
Am I missing or misunderstanding something obvious here?
How should I change our test setup to get closer to the core issue or a possible solution, without having to externalize all the routing that the internal swarm network should take care of?
PhilPhonic
on 9 May 2018
Unfortunately I also have noted that swarm network has some problem.
I tested this simple stack composed by an nginx container as frontend that forwards anything to an apache backend:
//Docker Compose for swarm mode
[root@xxxxxx-xx-01 compose]# vi stack_nginx_apache_swarm.yml
version: '3'
services:
proxy:
image: nginx
ports:
- '8991:80'
volumes:
- /gfs1/compose/nginx.conf:/etc/nginx/conf.d/default.conf:ro
web:
image: httpd
//Docker Compose for standalone mode.
[root@xxxxxx-xx-01 compose]# more stack_nginx_apache_no_swarm.yml
version: '2'
services:
proxy:
image: nginx
ports:
- '8991:80'
volumes:
- /gfs1/compose/nginx.conf:/etc/nginx/conf.d/default.conf:ro
web:
image: httpd
[root@xxxxxx-xx-01 compose]# more nginx.conf
server {
    listen 80;

    location / {

            proxy_pass         http://web;
            proxy_redirect     off;
            proxy_set_header   Host $host;
            proxy_set_header   X-Real-IP $remote_addr;
            proxy_set_header   X-Forwarded-For $proxy_add_x_forwarded_for;
            proxy_set_header   X-Forwarded-Host $server_name;

    }
}
I tested using the last offical docker version (18.03.0-ce) in a environment with 3 Swarm Managers and three Worker Nodes.
[root@xxxxxx-ce-01 compose]# docker info
Containers: 9
Running: 9
Paused: 0
Stopped: 0
Images: 135
Server Version: 18.03.0-ce
Storage Driver: devicemapper
Pool Name: docker-thinpool
[root@xxxxxxxx-xx-01 compose]# docker node ls
ID HOSTNAME STATUS AVAILABILITY MANAGER STATUS ENGINE VERSION
yno1sq95oj0lch127unmopkpw * xxxxxxxx-xx-01.xxx.xxx Ready Active Reachable 18.03.0-ce
wqi9mnu3oi8ak5tbh84r8tbjq xxxxxxxx-xx-02.xxx.xxx Ready Active Leader 18.03.0-ce
vlc6qkfk7cn1kl1zqey7xigc0 xxxxxxxx-xx-03.xxx.xxx Ready Active Reachable 18.03.0-ce
rzsbihct4m38rf1jr56kx66s2 xxxxxxxx-xx-04.xxx.xxx Ready Active 18.03.0-ce
7i4eb15nlssl29s6fh84zh4hi xxxxxxxx-xx-05.xxx.xxx Ready Active 18.03.0-ce
sgzkxlki38tbiiv42ivct61ua xxxxxxxx-xx-06.xxx.xxx Ready Active 18.03.0-ce
I created two tests scenario. The first with swarm:
[root@xxxxxxxx-xx-01 compose]# docker stack deploy --prune --compose-file ./stack_nginx_apache_swarm.yml stack-nginx-apache --with-registry-auth
[root@xxxxxxxx-xx-01 compose]# docker stack ps stack-nginx-apache
ID NAME IMAGE NODE DESIRED STATE CURRENT STATE ERROR PORTS
aqt4rt9azu0l stack-nginx-apache_proxy.1 nginx:latest xxxxxxxx-xx-06.xxx.xxx Running Running 7 minutes ago
2iys9ec8girb stack-nginx-apache_web.1 httpd:latest xxxxxxxx-xx-05.xxx.xxx Running Running 8 minutes ago
I started different tests case with ab and wrk with the following commands (10.20.102.201 is the ip address of xxxxxxxx-xx-01.xxx.xxx node):
ab -n 10000 -c 100 http://10.20.102.201:8991/
wrk -t100 -c 100 -d10 http://10.20.102.201:8991/
The same thing in standalone mode starting the containers in this way:
[[email protected] compose]# docker-compose -p stack-nginx-apache -f ./stack_nginx_apache_no_swarm.yml up -d
The following results are clear: randomly there is same thing that forces the swarm overlay network to be slow, very slow.
In standalone mode, the results are very good and stable.
SWARM
Command Time Requests per second Total Error
ab -n 10000 -c 100 http://10.20.102.201:8991/ T0 3697.60 10000 0
ab -n 10000 -c 100 http://10.20.102.201:8991/ T1 97.13 10000 0
ab -n 10000 -c 100 http://10.20.102.201:8991/ T2 351.14 10000 0
ab -n 10000 -c 100 http://10.20.102.201:8991/ T3 220.28 10000 0
wrk -t100 -c 100 -d10 http://10.20.102.201:8991/ T4 1457.25 14718 0
wrk -t100 -c 100 -d10 http://10.20.102.201:8991/ T5 97.80 988 1
wrk -t100 -c 100 -d10 http://10.20.102.201:8991/ T6 95.25 961 0
wrk -t100 -c 100 -d10 http://10.20.102.201:8991/ T7 94.35 953 0
No Swarm
ab -n 10000 -c 100 http://10.20.102.201:8991/ T0 3011.05 10000 0
ab -n 10000 -c 100 http://10.20.102.201:8991/ T1 3008.31 10000 0
ab -n 10000 -c 100 http://10.20.102.201:8991/ T2 3258.23 10000 0
ab -n 10000 -c 100 http://10.20.102.201:8991/ T3 3271.23 10000 0
wrk
wrk -t100 -c 100 -d10 http://10.20.102.201:8991/ T4 4127.54 41722 0
wrk -t100 -c 100 -d10 http://10.20.102.201:8991/ T5 3992.96 40361 0
wrk -t100 -c 100 -d10 http://10.20.102.201:8991/ T6 4136.09 41836 0
wrk -t100 -c 100 -d10 http://10.20.102.201:8991/ T7 4086.80 41286 0
No CPU or Memory issue was raised during the tests.
I made different tests pointing to different nodes of the cluster and the situation doesn't change.
In this condition it's not possible to go in Production.
 stefano-gristina
on 10 May 2018
stefano-gristina
on 10 May 2018
Did anybody try using dns-rr for internal networks? That should overcome the ipvs problems
raarts
on 10 May 2018
@raarts Just tested it.
The throughput is way better. Can be compared to _Test 2_ in my earlier post, where everything is containerized but not using swarm.
PhilPhonic
on 11 May 2018
Hi Raarts,
OK, but this is a workaround, not a solution.
If we use DNS Round Robin (DNSRR) mode, a load balancer must be configured for consuming all the ip list returned by dns service query. So means that the dynamic load balancer feature inside swarm is not used anymore and this is not good.
Stefano
stefano-gristina
on 11 May 2018
I'm not sure what you mean. When using dnsrr, for example the nginx example as given by @PhilPhonic should use the service name, and on every dns lookup would get a different ip address for the internal service to use. This is handled by swarm, so it will do dynamic load balancing.
raarts
on 11 May 2018
OK. I didn't understand how dns-rr works. Now it's clear and you are right.
Stefano
stefano-gristina
on 11 May 2018
Sorry for re-joining late to the thread (very busy at work during this and last week).
Some responses to comments
@PhilPhonic, from your Test 5:
result
client 1 (10 requests, 1 thread)
    50.000 requests
    max response time: 1039ms
    avg response time: 16ms
    throughput: ~58 req/sec
client 2 (10 requests, 1 thread)
    50.000 requests
    max response time: 1032ms
    avg response time: 17ms
    throughput: ~58 req/sec
Please note that prettly surely...
max response time: 1032ms
... this "about 1s" time obeys to the RTO mechanism when from the IPVS module a sIP:sPort+dIP:dPort is reused, as explained in a previous comment (will come back to this).
Not sure about the "about 3s" on Test 3 (maybe due to chaining RTOs betwen test node <=> nginx <=> worker).
@raarts:
In my mind the actual cause of the problem being discussed here, is that to the ipvs-based internal swarm load-balancer all requests are coming from the same ip address. And since it hashes on source-ip/port it easily runs out of space in the hash-table. It also explains why adding multiple ip addresses to haproxy (in the way described by @tmarti) alleviates/solves the problem.
exactly that!
With the detail that: even more than _hashing by_, the TCP connection is _fully identified_ by its sIP:sPort+dIP:dPort.
Let's quickly recap
First let's recap what happens from the IPVS side when a TCP connection is initiated from the LB. (corresponds to SYN message sent from the load balancer)
IPVS asks "is this sIP:sPort dIP:dPort tuple is already in use and in TIME_WAIT state?"
a. If no, this means that the LB is requesting a new connection, so accept it. So far so good.
b. If yes, this means that they're trying to reuse a connection
b.1 IPVS discards the SYN message (it's coded this way) and cleans up that connection slot (interesting)
b.2 The LB does not receive an ACK for the SYN message, so it retries the SYN after RTO (request time out), which 1s in this case (and I've not seen a way to adjust it)
b.3 IPVS receives the retransmitted SYN message but this time, as the slot was freed in b.1, there is no already existing connection for the same tuple, so it accepts the connection
b.4 So far so good but with an RTO delay
We'll also come back to here (at the end of the comment).
And the new test
Looking at sysctl'ed parameters for the IPVS module, I landed here: https://www.kernel.org/doc/Documentation/networking/ipvs-sysctl.txt
Specially interesting is this parameter:
conn_reuse_mode - INTEGER
    1 - default

    Controls how ipvs will deal with connections that are detected
    port reuse. It is a bitmap, with the values being:

    0: disable any special handling on port reuse. The new
    connection will be delivered to the same real server that was
    servicing the previous connection. This will effectively
    disable expire_nodest_conn.

    bit 1: enable rescheduling of new connections when it is safe.
    That is, whenever expire_nodest_conn and for TCP sockets, when
    the connection is in TIME_WAIT state (which is only possible if
    you use NAT mode).

    bit 2: it is bit 1 plus, for TCP connections, when connections
    are in FIN_WAIT state, as this is the last state seen by load
    balancer in Direct Routing mode. This bit helps on adding new
    real servers to a very busy cluster.
1 is the default value. Note that it says _enable rescheduling when it's safe_. Not sure about what _rescheduling_ and _safe_, but it seems that this perameter value leads to make this RTO thing happen.
Testing with value 2 or 3 (it's a bitmap) leads to same result.
So... happy idea, let's try with a value = 0. According to tests, what happens now (with value=0) when LB sends a TCP SYN message is:
IPVS asks "is this sIP:sPort dIP:dPort tuple is already in use and in TIME_WAIT state?"
a. If no, this means that the LB is requesting a new connection, so accept it. So far so good.
b. If yes, this means that they're trying to reuse a connection
b.1 IPVS accepts the connection
WOW! So no more RTO delay due to discarded SYN message on IPVS side when reusing a connection!?
If you now repeat the load tests (all variations of them) when using IPVS to balance between containers, results will be really good.
The drawback on the last test
Well yes, no more RTO but... what's the tradeoff for that? Let's re-read the sysctl parameter value...
    0: disable any special handling on port reuse. The new
    connection will be delivered to the same real server that was
    servicing the previous connection. This will effectively
    disable expire_nodest_conn.
Let's repeat:
        The new connection will be delivered to the same real server that was
    servicing the previous connection
So here we have the tradeoff, if we set that value to 0, no more RTO timeout will happen between the LB and swarm/IPVS and the throughput (served req/s) of our load tests will be sky-high always, BUT when a connection is reused, IPVS will send the new request TO THE SAME internal server where the last request corresponding to that connection was sent.
An ugly tradeoff, indeed.
Coming back to the _Let's quickly recap_ section
MAYBE (I insist), the fact that IPVS discards the SYN message and forces the LB to retransmit a new SYN is done on purpose so that IPVS can gracefully do some internal cleanup on the resued connection slot, maybe not and it's just done this way.
One thing that could be done is to ask the IPVS mantainers if that thing (discard SYN message and hence force retransmit) can be workardouned/improved in some way (without the tradeoff that implied setting that sysctl = 0)...
tmarti
on 11 May 2018
@tmarti The conn_reuse sysctl could be the solution to the problem we have here. It's a swarm of identical nodes so a connection S_IP:S_PORT:D_IP:D_PORT, for a fixed value of D_PORT (which identifies a single kind of server/service) should not be a problem, IMO.
What do you think?
Anyway https://github.com/moby/libentitlement/issues/35 is still open so from what I can understand there's no easy way to set that sysctl in Swarm Mode. How did you tune swarm IPVS for the test?
vide
on 11 May 2018
@vide:
Regarding the first point
If you take a look at [http://kb.linuxvirtualserver.org/wiki/IPVS], IPVS has many built-in balancing mechanisms.
Using that sysctl setting would break if the balancing was done according 'Least-Connection Scheduling' balancing algorithm (didn't to any test on that, so I underline the if part). That would be desirable e.g. when the workers show high variance in request dispatch times.
Also, regarding basic load balancing with round robin (the default swarm/IPVS setup) not sure on how that would behave when up/downscaling the swarm service:
Maybe under high load (where port reuse would happen) the connection could be sent to an extinct service node in case of downscaling.
Also, maybe under high load, a new node corresponding to an upscaled service could not receive any request
Some tests should be done with those use cases in mind.
Regarding the second question
In order to do the tests with sysctl'ed values I just used the sudo nsenter ... sysctl -w xxx=yyy trick.
Not sure if that would be the way to act on a production system, but something as simple as a script on /etc/init.d after the swarm ingress network has initialized could do the trick.
tmarti
on 11 May 2018
Also, regarding basic load balancing with round robin (the default swarm/IPVS setup) not sure on how that would behave when up/downscaling the swarm service
It would require application support in the proxy, or whoever sends a request: it has to make a dns lookup before initiating every single connection. Docker should handle the dns-rr properly, as soon as a container goes down, docker will stop including that node's ip address in dns-answers.
raarts
on 11 May 2018
This will resulting in hammering docker with dns requests though. I've never done or seen any tests that specifically test for this.
raarts
on 11 May 2018
Sorry @raarts, I think this comment of me was unfortunate:
Also, regarding basic load balancing with round robin (the default swarm/IPVS setup) not sure on how that would behave when up/downscaling the swarm service
I'm afraid I didn't explain well.
I was not referring to DNS round robin (as I think you refer to) as explained on https://docs.docker.com/network/overlay/#customize-the-default-ingress-network (search there for _Bypass the routing mesh for a swarm service_).
But on the round robin internally done by default by IPVS. Not to be confused with DNS-RR.
_Side Note: I understand this DNS-RR configuration would have to be done on the LB part by setting the destination as the service name instead of IP and also settwing swarm as the main DNS resolver from the LB point of view._
What I meant instead was that setting nsenter ... sysctl -w conn_reuse_mode=0 on the swarm node would have the bad effect of making IPVS "remember" to which service node it had previously balanced that reused port (in case of high throughput and therefore IPVS doing connection recycling).
The point was that when downscaling it could be possible (_could_, but that would need to be tested) that IPVS was "remembering" a balancing destination that now wouldn't exist (because the service was downscaled and hence one or more of the "remembered" destination nodes would have been destroyed).
tmarti
on 11 May 2018
An update.
I repeat my scenario. A stack deployed in swarm with nginx that forwards all to apache web server.
This is my Test:
wrk -t100 -c 100 -d10 http://10.20.102.201:8991/
100 Threads with a connection for Thread for 10 seconds.
The first time the result are ok:
[root@gfs-01 ~]# wrk -t150 -c 150 -d10 http://10.32.202.200:8991
Running 10s test @ http://10.32.202.200:8991
150 threads and 150 connections
Thread Stats Avg Stdev Max +/- Stdev
Latency 227.72ms 305.75ms 1.08s 82.00%
Req/Sec 20.52 12.11 60.00 76.00%
14874 requests in 10.10s, 4.07MB read
Requests/sec: 1473.18
Transfer/sec: 412.85KB
After this test I noted that the track table on nginx has reached this value:
nsenter --net=/var/run/docker/netns/c265f1756f32 cat /proc/net/nf_conntrack| grep "dport=80"| wc -l
13907
The entries are like that:
ipv4 2 tcp 6 117 TIME_WAIT src=10.0.14.15 dst=10.0.14.10 sport=56298 dport=80 src=10.0.14.11 dst=10.0.14.15 sport=80 dport=56298 [ASSURED] mark=0 zone=0 use=2
10.0.14.15 is the ip address of nginx.
10.0.14.10 is the ip address of web service.
whatever it is the test I cannot I can not overcome the value of 14000 about.
I known that the my standard kernel settings is:
net.ipv4.ip_local_port_range = 32768 60999
(60999-32768)/2 = 14415 (near 14.000).
It seems that the tcp source range port are all used (I dont't understand why the limit is half of all ports available) even if I don't see it with netstat -an inside the containers.
After the RTO (120 seconds) all the entries on conntrack are expired and I can test again with success.
Regards
stefano-gristina
on 11 May 2018
I confirm what tmarti said.
I tested forcing net.ipv4.vs.conn_reuse_mode to 0 by this command (1a56413db43d is the container network namespace) and everything is ok.
nsenter --net=/var/run/docker/netns/1a56413db43d sysctl -w net.ipv4.vs.conn_reuse_mode=0
Before 2015 the ipvs default behaviour was to force to reuse the time wait connections; infact read this http://lists.openwall.net/netdev/2015/03/02/9.
Without swarm if we use as virtual service an external load balancer with ip:port, the system operating permit to reuse again the connection tracked in time-wait from container to external load balancer. This explains the correct behaviour of docker without swarm.
With swarm, there is ipvs and If we configure it to reuse the time wait connections, we have the same behaviour to have docker without swarm.
Stefano Gristina
stefano-gristina
on 12 May 2018
So it seems, this fixes the connection problems, except for the fact that if you have a high load, and you scale the service up, the added containers will not get any connections routed to them, until the load drops again.
raarts
on 12 May 2018
And for the same reason (should be testd though), if you scale the service down or containers are relocated, connections will be routed to unexisting destinations also, until the load drops.
tmarti
on 12 May 2018
Right! Didn't think of that (although scaling down in high-load scenario would be unlikely).
raarts
on 12 May 2018
HI Raarts,
You are right. I didn't think about scale up and down.
During scaling up under stressed situation, the new containers receive few connections.
During scaling down, time out happen.
I tested both scenarios.
Maybe, this solution is not good.
Regards
Stefano
stefano-gristina
on 13 May 2018
It all depends on the use-case and practicality of course, but possible solutions could be:
- allocating multiple proxies and/or multiple ip addresses per proxy
- using multiple internal swarm networks and distributing your backends among those
- let the client reuse existing connections, and pipeline their requests
or a combination of the above.
raarts
on 13 May 2018
So, today I did search and research through all IPVS sysctl parameters, and seems that none of them is able to offer a solution to this problem we have here.
Even, there is a sysctl parameter that disables connection tracking only at IPVS level, but disabling it (although looking at IPVS code should improve that re-scheduling mechanism involving re-send of SYN messages and thus avoiding the RTO=1s) produces the effect of not receiving any response from the balanced service (it was a quick test, and I don't really know if it's because iptables rules got broken or what else).
So, we have a scenario produced by mismathing TIME_WAIT timeouts (IPVS / TCP stack on the kernel) not tunable together with rescheduling (produced by IPVS) involving an RTO timeout (on the LB) that is also not tunable.
Did try also tampering a bit (a real silly test) with the IPVS code to "improve" rescheduling (without dropping the first SYN message in case of port recycling), but that only led to strange behaviour on the TCP connection state (and some connections not reaching destination).
The impossibility to tune neither TCP timeouts nor RTO timeout seems to leave this problem in a cul-de-sac.
So... what do you think about this? Let's ask on the kernel mailing list?
tmarti
on 14 May 2018
Yes. The linux-kernel mailing list FAQ mentions [email protected].
raarts
on 14 May 2018
There is another way to solve the problem if we use nginx/haproxy in front of backend service (which in swarm).
I add multi port to the backend service when it only one port before. Config the nginx use multi upstream server with same dst ip (different port). It will resolve the IPVS consume all the hash (src ip+src port+dst ip+dst port).
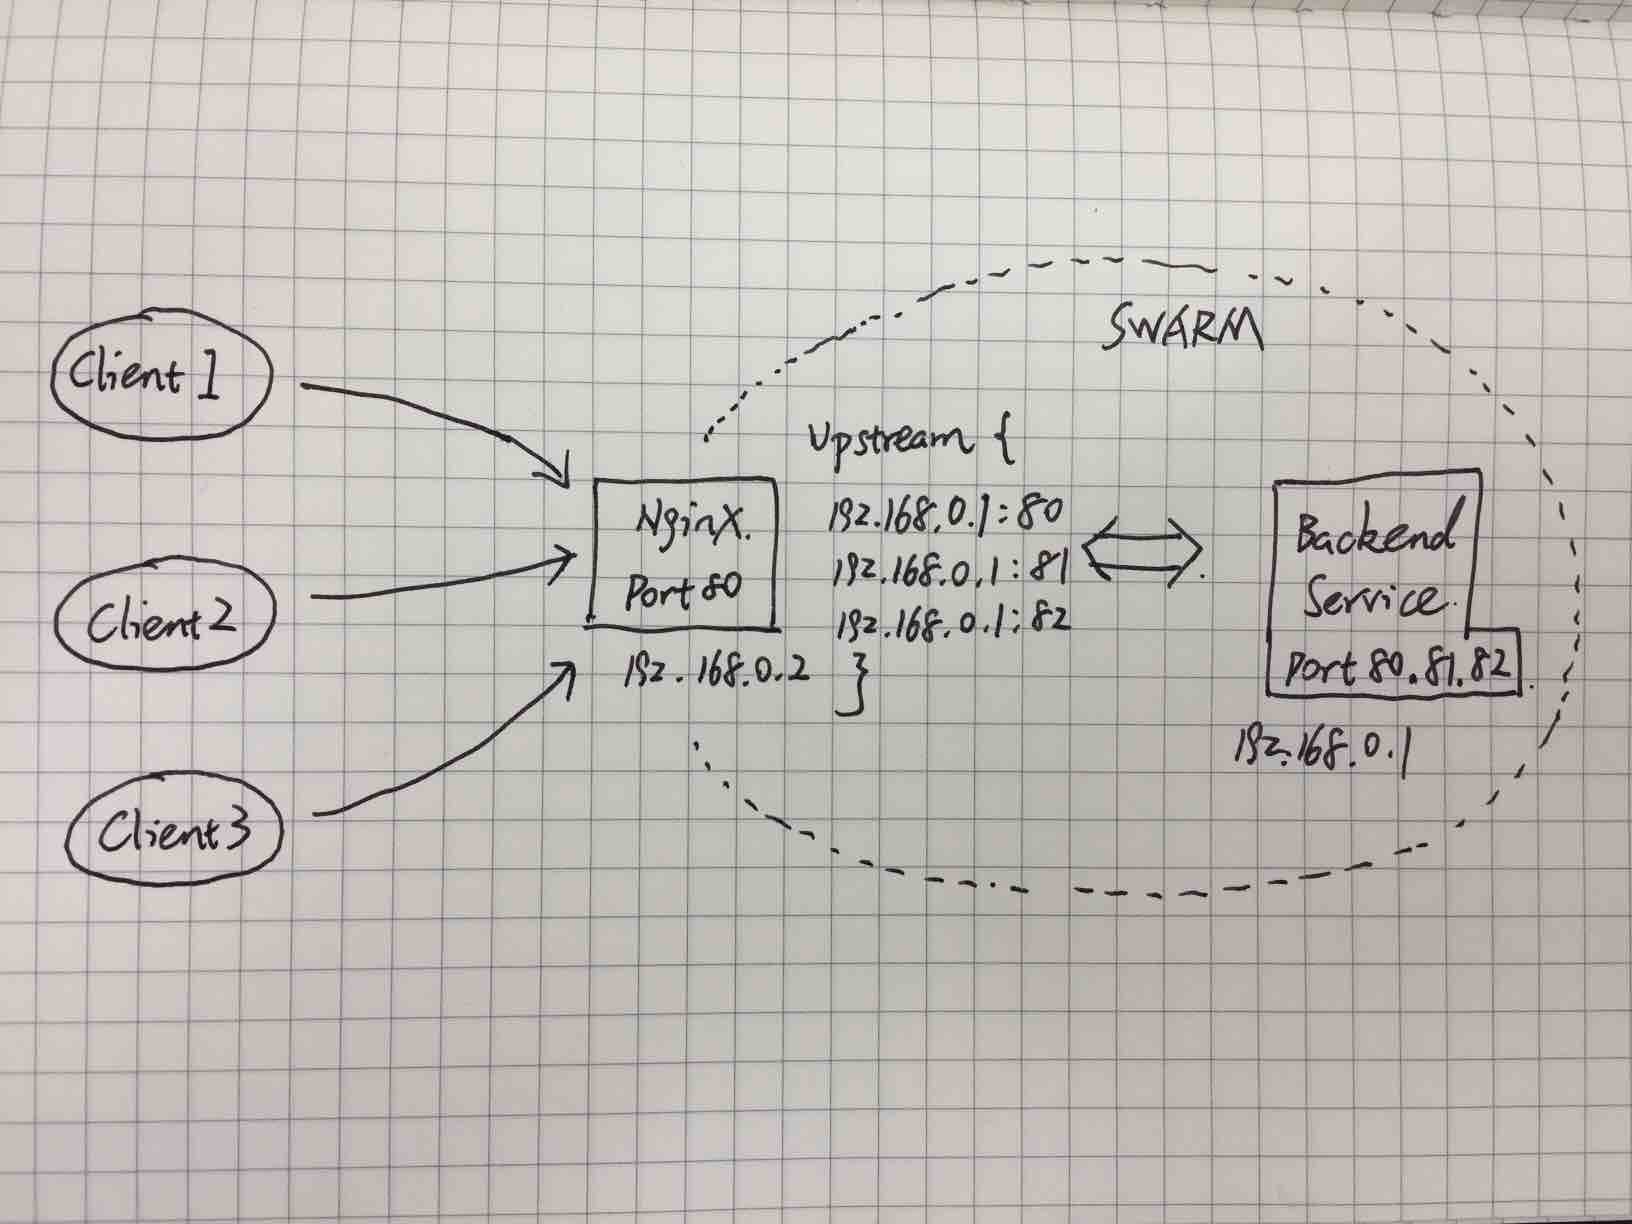
 bekars
on 15 May 2018
bekars
on 15 May 2018
@Bekars: This is not a solution, but only a way to mitigate the problem. The problem is still present.
But I found something that goes against our thinking.
Let's suppose to be inside a docker container of a swarm service and try to call a swarm service (in this case the service is called web) managed by ipvs using nc setting the source port.
bash-4.4# nc -p 12346 web 80
The connection is populated in the ipv table with RTO to 120 seconds.
nsenter --net=/var/run/docker/netns/5f29d55af8b1 ipvsadm -Lc
IPVS connection entries
pro expire state source virtual destination
TCP 01:58 TIME_WAIT xxxxx:12346 10.0.5.4:80 10.0.5.3:80
10.0.5.4 is the swarm service ip. 10.0.5.3 is the back end container.
If I try immediately to call again the service via nc using the same source port, it works and the ipv table is updated correctly again:
nsenter --net=/var/run/docker/netns/5f29d55af8b1 ipvsadm -Lc
IPVS connection entries
pro expire state source virtual destination
TCP 01:58 TIME_WAIT xxxxx:12346 10.0.5.4:80 10.0.5.3:80
This is working with reuse parameter to 1:
nsenter --net=/var/run/docker/netns/5f29d55af8b1 sysctl net.ipv4.vs.conn_reuse_mode
net.ipv4.vs.conn_reuse_mode = 1
So it means that ipvs table seems to work fine, and not bad as we said above.
Now I'm confused.
Stefano
stefano-gristina
on 15 May 2018
@stefano-gristina:
The connection is populated in the ipv table with RTO to 120 seconds.
This is not the RTO, this is the TIME_WAIT timeout.
The problem with net.ipv4.vs.conn_reuse_mode = 1 is not that the connection does not get properly managed, but that IPVS will detect a recycled connection in TIME_WAIT state, and:
- IPVS will discard the first SYN message, forcing a retransmit. Also, when discarding the message, will cleanup that connection slot (this is what IPVS calls "rescheduling" the connection).
- the client will not receive ACK for that first SYN, and will wait for RTO (this is how TCP works) before sending another SYN message with "retransmit" flag on
- IPVS will receive the retransmitted SYN message, and now it will accept it and properly manage it. Nothing to do with the "retransmit" flag set, but with the fact that on step 1 it did clean up the connection slot.
So the balancing actually works well, but the connection will get a delay of 1s (corresponding to the RTO on the client-side, either the client be a LB or in your case the nc command).
If setting net.ipv4.vs.conn_reuse_mode = 0, IPVS on previous step 1 will immediately accept the connection (not forcing the client to retransmit the SYN message), but "remembering" the last balanced server to where it sent the previous connection using the same sourceIP:sourcePort (if that connection was in TIME_WAIT state).
tmarti
on 15 May 2018
OK. Clear now. Thanks.
stefano-gristina
on 15 May 2018
Hi All,
Another this to clarify. In cannot by tcpdump get this double SYN retrasmitted.
I made two http request with nc and I see two only SYN, one for request.
Test:
1 Test:
nc -p 12350 web 80
Here the two SYN.
nsenter --net=/var/run/docker/netns/5f29d55af8b1 tcpdump -i any 'tcp[13] == 2' and port 80
14:58:09.649370 IP xxxxx.12350 > 10.0.5.3.80: Flags [S], seq 3586439937, win 28200, options [mss 1410,sackOK,TS val 2405654980 ecr 0,nop,wscale 7], length 0
14:58:18.537338 IP xxxxx12350 > 10.0.5.3.80: Flags [S], seq 3725301373, win 28200, options [mss 1410,sackOK,TS val 2405663868 ecr 0,nop,wscale 7], length 0
Why I see one only SYN for every request even if the connection is present in ipvs table after every request. (I tried also with ipvs in standalone mode, running in a centos vm without docker and I don't see this double SYN).
After every request, I see an entry in ipvs table:
nsenter --net=/var/run/docker/netns/5f29d55af8b1 ipvsadm -Lc
IPVS connection entries
pro expire state source virtual destination
TCP 01:42 TIME_WAIT xxxxx:12350 10.0.5.4:80 10.0.5.3:80
Stefano
stefano-gristina
on 15 May 2018
@stefano-gristina :
Can you try two things?
- Instead of:
nc -p 12350 pdfgenerator 80
Run:
time nc -p 12350 pdfgenerator 80
And look at the time spent from the command (both for 1st time and 2nd time).
This will tell how much time the request takes (it should be a few ms for the 1st and 1s + a few ms for the 2nd) to get a response.
- Run
tcpdumpnot on the docker machnine but on the machine from where you executencand (in case they're the same machine) withoutnsenter.
The 2nd SYN meassage initiated by nc does not even enter the docker internal network, but it does the 3rd SYN (the one with retransmit flag). As IPVS is creating a new internal connection, when the 3rd SYN enters the internal network, this SYN behaves like a new connection message, thus not having retransmit flag.
Please tell us the results of the two tests :)
tmarti
on 15 May 2018
Hi,
I tested 3 times consecutives (I changed the service name to web).
time echo -n "GET / HTTP/1.0\r\n\r\n" | nc -p 12351 web 80
real 0m 0.00s
user 0m 0.00s
sys 0m 0.00s
HTTP/1.1 400
Transfer-Encoding: chunked
Date: Tue, 15 May 2018 13:41:45 GMT
Connection: close
0
/ # time echo -n "GET / HTTP/1.0\r\n\r\n" | nc -p 12351 web 80
real 0m 0.00s
user 0m 0.00s
sys 0m 0.00s
HTTP/1.1 400
Transfer-Encoding: chunked
Date: Tue, 15 May 2018 13:41:53 GMT
Connection: close
0
/ # time echo -n "GET / HTTP/1.0\r\n\r\n" | nc -p 12351 web 80
real 0m 0.00s
user 0m 0.00s
sys 0m 0.00s
HTTP/1.1 400
Transfer-Encoding: chunked
Date: Tue, 15 May 2018 13:41:56 GMT
Connection: close
nsenter --net=/var/run/docker/netns/5f29d55af8b1 ipvsadm -Lc
IPVS connection entries
pro expire state source virtual destination
TCP 01:42 TIME_WAIT XXXXX:12351 10.0.5.4:80 10.0.5.3:80
Only 3 SYN seen (tcpdump inside nsenter, on the host where container is running there is no output)
15:41:45.485860 IP XXXXX.12351 > 10.0.5.3.80: Flags [S], seq 849350615, win 28200, options [mss 1410,sackOK,TS val 2408270816 ecr 0,nop,wscale 7], length 0
15:41:53.137355 IP XXXXX.12351 > 10.0.5.3.80: Flags [S], seq 953253130, win 28200, options [mss 1410,sackOK,TS val 2408278468 ecr 0,nop,wscale 7], length 0
15:41:56.577349 IP XXXXX.12351 > 10.0.5.3.80: Flags [S], seq 1006985960, win 28200, options [mss 1410,sackOK,TS val 2408281908 ecr 0,nop,wscale 7], length 0
Stefano
stefano-gristina
on 15 May 2018
Let's see:
- You must capture the SYN messages _outside_ the internal network (_without nsenter_). Be either on the swarm node or the node from where you launch the GET
- Make sure that you run your container as a docker swarm service instead of standalone container (else IPVS will not even be used)
- Try to use
time curl --local-port 12351 webinstead oftime echo -n "GET / HTTP/1.0\r\n\r\n" | nc -p 12351 web 80(the latter is indeed broken, you should usetime (echo "GET /" | nc -p 12351 web 80))
tmarti
on 15 May 2018
Hi
I made as you said but I cannot reproduce the issue because the curl or the nc executed as above takes the tcp connection in time_wait state and so at second attempt I get port already in use (normal behaviour)
/ # time curl --local-port 12359 web
real 0m 0.00s
user 0m 0.00s
sys 0m 0.00s
/ # time curl --local-port 12359 web
curl: (45) bind failed with errno 98: Address in use
Command exited with non-zero status 45
real 0m 0.00s
user 0m 0.00s
sys 0m 0.00s
/ # netstat -an |grep 12359
tcp 0 0 10.0.5.10:12359 10.0.5.4:80 TIME_WAIT
Stefano
stefano-gristina
on 15 May 2018
Now you're on the right track.
On the machine where you execute curlor (the proper) nc the connection will remain in TIME_WAIT for 60s.
On the swarm machine, IPVS will keep the connection in TIME_WAIT for 120s.
It's after those 60s and before those 120s that if you send another request using the same local port you will see the two SYNs (the first discarded and the second retransmitted) between nc/curland IPVS.
EDIT:
Instead of netstat -an execute netstat -ano, and even better => watch -n 0.1 "netstat -ano".
The -o flag will show you remaining expiration time for the connections in TIME_WAIT.
tmarti
on 15 May 2018
OK. You are right
First GET:
time curl --local-port 12361 web
real 0m 0.01s
user 0m 0.00s
sys 0m 0.00s
Entry created on ipvs table:
nsenter --net=/var/run/docker/netns/5f29d55af8b1 ipvsadm -Lc
IPVS connection entries
pro expire state source virtual destination
TCP 01:37 TIME_WAIT xxxxx:12361 10.0.5.4:80 10.0.5.3:80
I wait that the tcp time wait connection (60 seconds) ends:
netstat -an|grep TIME_WAIT
tcp 0 0 10.0.5.10:12361 10.0.5.4:80 TIME_WAIT
netstat -an|grep TIME_WAIT
OK. Now The entry is still present in ipvs: but anymore in tcp connection table.
nsenter --net=/var/run/docker/netns/5f29d55af8b1 ipvsadm -Lc
IPVS connection entries
pro expire state source virtual destination
TCP 00:26 TIME_WAIT xxxx:12361 10.0.5.4:80 10.0.5.3:80
I can retry.
time curl --local-port 12361 web
real 0m 1.01s
user 0m 0.00s
sys 0m 0.00s
The time for completed the GET is more than 1 second: RTO SYN RETRASMIT.
I cannot see the two SYN by tcpdump but at this point doesn't matter.
Now I can try to help with more issue awareness.
Stefano
stefano-gristina
on 16 May 2018
Hi Tmarti,
The source of issue is born with this change http://archive.linuxvirtualserver.org/html/lvs-devel/2015-10/msg00067.html.
As you said, we should ask on the kernel mailing list about it.
Who will do it?
Best Regards
Stefano
stefano-gristina
on 16 May 2018
Thanks for the link @stefano-gristina, it'll be a very nice reference when mailing to the list.
As @raarts suggsted some weeks ago, yesterday I just subscribed to the list, and today I'll try to formulate the problem in the proper way and send an email there.
tmarti
on 17 May 2018
Thanks @tmarti and all the others for your efforts with this issue!
vide
on 17 May 2018
@tmarti I'm following this thread with great interest; so out of curiosity I'd just like to ask if you've had luck getting in touch with someone via the LVS development mailing list?
sbrattla
on 23 May 2018
Well, went to LVS (Linux Virtual Server, the project that holds IPVS) mailing list and asked there.
Thanks to Sergey Urbanovich and Julian Anastasov for responding so fast pointing to the right direction.
They provided 3 links with the same exact case being reported before:
- http://lists.graemef.net/pipermail/lvs-users/2018-January/050545.html
- http://lists.graemef.net/pipermail/lvs-users/2018-January/050548.html
- https://marc.info/?t=151683118100004&r=1&w=2
I will briefly outline their summarized responses' proposed solutions and comment on them:
Basicly, you have 3 options:
Option 1
- echo 0 > conn_reuse_mode: do not attempt to reschedule on
port reuse (new SYN hits unexpired conn), just use the same real
server. This can be bad, we do not select alive server if the
server used by old connection is not available anymore (weight=0
or removed).
Already tried that and commented the results on this thread, newly added replicas will not receive traffic under high throughput (and hence connection reuse detected by IPVS), and removed replicas might continue to receive traffic.
Next two options are if you do not want to
use the first option:
Option 2
- echo 0 > conntrack: if you do not use rules to match
conntrack state for the IPVS packets. This is slowest,
conntracks are created and destroyed for every packet.
I also tried this one one week ago, but it had the bad effect of TCP connections not being able to be established between "outside IPVS(either a LB or whatever)" and "swarm replicas balanced by IPVS".
I think this happens because the iptablesrules that swarm sets up need connection tracking.
Then we have:
iptablesrules defined by swarm require connection trackingIPVShas conenection tracking disabled
As expected, there is a mismatch and this scenario does not work.
Option 3
- use NOTRACK for IPVS packets: fastest, conntracks are
not created, less memory is used
And this seems to be remaining option: modify iptables rules created by swarm so they avoid to use connection tracking.
Regarding this last option, on this URL (linked from one of the previous three) https://marc.info/?l=linux-virtual-server&m=151743061027765&w=2 Sergey gives an example of such a iptables rule:
- Use NOTRACK for IPVS connections, it should be faster
because conntracks are not created/removediptables -t raw -A PREROUTING -p tcp -d VIP --dport VPORT -j CT --notrack
For local clients use -A OUTPUT -o lo
If needed, such traffic can be matched with -m state --state UNTRACKED
So by the moment we have this new information thanks to Sergey and Julian.
Will try to do some tests tomorrow and let you know again.
tmarti
on 24 May 2018
Hi All,
I made some fast test in my laboratory where I remember I have a nginx that forwards everything to back end apache server.
I used the following command (10.20.102.201 is the external ip address where nginx is running)
wrk -t100 -c 100 -d10 http://10.20.102.201:8991/
Inside nginx container I disabled the tracking for the vip apache that is 10.0.4.10
[root@xxxx ~]#docker exec -it 3d14f311857c /bin/bash
root@3d14f311857c:/# ping web
PING web (10.0.14.10) 56(84) bytes of data.
64 bytes from 10.0.14.10 (10.0.14.10): icmp_seq=1 ttl=64 time=0.036 ms
root@3d14f311857c:/#exit
[root@xxxx ~]#docker inspect 3d14f311857c|grep SandboxKey
SandboxKey": "/var/run/docker/netns/162e2e2386e2",
[root@xxxx ~]#nsenter --net=/var/run/docker/netns/162e2e2386e2 iptables -t raw -A OUTPUT -p tcp -d 10.0.14.10 --dport 80 -j CT --notrack
[root@xxxx ~]#nsenter --net=/var/run/docker/netns/162e2e2386e2 iptables -t raw --list
Chain PREROUTING (policy ACCEPT)
target prot opt source destination
Chain OUTPUT (policy ACCEPT)
target prot opt source destination
CT tcp -- anywhere 10.0.14.10 tcp dpt:http CT notrack
After started the stress test, I see a lot UNREPLY entry in conntrack table:
tcp 6 58 CLOSE_WAIT src=10.0.14.11 dst=10.0.14.9 sport=80 dport=40812 [UNREPLIED] src=10.0.14.9 dst=10.0.14.10 sport=40812 dport=80 mark=0 use=1
This is what I expected because the traffic to vip is not tracked.
I repeated and repeated the test with wonderful results.
I scale up and down without any problem.
More other tests need to do. For example, I focused on the traffic between front end and back end containes. More test must be done on front end vps network namespace.
External connections from front end container to external world seems to work fine.
Fingers crossed.
Stefano
stefano-gristina
on 25 May 2018
Hi All,
For the ingress network namespace, I think that it will not work.
For this namespace that is where the virtual servers rechable from external are defined, the ipvs load balancers works as router with source and destination nat: it seems to be configured in direct way.
In this case, the iptable rule to add should be
nsenter --net=/var/run/docker/netns/ingress_sbox iptables -t raw -A PREROUTING -p tcp -d 10.255.0.10 --dport 80 -j CT --notrack
The chain should be PREROUTING, not OUTPUT, and the destination ip are all that visible by this command:
nsenter --net=/var/run/docker/netns/ingress_sbox ipvsadm -L
I'm afraid that without tracking it will not work. I hope I'm wrong.
I cannot test now. I will do it next days.
Stefano
stefano-gristina
on 25 May 2018
Has anyone gained new information on this?
PhilPhonic
on 27 Jun 2018
Unfortunately not me, I've been really busy at work, but I exepct to have some spare time at work in July to continue the tests with iptables rules.
tmarti
on 27 Jun 2018
Hi all
Great thread, got a lot of useful information, thank you guys for so detailed investigation!
—
I’ve been using similar to @PhilPhonic setup, which is only one front nginx proxying second nginx.
There are 2 virtualbox machines in a test bed:
- one hosts docker swarm node
- another one is just for ab utility
There is no special setup for swarm host.
ab machine setup:
sysctl net.ipv4.ip_local_port_range="15000 64000”
so sudo sysctl -a | grep net.ipv4.ip_local_port_range | awk '{ print($4-$3) }’
shows 49000 and I can create at 49k outbound connections.
As @PhilPhonic I’ve got ~14k req limit, then I’ve been hitting this 1s delay
for ab -n 15000 -c 100 http://swarm_ip:8080/ command
What I’ve got from this issue is there is a quadruplet of “source IP, source port, destination IP, destination port” used as a hash key for ipvs connection tracking, which may limit number of simultaneous connections.
ip_local_port_range for swarm node is 28231.
sudo sysctl -a | grep net.ipv4.ip_local_port_range
net.ipv4.ip_local_port_range = 32768    60999
The same applies to docker namespaces.
What I can’t understand is why this delay happens on 14k requests count.
I used
sudo ls /var/run/docker/netns | xargs -I{} bash -c "echo {}; sudo nsenter --net=/var/run/docker/netns/{} ipvsadm -ln”
command during testing and found the following output:
IP Virtual Server version 1.2.1 (size=4096)
Prot LocalAddress:Port Scheduler Flags
  -> RemoteAddress:Port           Forward Weight ActiveConn InActConn
1-u7ygzqqjuq
IP Virtual Server version 1.2.1 (size=4096)
Prot LocalAddress:Port Scheduler Flags
  -> RemoteAddress:Port           Forward Weight ActiveConn InActConn
9b894548bcc2
IP Virtual Server version 1.2.1 (size=4096)
Prot LocalAddress:Port Scheduler Flags
  -> RemoteAddress:Port           Forward Weight ActiveConn InActConn
FWM  259 rr
  -> 10.0.0.4:0                   Masq    1      0          14016
FWM  261 rr
  -> 10.0.0.7:0                   Masq    1      0          0
ce5f47006ebc
IP Virtual Server version 1.2.1 (size=4096)
Prot LocalAddress:Port Scheduler Flags
  -> RemoteAddress:Port           Forward Weight ActiveConn InActConn
FWM  259 rr
  -> 10.0.0.4:0                   Masq    1      0          0
FWM  261 rr
  -> 10.0.0.7:0                   Masq    1      0          0
ingress_sbox
IP Virtual Server version 1.2.1 (size=4096)
Prot LocalAddress:Port Scheduler Flags
  -> RemoteAddress:Port           Forward Weight ActiveConn InActConn
FWM  258 rr
  -> 10.255.0.4:0                 Masq    1      0          0
FWM  260 rr
  -> 10.255.0.7:0                 Masq    1      100        14216
I checked all of these connections using
sudo ls /var/run/docker/netns | xargs -I{} bash -c "echo {}; sudo nsenter --net=/var/run/docker/netns/{} cat /proc/net/ip_vs_conn”
command and have found that all (or most) of them are in TIME_WAIT state.
However 14k is far less than 28k(number of possible local ports for swarm host) and I can’t find evidence that this is ipvs connection table exhaustion.
So I believe that's not ipvs case which was deeply investigated above.
@raarts supposes it may be caused by internal docker swarm balancer and If I understand this right then there are 2 places where this limit may happen:
- ab host to front service connection, source IP + source port pair should be limited by 49k for this example, but that’s not the case.
- front service to back service connection, which should be limited by something around 32k, which is, again, far more than 14k.
Question is: are there any debug tools I can confirm swarm exhaustion table theory? Maybe some internal docker commands to check this table state, size or so?
--
Swarm setup:
version: '3.3'

services:
  front:
    deploy:
      replicas: 1
    image: nginx:latest
    configs:
    - source: test_nginx
      target: /etc/nginx/nginx.conf
    ports:
    - published: 8080
      target: 80
  back:
    deploy:
      replicas: 1
    image: nginx:latest
    ports:
    - 90
    configs:
    - source: test_nginx2
      target: /etc/nginx/nginx.conf

configs:
  test_nginx:
    file: nginx.conf
  test_nginx2:
    file: nginx2.conf

networks:
  default:
    driver: overlay
    attachable: true
nginx2.conf
user www-data;
worker_processes auto;
pid /run/nginx.pid;

events {
    worker_connections 768;
}

http {
    log_format upstream_time '$remote_addr - $remote_user [$time_local] '
                             '"$request" $status $body_bytes_sent '
                             '"$http_referer" "$http_user_agent"'
                             'rt=$request_time uct="$upstream_connect_time" uht="$upstream_header_time" urt="$upstream_response_time"';

    access_log /var/log/nginx/access.log upstream_time;

    server {
        listen 90;
        server_name "";

        location / {
            return 200 'serv 90';
        }
    }
}
nginx.conf
user www-data;
worker_processes auto;
pid /run/nginx.pid;
include /etc/nginx/modules-enabled/*.conf;

events {
    worker_connections 768;
}

http {
    upstream backstream {
      server back:90;
    }

    log_format upstream_time '$remote_addr - $remote_user [$time_local] '
                             '"$request" $status $body_bytes_sent '
                             '"$http_referer" "$http_user_agent"'
                             'rt=$request_time uct="$upstream_connect_time" uht="$upstream_header_time" urt="$upstream_response_time"';

    access_log /var/log/nginx/access.log upstream_time;

    server {
        listen 80;
        server_name "";

        location /{
           proxy_pass http://backstream/;
        }
    }
}
 dbulgak
on 8 Jul 2018
dbulgak
on 8 Jul 2018
WIP Pull request for setting sysctl for swarm services: https://github.com/moby/moby/pull/37701 / https://github.com/docker/swarmkit/pull/2729
thaJeztah
on 23 Aug 2018
@tmarti
echo 0 > conn_reuse_mode: do not attempt to reschedule on
port reuse (new SYN hits unexpired conn), just use the same real
server. This can be bad, we do not select alive server if the
server used by old connection is not available anymore (weight=0
or removed).
I find this option works for me and the performance data increases highly. However, I am curious to learn why?
 m1093782566
on 27 Aug 2018
m1093782566
on 27 Aug 2018
related underlying cause? https://tech.xing.com/a-reason-for-unexplained-connection-timeouts-on-kubernetes-docker-abd041cf7e02
 bitsofinfo
on 30 Aug 2018
bitsofinfo
on 30 Aug 2018
@m1093782566,
It's been a while since I last posted here (and been very busy lately, apart from vacation :) ), but let's try to remember.
Yes, setting conn_reuse_modeto 0 increases throghput, but at a price:
All the problem resides in what happens when you are recycling an already used TCP connection (more or less, combination of SIP:SPORT+DIP:DPORT), which is likely the case for high-throughput scenarios.
When a connection is recycled, and due to the way IPVS module is built, a timeout mechanism is triggered which due on how it is implemented, it is not tuneable, and adds a delay of 1s to each new connection that recycles parameters (SIP:SPORT+DIP:DPORT) from a in-process-of-expiring-connection.
This timeout mechanism could be changed IPVS-side, but I don't think the autors will ever implement this change (and it has to do with the connection tracking mechanism of IPVS).
The state where this issue was left, is that it could be theoretically possible for docker swarm to try to use netfilter rules that do not use the connection tracking module, instead of using it. This should theoretically also solve the added-latency-in-high-throughput-scenarios (more or less) problem.
Setting conn_reuse_mode to 0 skips this connection recycling mechanism, but at a price.
If you read carefully...
echo 0 > conn_reuse_mode: do not attempt to reschedule on
port reuse (new SYN hits unexpired conn), just use the same real
server. This can be bad, we do not select alive server if the
server used by old connection is not available anymore (weight=0
or removed).
... this implies that if a connection (in the process of expiring) is recycled and this flag is set to 0, it will route the connection to the same real server.
Instead of real server, you can read container or instance of backend service or replica, for the case that this thread deals with.
What this means in practice (and if we bring the example to the extreme (high load)), is that when you keep adding/removing replicas to a service, new connections will both:
- be still balanced to already removed replicas after the high req/s start
- not be balanced to newly added replicas after the high req/s
And this is what they mean by:
just use the same real server
Each connection in IPVS has an already decided _real server_, and setting the flag to 0 fixes the connection to that _real server_.
Recalculating the _real server_ requires either:
- not setting the flag to 0 (which introduces the 1s delay for new connections under high req/s)
- use netfilter rules that do not use connection tracking (without the added delay in this case)
Due to the very nature of this problem, this problem will happen when connections are received from a few different IP's, like it's the case for:
- services calling other balanced services
- having an additions LB apart from IPVS itself (like nginx or whatever) in front of the balanced services
Much simplfication has gone into this explanation, so I encourage you to grab some popcorn and read the full thread ;), but this is a very simplified overview of the state of _affairs_.
Please you (and everybody else) feel free to explore the possibility of playing with the netfilter rules that docker swarm sets up and try to get rid of connection tracking there, that should be proper way to move this issue forward as suggested by the creators/mantainers of the IPVS module ;) (as it is explained on some previous post of this thread).
tmarti
on 6 Sep 2018
@tmarti
When a connection is recycled, and due to the way IPVS module is built, a timeout mechanism is triggered which due on how it is implemented, it is not tuneable, and adds a delay of 1s to each new connection that recycles parameters (SIP:SPORT+DIP:DPORT) from a in-process-of-expiring-connection.
Do you mean the delay of 1s result in the decrease of performance? From my test, I find many connections(client to IPVS director in NAT mode) are in established state for a long time(7200s) because real server receive a RST while IPVS director never close the connections to clients when clients reuse the connection. Therefore, clients will hang forever and quickly exhaust connection pool.
I am wondering why real server will receive a RST even if a new connection is established - TCP handshakes are already successfully made.
m1093782566
on 6 Sep 2018
The connections in process of expiring I talk aboutshould be in TIME_WAIT state, not established.
I'm not aware of the problems of your concrete setup has that prevent proper closing of connections.
tmarti
on 6 Sep 2018
Any updates on this issue?
 luizfzs
on 30 Nov 2018
luizfzs
on 30 Nov 2018
Hi Luis,
It's on the state where the load tests need to be repeated where iptables
rules created bt swarm are not using connection tracking.
I've been on very intense development weeks at work lately, so I had no
time to do the needed tests regarding this issue.
Also, it seems that unfortunately nobody has taken over this needed test,
so you (and everybody else, actually) are invited to try it :-).
El vie., 30 nov. 2018 16:34, Luiz Felipe Zafra Saggioro <
[email protected]> escribió:
Any updates on this issue?
—
You are receiving this because you were mentioned.
Reply to this email directly, view it on GitHub
https://github.com/moby/moby/issues/35082#issuecomment-443238085, or mute
the thread
https://github.com/notifications/unsubscribe-auth/ACS0JgprxGgCX_oVXT9fiu0q_ukSQqqKks5u0VAIgaJpZM4PtUll
.
tmarti
on 1 Dec 2018
@tmarti I'll be more than willing to test. If you can, could you provide some guidance on how to test? e.g. what is the code version that contains the fix, do I need to use any options?
luizfzs
on 1 Dec 2018
Great! Thanks for taking this challenge :-)
(I only followed this thread, so don't really know if the problem is
already solved on some release (but I dont't think so, else this issue
would be probably closed))
Please let me come back again you during Monday's morning (I've some notes
about all this in the office, which is 1hr distance from home).
As a previous step for you, I recommend you go through this issue's
comments, up to the point where Julian (one of the mantainers of the kernel
module implied in this, you should be able to type "Julian" into your
browser's text search on this page) comments are exposed.
El sáb., 1 dic. 2018 16:02, Luiz Felipe Zafra Saggioro <
[email protected]> escribió:
@tmarti https://github.com/tmarti I'll be more than willing to test. If
you can, could you provide some guidance on how to test? e.g. what is the
code version that contains the fix, do I need to use any options?—
You are receiving this because you were mentioned.
Reply to this email directly, view it on GitHub
https://github.com/moby/moby/issues/35082#issuecomment-443432304, or mute
the thread
https://github.com/notifications/unsubscribe-auth/ACS0JnPS0yRf9f6XlCyJW_HFJZMFVHfPks5u0pofgaJpZM4PtUll
.
tmarti
on 1 Dec 2018
(I only followed this thread, so don't really know if the problem is already solved on some release (but I dont't think so, else this issue would be probably closed))
Just to confirm: the problem still exists for us in docker 18.09
PhilPhonic
on 8 Jan 2019
Problem still exists in latest version 18.09.1, build 4c52b90
 xanderhades
on 30 Jan 2019
xanderhades
on 30 Jan 2019
Hi
I'm also experiencing swarm (Docker version 18.06.1-ce) specific socket-setup performance issues, but for a non-ingress overlay network.
I suspect this ticket is still relevant for this, right?
I have configured net.ipv4.vs.conn_reuse_mode=0 for the kernel of the host OS.
[rancher@worker-1 ~]$ sudo sysctl net.ipv4.vs.conn_reuse_mode
net.ipv4.vs.conn_reuse_mode = 0
[rancher@worker-1 ~]$
And hoped that it would "fix it", but it doesn't:(
When I enter a container, I still see
[rancher@worker-1 ~]$ docker exec -it fcbb091147ea ash
/ # sysctl net.ipv4.vs.conn_reuse_mode
net.ipv4.vs.conn_reuse_mode = 1
/ #
I suspect that is my problem? Or, irrelevant?
If relevant, I cannot figure out how to: make sure containers are born in the swarm with a correct value... pls help?
 klas3000
on 31 Jan 2019
klas3000
on 31 Jan 2019
we are having the same issue. can someone help here ? our services suffer when there is a traffic spike. I'm on docker 18.09
 sandys
on 12 Feb 2019
sandys
on 12 Feb 2019
conn_reuse_mode - INTEGER
1 - default
Controls how ipvs will deal with connections that are detected
port reuse. It is a bitmap, with the values being:

0: disable any special handling on port reuse. The new
connection will be delivered to the same real server that was
servicing the previous connection. This will effectively
disable expire_nodest_conn.

bit 1: enable rescheduling of new connections when it is safe.
That is, whenever expire_nodest_conn and for TCP sockets, when
the connection is in TIME_WAIT state (which is only possible if
you use NAT mode).

bit 2: it is bit 1 plus, for TCP connections, when connections
are in FIN_WAIT state, as this is the last state seen by load
balancer in Direct Routing mode. This bit helps on adding new
real servers to a very busy cluster.
according to the description, conn can be reuse when it is in TIME_WAIT state. But all test that tmarti had done show TIME_WAIT state could not reuse.
Has anyone gained new information on this?
 horizonlin
on 3 Apr 2019
horizonlin
on 3 Apr 2019
when i run Docker version 19.03.0-beta1, build 62240a9677 having the same issue, even use
docker service create --publish 80:80 --sysctl=net.ipv4.tcp_fin_timeout=3 --sysctl=net.ipv4.vs.conn_reuse_mode=0 --network=simple-server --name nginx --mount type=bind,source=/usr/local/openresty/nginx/conf,destination=/usr/local/openresty/nginx/conf --entrypoint=/usr/local/openresty/nginx/sbin/nginx ubuntu:dev
but ingress_box also
root@iZbp1emxe3fhdsuz1eodbmZ:~# ipvsadm -l
IP Virtual Server version 1.2.1 (size=4096)
Prot LocalAddress:Port Scheduler Flags
  -> RemoteAddress:Port           Forward Weight ActiveConn InActConn
FWM  264 rr
  -> 10.255.0.38:0                Masq    1      6396       64468
 yayuntian
on 9 Apr 2019
yayuntian
on 9 Apr 2019
@tmarti @thaJeztah sos, problem still exists in latest version Docker version 19.03.0-beta1, build 62240a9677
i have 4 backend process run in host (not container) and use nginx service proxy to it
run nginx by service
docker service create --publish 80:80 --sysctl net.ipv4.tcp_tw_reuse=1 --sysctl net.ipv4.ip_local_port_range="5000 65000" --sysctl=net.ipv4.tcp_fin_timeout=3 --sysctl=net.ipv4.vs.conn_reuse_mode=0 --network=simple-server --name nginx --mount type=bind,source=/usr/local/openresty/nginx/conf,destination=/usr/local/openresty/nginx/conf --entrypoint=/usr/local/openresty/nginx/sbin/nginx ubuntu:dev
and use other 2 node run wrk
wrk -c 50000 -t 16 -t 20 http://192.168.66.56
always cpu 100% and nginx container node pause, even ssh connection timeout
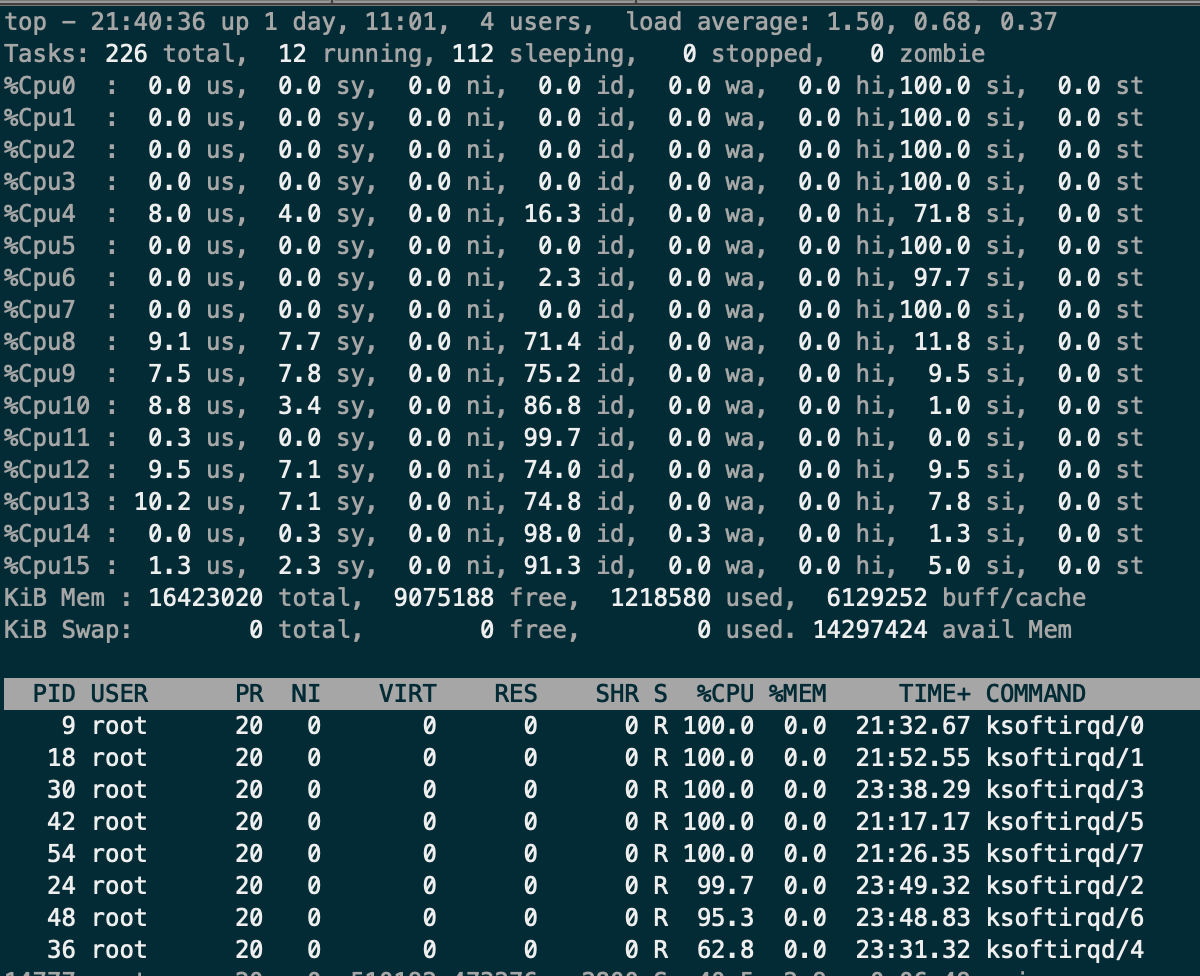
NOTE
Can be solved by manual setting the sysctl parameter as follows, but I don't know why.
nsenter --net=/var/run/docker/netns/ingress_sbox
sysctl -w net.netfilter.nf_conntrack_tcp_timeout_time_wait=3
WIP Pull request for setting sysctl for swarm services: #37701 / docker/swarmkit#2729
Nice, but "Compose file version 3 reference" says:
Note: This option is ignored when deploying a stack in swarm mode with a (version 3) Compose file.
Am I getting this right: setting sysctls with docker service create would work, but with a stack definition in a compose-file it won't?
PhilPhonic
on 4 Jun 2019
I'd like to leave a solution I have used for our single node swarm services supporting rolling updates.
Many thanks to @tmarti for an indepth analysis of IPVS source code by the way.
TL;DR
- sudo nsenter --net=/var/run/docker/netns/{your_load_balancer} sysctl -w net.ipv4.vs.conn_reuse_mode=0
- sudo nsenter --net=/var/run/docker/netns/{your_load_balancer} sysctl -w net.ipv4.vs.expire_nodest_conn=1
Environment
- a single NGINX service in "host" mode
- a django web service with a replication factor of 2 load balanced by Docker Swarm
Background
- Under a high load, our web service response latency increased by 1 second constantly
- Requests to the NGINX service in "host" mode was very responsive
- Making requests internal to the web service was also very responsive
- Started suspecting that the Docker Swarm load balancer was the bottleneck
Explanation of our solution
- When "conn_reuse_mode" variable is set to 0, IPVS module bypasses evaluating an existing connection entry in TIME_WAIT status
- IPVS module no longer drops client packets by returning NF_DROP netfilter hook
- A client does not need to send another SYN after a RTO (request time-out) event
- The down-side of "conn_reuse_mode=0" is that a request will be routed according to the existing connection entry in the IPVS connection table
- ex) If one of your web service is destroyed while performing a rolling update, client requests can be routed to the destroyed service
- Our solution to the above issue was to set "expire_nodest_conn=1"
- Even though https://www.kernel.org/doc/Documentation/networking/ipvs-sysctl.txt states that "conn_reuse_mode=0" will disable expire_nodest_conn, expire_nodest_conn variable does get used independently from conn_reuse_mode
- By setting "expire_nodest_conn=1", IPVS module verifies if the connection destination is available or not
- This allows a re-used connection to be expired from the IPVS connection table if its destination is not available, and forces clients to re-send SYN which will then get routed to a newly created web service
- Even though https://www.kernel.org/doc/Documentation/networking/ipvs-sysctl.txt states that "conn_reuse_mode=0" will disable expire_nodest_conn, expire_nodest_conn variable does get used independently from conn_reuse_mode
Downside of our solution
- After a rolling update, it is inevitable to experience 1 second delay for each connection which used to point to old web services rising from "expire_nodest_conn=1".
- However, once all the previous connection entries to old web services are replaces with new conection entries pointing to new web services, you are now basically re-using connections according to the IPVS connection table.
Notes
- Kubernetes team has set "conn_reuse_mode=0" by default
Possible Solution
- Similar to how Kubernetes set above values by default, Docker Swarm load balancer could overwrite sysctl variables by default rather than enforcing users to undergo in-depth analyses on IPVS module implementation
 ahjumma
on 13 Dec 2019
ahjumma
on 13 Dec 2019
An amazing analysis @ahjumma, thanks!
 peter-slovak
on 14 Dec 2019
peter-slovak
on 14 Dec 2019
@ahjumma Thank you so much for your research and sharing your findings. I would have never found this on my own!
We hit this exact same issue using a single node docker swarm instance, with one nginx replica in host mode for ingress, communicating thru the overlay network to 8 replicas of a nodejs server internally load balanced by swarm.
Prior to implementing your fix, when running a load testing tool, we would see a major drop in requests per second (RPS) and a corresponding increase in latency (from a few dozen ms to 1 second), on a cadence of every 2 minutes like clockwork. That is explained by the default 2 minute timeout for cleaning up the CLOSE_WAIT connections.
Before and after your fix:
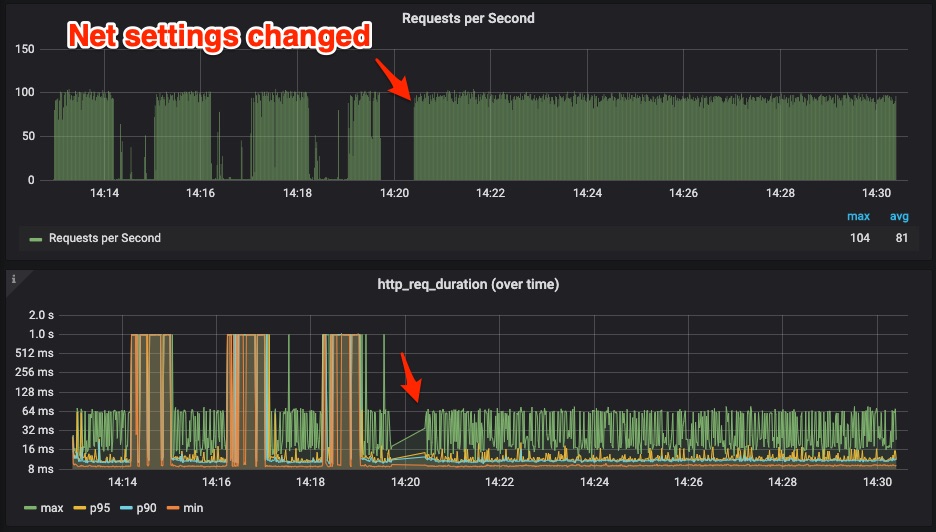
I saw the PR for libnetwork. But it seems to be stalled. Just wanted to add one more data point for the docker team that this fix worked for us! Hopefully we can get a fix for this soon in Docker so we don't have to hack these settings manually.
 geekdave
on 12 Feb 2020
geekdave
on 12 Feb 2020
should be fixed on master through https://github.com/moby/moby/pull/40579
thaJeztah
on 28 Feb 2020
Hello everyone:
We are very fortunate to tell you that this bug has been fixed by us and has been verified to work very well. The patch(ipvs: avoid drop first packet by reusing conntrack) is being submitted to the Linux kernel community. You can also apply this patch to your own kernel, and then only need to set net.ipv4.vs.conn_reuse_mode=1(default) and net.ipv4.vs.conn_reuse_old_conntrack=1(default). As the net.ipv4.vs.conn_reuse_old_conntrack sysctl switch is newly added. You can adapt the kube-proxy by judging whether there is net.ipv4.vs.conn_reuse_old_conntrack, if so, it means that the current kernel is the version that fixed this bug.
That Can solve the following problems:
- Rolling update, IPVS keeps scheduling traffic to the destroyed Pod
- Unbalanced IPVS traffic scheduling after scaled up or rolling update
- fix IPVS low throughput issue #71114
https://github.com/kubernetes/kubernetes/pull/71114 - One second connection delay in masque
https://marc.info/?t=151683118100004&r=1&w=2 - IPVS low throughput #70747
https://github.com/kubernetes/kubernetes/issues/70747 - Apache Bench can fill up ipvs service proxy in seconds #544
https://github.com/cloudnativelabs/kube-router/issues/544 - Additional 1s latency in
host -> service IP -> podwhen upgrading from1.15.3 -> 1.18.1on RHEL 8.1 #90854
https://github.com/kubernetes/kubernetes/issues/90854 - kube-proxy ipvs conn_reuse_mode setting causes errors with high load from single client #81775
https://github.com/kubernetes/kubernetes/issues/81775
Thank you.
By Yang Yuxi (TencentCloudContainerTeam)
 yyx
on 11 Jun 2020
yyx
on 11 Jun 2020
No, Thank YOU! Great work!
raarts
on 11 Jun 2020
This is great news! As a user who isn't super familiar with the underlying issues, does anyone know what I will need to wait for to get this without patching? So far it seems there may be two separate fixes.
1) A fix in Docker itself, scheduled for the 20.x release per @thaJeztah 's comment above: https://github.com/moby/moby/issues/35082#issuecomment-592240157
2) The kernel fix mentioned by Yang above
Does this mean that end users should wait for Docker 20.x + a new kernel release (for Ubuntu users does this mean something like Ubuntu 22?)
Thanks!
geekdave
on 11 Jun 2020
Wow @yyx!
The wait has been worth the time 😃
Congratulations for the patch! When one sees those very localized code diffs they always look easier than it actually is to do them 🎉
tmarti
on 13 Jun 2020
🎉🎉🎉
yayuntian
on 15 Jun 2020
@yyx Thank you so much for your great work. This performance problem has stopped us to upgrade our system. We have applied this patch(ipvs: avoid drop first packet to reuse conntrack) to the kernel, the performance problem has been resolved! What you've done has saved us! Thanks again!
By the way, have you created pull request for kernel repo?
 jrwng
on 3 Jul 2020
jrwng
on 3 Jul 2020
Thank you for the solution analysis @ahjumma .
Using the following, we were able to address the 1 second latency we were seeing.
sudo nsenter --net=/var/run/docker/netns/{your_load_balancer} sysctl -w net.ipv4.vs.conn_reuse_mode=0
sudo nsenter --net=/var/run/docker/netns/{your_load_balancer} sysctl -w net.ipv4.vs.expire_nodest_conn=1
Noob question, but is the above method the suggested way, or is there an alternative way of being able to do this through --systl-add? I imagine/hope this question is only relevant until we patch this fix, or get the upgrade it is included in as mentioned above.
 EIrwin
on 4 Jul 2020
EIrwin
on 4 Jul 2020
Thank you for the solution analysis @ahjumma .
Using the following, we were able to address the 1 second latency we were seeing.
sudo nsenter --net=/var/run/docker/netns/{your_load_balancer} sysctl -w net.ipv4.vs.conn_reuse_mode=0
sudo nsenter --net=/var/run/docker/netns/{your_load_balancer} sysctl -w net.ipv4.vs.expire_nodest_conn=1
Noob question, but is the above method the suggested way, or is there an alternative way of being able to do this through
--systl-add? I imagine/hope this question is only relevant until we patch this fix, or get the upgrade it is included in as mentioned above.
It is recommended that you use the following version for quick verification:
https://github.com/Tencent/TencentOS-kernel
yyx
on 6 Jul 2020
@yyx Thank you so much for your great work. This performance problem has stopped us to upgrade our system. We have applied this patch(ipvs: avoid drop first packet to reuse conntrack) to the kernel, the performance problem has been resolved! What you've done has saved us! Thanks again!
By the way, have you created pull request for kernel repo?
Latest patch
(ipvs: avoid drop first packet by reusing conntrack) is being submitted to the Linux kernel community.
yyx
on 6 Jul 2020
This is great news! As a user who isn't super familiar with the underlying issues, does anyone know what I will need to wait for to get this without patching? So far it seems there may be two separate fixes.
- A fix in Docker itself, scheduled for the 20.x release per @thaJeztah 's comment above: #35082 (comment)
- The kernel fix mentioned by Yang above
Does this mean that end users should wait for Docker 20.x + a new kernel release (for Ubuntu users does this mean something like Ubuntu 22?)
Thanks!
It is recommended that you use the following version for quick verification:
https://github.com/Tencent/TencentOS-kernel
yyx
on 6 Jul 2020
I just tried adding the following to all my docker swarm services,
  sysctls:
    net.ipv4.tcp_fin_timeout: 3
    net.ipv4.ip_local_port_range: "5000 65535"
    net.ipv4.vs.conn_reuse_mode: 0
    net.ipv4.vs.expire_nodest_conn: 1
    net.ipv4.tcp_tw_reuse: 1
Ran this with nsenter on ingress_sbox as well.
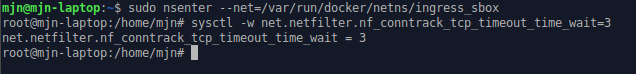
I'm still experiencing the 1s interval delays. It runs pretty smooth the first minute or so, and then my CPU goes from 100% to 10% effectively doing nothing.
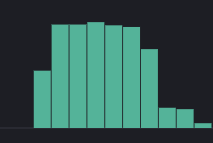
I'm running Ubuntu 20.04 (5.4.0-40-generic), and Docker version 19.03.12, build 48a66213fe
Am I missing something, or didn't you guys manage to circumvent this issue somehow ?
Edit:
I removed all sysctl params in stack ymls, and ran the following on the actual lb_* netns, that worked.
nsenter --net=/var/run/docker/netns/lb_xxxxxxxx sysctl -w net.ipv4.vs.expire_nodest_conn=1
nsenter --net=/var/run/docker/netns/lb_xxxxxxxx sysctl -w net.ipv4.vs.conn_reuse_mode=0
 firecow
on 8 Jul 2020
firecow
on 8 Jul 2020
Following-up on the kernel patch mentioned in https://github.com/moby/moby/issues/35082#issuecomment-642711079 for posterity:
The above patch mentioned in https://github.com/moby/moby/issues/35082#issuecomment-642711079 didn't make it to the kernel but there are two recently merged patches worth highlighting. One of them fixes the 1 second delay issue when a conntrack entry is reused and the other fixes an issue where packets are dropped when stale connection entries in the IPVS table are used:
1) http://patchwork.ozlabs.org/project/netfilter-devel/patch/[email protected]/
2) http://patchwork.ozlabs.org/project/netfilter-devel/patch/[email protected]/
The 2nd patch in particular should help in cases where there is high load from a single client as described in the original issue description.
 andrewsykim
on 20 Jul 2020
andrewsykim
on 20 Jul 2020
@firecow I'm not able to use nsenter command. :(
root@test03:~# docker --version
Docker version 19.03.8, build afacb8b

root@test03:~# ls -l /var/run/docker/netns/lb_*
-rw-r--r-- 1 root root 0 Aug  3 17:19 /var/run/docker/netns/lb_b1c4bbhf2
root@test03:~# nsenter -n /var/run/docker/netns/lb_b1c4bbhf2 sysctl -w net.ipv4.vs.conn_reuse_mode=0
nsenter: neither filename nor target pid supplied for ns/net
root@test03:~# nsenter --net=/var/run/docker/netns/lb_b1c4bbhf2 sysctl -w net.ipv4.vs.conn_reuse_mode=0
nsenter: reassociate to namespace 'ns/net' failed: Invalid argument
Someone will be able to help me and tell why?
 mariaczi
on 3 Aug 2020
mariaczi
on 3 Aug 2020
@firecow I'm not able to use
nsentercommand. :(root@test03:~# docker --version Docker version 19.03.8, build afacb8b root@test03:~# ls -l /var/run/docker/netns/lb_* -rw-r--r-- 1 root root 0 Aug 3 17:19 /var/run/docker/netns/lb_b1c4bbhf2 root@test03:~# nsenter -n /var/run/docker/netns/lb_b1c4bbhf2 sysctl -w net.ipv4.vs.conn_reuse_mode=0 nsenter: neither filename nor target pid supplied for ns/net root@test03:~# nsenter --net=/var/run/docker/netns/lb_b1c4bbhf2 sysctl -w net.ipv4.vs.conn_reuse_mode=0 nsenter: reassociate to namespace 'ns/net' failed: Invalid argumentSomeone will be able to help me and tell why?
@mariaczi
Here is the bash script I used to update all my machines.
Never seen that error before. Perhaps an "old" kernel.
#!/bin/bash -e

HOSTNAMES="node01 node02"
DOMAIN="somedomain.com"

for HOSTNAME in $HOSTNAMES
do
  echo "root@$HOSTNAME.$DOMAIN"

  NETS=$(ssh -q "root@$HOSTNAME.$DOMAIN" 'ls /var/run/docker/netns/ | grep lb_')
  for NET in $NETS
  do
    echo "Setting sysctl for $HOSTNAME.$DOMAIN load balancer network $NET"
    ssh -q "root@$HOSTNAME.$DOMAIN" "nsenter --net=/var/run/docker/netns/$NET sysctl -w net.ipv4.vs.expire_nodest_conn=1"
    ssh -q "root@$HOSTNAME.$DOMAIN" "nsenter --net=/var/run/docker/netns/$NET sysctl -w net.ipv4.vs.conn_reuse_mode=0"
  done

done
@firecow thanks for your answer. Maybe you have right, that the kernel version is the reason of my problem. I'm tried on kernel version 4.4. Which kernel version you have?
mariaczi
on 5 Aug 2020
@mariaczi

firecow
on 7 Aug 2020
In my case, the namespace for the load balancer was /var/run/docker/netns/ingress_sbox, so the script above didn't work as is.
 OlegSmelov
on 17 Aug 2020
OlegSmelov
on 17 Aug 2020
Thanks @OlegSmelov, I had the same issue but running against ingress_sbox fixed it for me!
 rodo-r2r
on 18 Aug 2020
rodo-r2r
on 18 Aug 2020
@OlegSmelov, @rodo-r2r could you give the info about used kernel version on this servers where after changing namespace options problem has been fixed?
mariaczi
on 18 Aug 2020
$ uname -srm
Linux 4.15.0-108-generic x86_64
Not sure if it matters, but I was load testing my service from outside the cluster.
I assumed that's why ingress_sbox helped? I don't know much about docker networking :-)
rodo-r2r
on 18 Aug 2020
Also
$ docker --version
Docker version 19.03.12, build 48a66213fe
@rodo-r2r I catched this great article https://neuvector.com/network-security/docker-swarm-container-networking/ ;)
mariaczi
on 18 Aug 2020
$ uname -srm
Linux 3.10.0-957.21.3.el7.x86_64 x86_64
$ docker --version
Docker version 19.03.2, build 6a30dfc
I've also just realized there are three sysctls applied in the fix: https://github.com/moby/libnetwork/pull/2491/files
- net.ipv4.vs.conn_reuse_mode=0
- net.ipv4.vs.expire_nodest_conn=1
- net.ipv4.vs.expire_quiescent_template=1
OlegSmelov
on 19 Aug 2020
Dears, I try to once again.
I have running a few containers:
root@test03:~# ls -l /var/run/docker/netns/
total 0
-rw-r--r-- 1 root root 0 Jul 31 17:06 1-lw3eet6cv7
-rw-r--r-- 1 root root 0 Aug  4 19:58 1-opr4j2rlla
-rw-r--r-- 1 root root 0 Aug 19 04:18 15042db92738
-rw-r--r-- 1 root root 0 Aug 19 04:18 8c7ea3dd5a74
-rw-r--r-- 1 root root 0 Aug 19 04:18 c3e4c5b45126
-rw-r--r-- 1 root root 0 Aug 19 04:17 d71414651ec8
-rw-r--r-- 1 root root 0 Aug 19 04:17 d94fded16aee
-rw-r--r-- 1 root root 0 Aug 19 04:17 f0f23d1664f7
-rw-r--r-- 1 root root 0 Aug  4 20:05 f82d5a1ac9f3
-rw-r--r-- 1 root root 0 Jul 31 17:06 ingress_sbox
-rw-r--r-- 1 root root 0 Aug  4 19:58 lb_opr4j2rll
But I'm not able to execute sysctl for any one specific container network namespace:
root@test03:~# nsenter --net=/var/run/docker/netns/ingress_sbox sysctl
nsenter: reassociate to namespace 'ns/net' failed: Invalid argument
root@test03:~# nsenter --net=/var/run/docker/netns/lb_opr4j2rll sysctl
nsenter: reassociate to namespace 'ns/net' failed: Invalid argument
How or where to looking for the reason? I have running docker on Slackware Linux.
Also:
root@test03:~# nsenter --version
nsenter from util-linux 2.27.1
Just tested this on a freshly updated linux kernel 5.4.0-48 on Ubuntu 20.04 (https://bugs.launchpad.net/ubuntu/+source/linux/+bug/1892417) and the issue appears to be fixed for me, no sysctl tweaks are needed. Looks like "ipvs: allow connection reuse for unconfirmed conntrack" fixed it.
 eng1neer
on 22 Sep 2020
eng1neer
on 22 Sep 2020
Related issues
 phemmer
·
190Comments
phemmer
·
190Comments
 AaronFriel
·
206Comments
AaronFriel
·
206Comments
 shykes
·
153Comments
thaJeztah
·
203Comments
shykes
·
153Comments
thaJeztah
·
203Comments
 darklajid
·
286Comments
darklajid
·
286Comments
Most helpful comment
I'd like to leave a solution I have used for our single node swarm services supporting rolling updates.
Many thanks to @tmarti for an indepth analysis of IPVS source code by the way.
TL;DR
Environment
Background
Explanation of our solution
Downside of our solution
Notes
Possible Solution