Ml-agents: Memory is linearly increasing when I use model inference mode.
https://github.com/Unity-Technologies/ml-agents/issues/1817
Because i think above issue can solve memory leak issue.
I changed my ml-agent version to 0.9.2
as above url said,I checked that it can solve the issue of "3DBall" sample example.
But it still has memory leak issue, when it comes to run other sample example
(Especially sample with "ray Perception!" ex.pushBlock, Hallway)
could you check this issue? I think it would be serious problem, when I run my
"custom self training system". Because it should use at least one inference mode for
counter part agent. please help me.... :(
=============================
following is how to reproduce my issue.
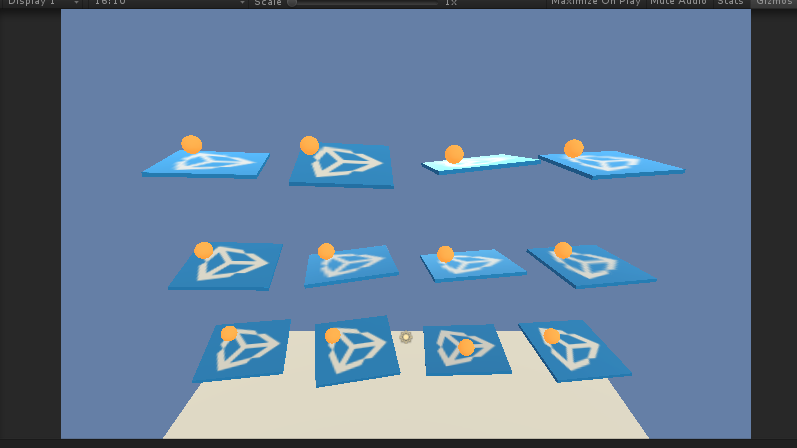
open the "Hallway"(pushBolck) example scene.
change the "Time Scale" to 100 in academy Inspector window.
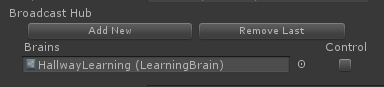
An do not check Control check box.

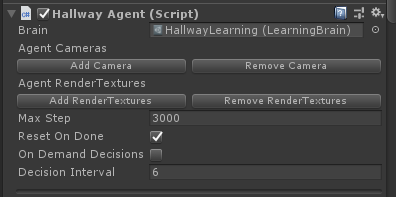
Give the pre-learned model to agent in "HallwayArea" prefab.
(It is already loaded, if you don't edit this example after installing the ml-agent)
play! & press "Ctrl + Shift + Esc" and watch memory state increasing.
 hanseoup
All 7 comments
Hi @hanseoup,
I observed similar behavior to what you described, using the Unity profiler to track the memory usage. However, the memory usage eventually levels out (about maybe 30 seconds of real time) and stays flat after this.

Can you confirm (preferably in the profiler) whether the memory growth eventually stops? If you're still concerned, we should be able to dig some more and see where the growth is coming from.
 chriselion
on 6 Sep 2019
chriselion
on 6 Sep 2019
Thank you for your reply. as you said, i track the memory state, and i want to see the point that memory eventually stop. But, in my environment, the memory state is just linearly increasing.
following are snapshots... for checking the issue.
- at start

- after 2min

3.after 8min

4.after 20min

The example i used is "HallWay" in same configuration, as i explained above.
and here is etc...
ml-agent version: 0.9.2v
unity version: 2018.3.14
os: Window 10(x64)
cpu: i7-8700K
gpu: 2080RTX
ram: 32.0GB
+) could you tell me, your unity version & ml-agent version?
hanseoup
on 9 Sep 2019
My testing is on MacOS using Unity 2017.410f1.
I looked at this today (along with @surfnerd) and we were able to reproduce similar results to what you were seeing on Mac too - the total allocated memory reported by the Unity profiler leveled off, but the amount reported by the system (Activity Monitor on Mac) kept increasing.
We think that what you're seeing is at least partly due to memory fragmentation as explained here: https://docs.unity3d.com/Manual/BestPracticeUnderstandingPerformanceInUnity4-1.html
The total memory allocated hits a peak, but because of fragmentation, the amount of memory from the OS increases.
The material swapping that happens in the hallway scene makes the fragmentation worse that it normally would be. If you comment out this part of the code
https://github.com/Unity-Technologies/ml-agents/blob/develop/UnitySDK/Assets/ML-Agents/Examples/Hallway/Scripts/HallwayAgent.cs#L47-L49
you should see that the memory increase is much slower than before.
We're going to keep looking at other allocations that are still happening (especially if they're part of the SDK, not the "demo" code) to see if any of them can be reduced or eliminated.
chriselion
on 10 Sep 2019
Thank you, chriselion! I hope that we could solve the issue soon. please comment it, if you find some clues :)
hanseoup
on 10 Sep 2019
Still investigating - at the moment it appears there might be a bug with our reuse (or lack thereof) of tensors in Barracuda.
chriselion
on 11 Sep 2019
Hi @hanseoup,
Thank you for providing feedback on this issue. #2541 should fix the memory leak. Please let us know if you have further issues.
 surfnerd
on 11 Sep 2019
surfnerd
on 11 Sep 2019
Thank you @surfnerd ! I checked my memory issue solved, also in my custom environment!
Thanks a lot!
hanseoup
on 23 Sep 2019
Related issues
 MarcPilgaard
·
3Comments
MarcPilgaard
·
3Comments
 MarkTension
·
3Comments
MarkTension
·
3Comments
 Rodnyy
·
3Comments
Rodnyy
·
3Comments
 scotthovestadt
·
4Comments
scotthovestadt
·
4Comments
 gerardsimons
·
3Comments
gerardsimons
·
3Comments