Mini-graph-card: v0.4.1, Cards not showing if "color_threshold" is not defined in yaml
Updated the mini-graph-card js to 0.4.1, and most of my graph cards disappeared. While investigating the problem I discovered only the cards with a defined "color_threshold" section in the yaml will display. As soon as that is removed, the card vanishes, even if there is a "color" value defined.
No error message is shown, just empty space.
Mock-up example of a working card (taken from elsewhere in my setup)

And as soon as I remove the two lines on the bottom:
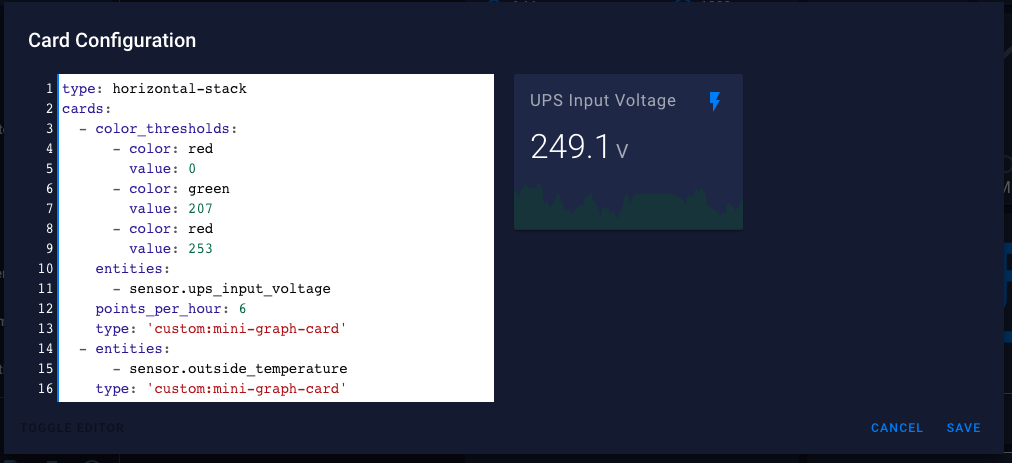
This is only since updating to 0.4.1; previous versions worked fine.
 DoctorOctagonapus
All 19 comments
Hey,
Please try re-downloading the latest release, might be that the build didn't deploy on time of the release properly, also try clearing cache.
 kalkih
on 17 May 2019
kalkih
on 17 May 2019
Clearing the cache and hard-reloading the page seemed to bring my graphs back, but I've also noticed the actual line on the graph is missing from cards with the color_threshold defined. This is also in the two screenshots I posted in the original issue.
Replacing the js file with one from the latest release doesn't seem to have made a difference.
DoctorOctagonapus
on 17 May 2019
Can't reproduce, please post any potential errors found in the browser dev console.
And, while I can't reproduce this particular issue, there's a few other issues with the new color_thresholds implementation, woking on improving it atm.
kalkih
on 17 May 2019
Seeing the same issue, with v0.4.1. Lines are no longer showing up, on some graphs. These all have the same config and until this update all had lines visible:
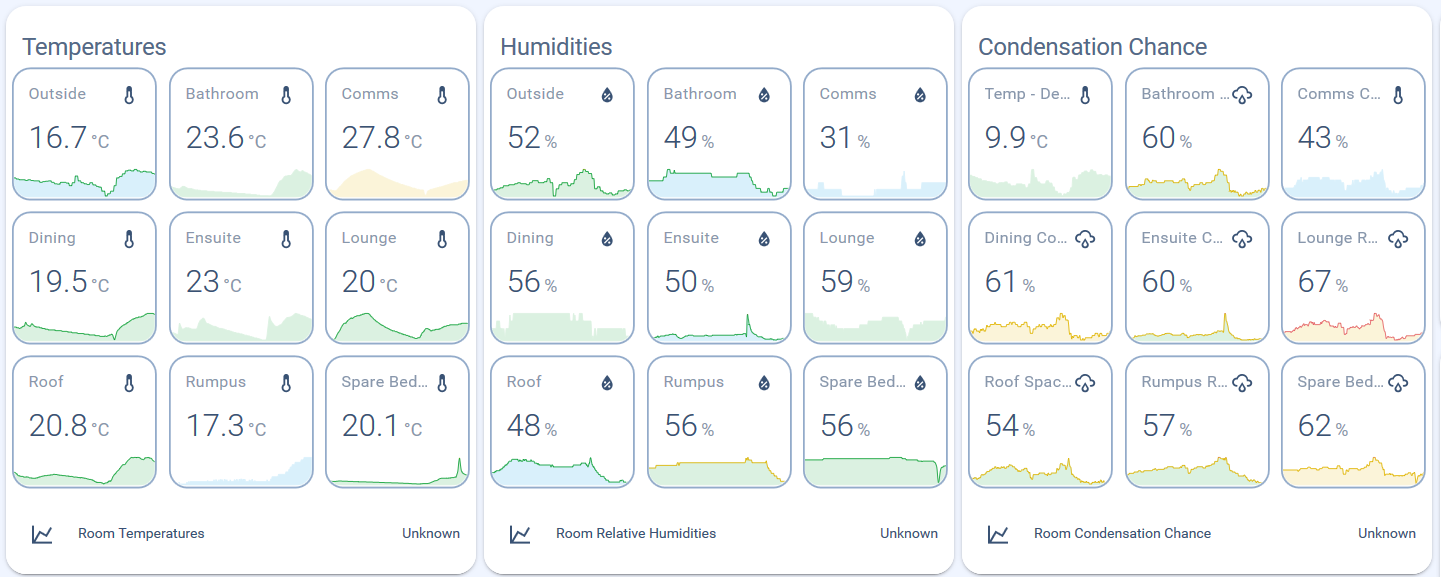
The common factor seems to be graphs that have not transitioned a colour threshold are not displaying lines.
The display of the past line threshold colour also only appears when the mouse is hovered over the graph:
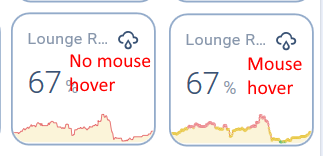
Issue exists in both Firefox 66.0.5 and Chrome 74.0.3729.157
EDIT: Updated to HA 0.93.1 and the missing lines are no longer an issue. The past line colour is still an issue.
 tomlut
on 18 May 2019
tomlut
on 18 May 2019
Hey, new release should fix these issues.
kalkih
on 18 May 2019
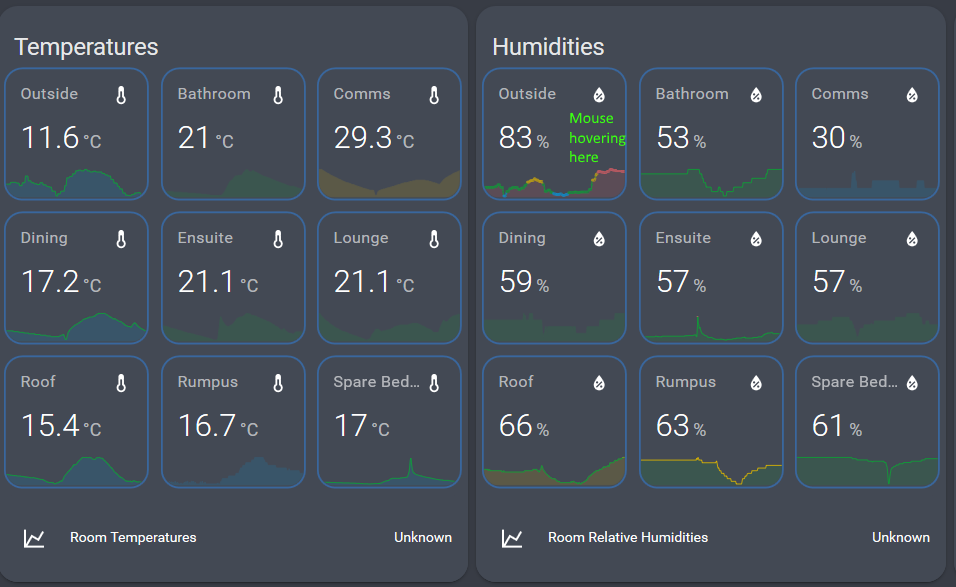
Still broken unfortunately. Lines missing on graphs that do not cross colour thresholds and line colour history only shows up correctly on mouse hover.
I cleared my cache but it made no difference.
tomlut
on 18 May 2019
Okay, I see the issue with line color not showing if line never cross a threshold, should be an easy fix.
The other issue is kinda weird though, I see it now too, adding a second (non existing entity) to the graph seems to fix it?
Not sure what that could be, I'm really tired of all this SVG stuff atm to be honest... thinking about rolling back to the old threshold solution. 😆
kalkih
on 18 May 2019
Not sure what that could be, I'm really tired of all this SVG stuff atm to be honest... thinking about rolling back to the old threshold solution. 😆
Setting hours_to_show higher (100 or something) also seems to solve the second issue, I'm confused 🤔
kalkih
on 18 May 2019
I'd suggest either rolling back or putting in a switch option to specify how to draw the threshold colour change.
DoctorOctagonapus
on 19 May 2019
Nah, I'm going to fix this, in the meantime, If you need color_thresholds working properly rn, go and download the v0.3.3 release.
kalkih
on 19 May 2019
Hey everyone, new pre-release available, would appreciate your feedback, should fix the issues discussed here.
https://github.com/kalkih/mini-graph-card/releases/tag/v0.4.3-beta
kalkih
on 20 May 2019
Yep the beta release works as expected for me. Thank you for the rapid fix.
tomlut
on 21 May 2019
The lines is back with 0.4.3.
Not sure if I have missed anything here (comming from 0.3.3) but the has the _color_thresholds_ changed?
line_color: var(--google-green-400)
color_thresholds:
  - value: 50
    color: var(--google-red-400)
with a value of 0 (zero) will print a red line.
 bratanon
on 21 May 2019
bratanon
on 21 May 2019
@bratanon
color thresholds no longer fall back to line_color if unmet, so you'll have to specify another threshold entry for the green color in your example.
kalkih
on 21 May 2019
The only thing I would say is that the transition between colours on the graph line seems a bit broad. So much so that it often appears that the line is in the next threshold colour. In the images below the mouse hover shows the correct colour thresholds
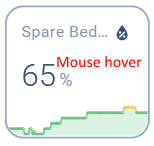
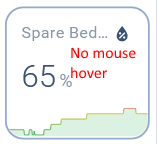
Or maybe the line colour is incorrectly in the next threshold?
The thresholds for this graph are nowhere near what it is displaying:
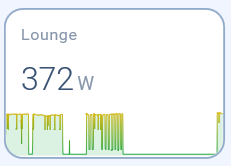
color_thresholds:
  - color: '#0da035'
    value: -1
  - color: '#e0b400'
    value: 1800
  - color: '#e45e65'
    value: 2100
The peak value of 370 Watts is still well under the yellow threshold of 1800W.
tomlut
on 21 May 2019
@tomlut Yes, I have that issue too.
bratanon
on 21 May 2019
show:
  fill: false
  labels: false
hour24: true
more_info: false
color_thresholds:
  - value: 0
    color: var(--google-green-400)
  - value: 50
    color: var(--google-red-400)
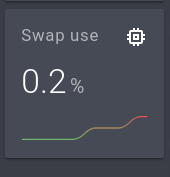
The lowest value in the graph is 0, and the highest is 0.2 and that will produce a red line in the end.
bratanon
on 21 May 2019
@tomlut @bratanon
Yep, that's a caveat of the new way we render thresholds.
It can however be circumvented by adding an additional threshold, and that way the transition "smoothness" could also be adjusted.
This would also work for values out of bounds of the rendered graph.

- type: custom:mini-graph-card
  entities:
    - sensor.example
  name: Soft
  color_thresholds:
    - value: 10
      color: "#81ecec" # TEAL
    - value: 20
      color: "#e74c3c" # RED

- type: custom:mini-graph-card
  entities:
    - sensor.example
  name: Hard
  color_thresholds:
    - value: 10
      color: "#81ecec" # TEAL
    - value: 19.9
      color: "#81ecec" # TEAL
    - value: 20
      color: "#e74c3c" # RED
I can see the current behaviour being useful if you don't really care about values and just want a gradient effect, low -> high.
We could solve the issue programmatically but would then lose the ability to have smooth transitions, and would also make the use case stated above unachievable. But yeah, it's the "out of bounds" thresholds that's the main issue.
If you can think of another solution, I would love to hear it.
kalkih
on 21 May 2019
Let's continue the discussion about color thresholds in #91, as the original issue of this topic is resolved.
kalkih
on 21 May 2019
Related issues
 Joezi79
·
4Comments
Joezi79
·
4Comments
 gerard33
·
6Comments
gerard33
·
6Comments
 brezuicabogdan
·
5Comments
brezuicabogdan
·
5Comments
 WhistleMaster
·
6Comments
WhistleMaster
·
6Comments
 clydefrog76
·
6Comments
clydefrog76
·
6Comments
Most helpful comment
Hey everyone, new pre-release available, would appreciate your feedback, should fix the issues discussed here.
https://github.com/kalkih/mini-graph-card/releases/tag/v0.4.3-beta