Micrometer: LoggingMeterRegistry seems to "skip" the publishing of gathered metrics
I have the very unusual case where some metrics seem to go missing, with (seemingly) no other harmful behaviour.
Background:
We are using Spring Boot 2.3.7.RELEASE, which includes adapters for Micrometer 1.5.9.
We are extending LoggingMeterRegistry to perform some pre-processing of the metric information and transform the produced logs to JSON - a constraint set by existing infrastructure. Publication is done every minute (PT1M) after service start-up.
Our publish implementation looks as follows:
    @Override
    protected void publish() {
        if (config.enabled()) {
            this.getMeters().stream()
                    .sorted(Comparator.comparing((Meter m) -> m.getId().getType())
                            .thenComparing(m -> m.getId().getName()))
                    .forEach(meter -> meter.use(
                            gauge -> collectGaugeMetric(gauge, meter),
                            counter -> collectCounterMetric(counter, meter),
                            timer -> collectTimerMetric(timer, meter),
                            summary -> collectDistributionSummaryMetric(summary, meter),
                            longTaskTimer -> collectLongTaskTimerMetric(longTaskTimer, meter),
                            timeGauge -> collectTimeGaugeMetric(timeGauge, meter),
                            functionCounter -> collectFunctionCounterMetric(functionCounter, meter),
                            functionTimer -> collectFunctionTimerMetric(functionTimer, meter),
                            otherMeter -> collectUnspecificMeterMetric(otherMeter, meter)));
        }
    }
where each collect function essentially does something similar to the following:
    this.loggingSink.accept(buildAsJson(formatter.id(), new String[]{METRIC_VALUE},
                        new double[]{duration.getValue()}, new String[]{duration.getUnit()}, meter.getId().getTags()));
Essentially, our extension behaves the same as LoggingMeterRegistry with a few tweaks for properly transforming it to JSON as well handling some edge case values (0, NaN). These logs are pushed to an external service and end up in ElasticSearch / Kibana.
_The behaviour that we are seeing is the following:_
Every so often, it seems that the publication of the metrics just doesn't happen. We noted this because there are very noticeable drops in a metric, e.g.:
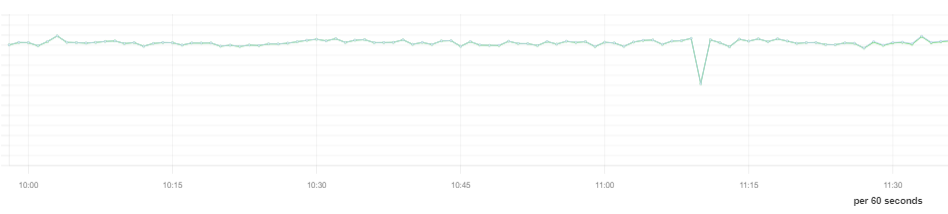
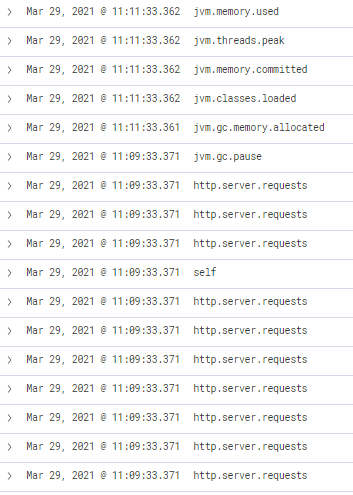
Examining this in more detail, we noticed that the logs are basically missing (note the jump from 11:09 to 11:11 - publication should happen every minute):
Our log driver sends the log events via UDP - so at some point, some of these going missing is not completely unexpected. However, this seems more of an application issue if none of the metrics for that interval are received.
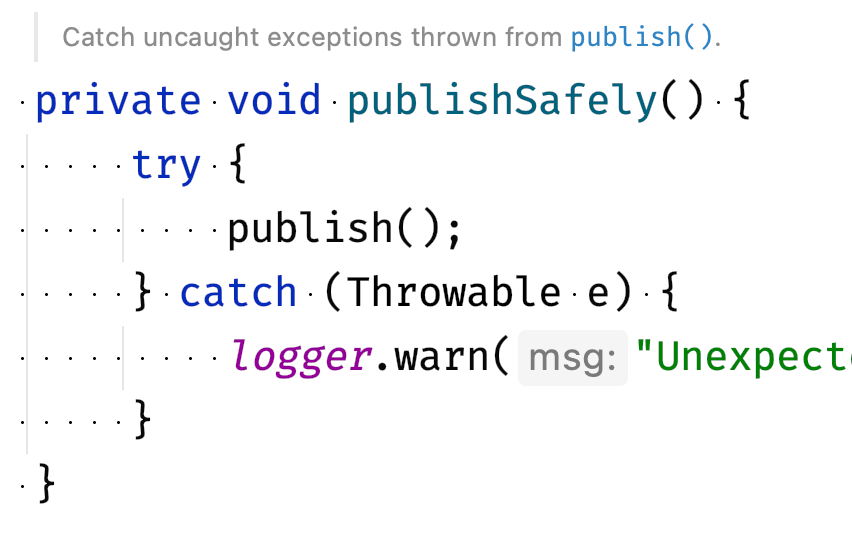
So basically, my question is: how can we debug this behaviour of Micrometer and find out what's going on? It's not completely impossible that our extension code has introduced some sort of issue, but at the very least we are not seeing any of the expected error messages in this case (at the very least, io.micrometer.core.instrument.push.PushMeterRegistry#publishSafely should log a warning if an exception occurred during publishing).
The behaviour, on the surface, looks as if the Thread responsible for the publishing was not woken up or failed to execute the task somehow - but again, we would expect to be able to find logs of this happening. Similarly, high incidental load on the service does not seem to correlate with this behaviour (that we've seen).
Any pointers as to what we could look at?
 filpano
All 4 comments
@filpano It appears publishSafely does actually log a warning:
Anything else you could suggest?
 jkschneider
on 29 Mar 2021
jkschneider
on 29 Mar 2021
Thanks for the reply!
Sorry, I might've worded that a bit ambigiously: yes, publishSafely does log a warning in case of an exception - I meant that I have not seen any of those logs, so I don't expect an exception to have happened. I don't believe that an Error (or other unrecoverable exception) occurred, as we would've noticed this elsewhere.
Can you tell me if there are specific loggers we could set to DEBUG to better diagnose this issue?
filpano
on 30 Mar 2021
Our log driver sends the log events via UDP - so at some point, some of these going missing is not completely unexpected. However, this seems more of an application issue if _none_ of the metrics for that interval are received.
Could be an intermittent network issue, which would affect transmissions around the same time.
Can you tell me if there are specific loggers we could set to
DEBUGto better diagnose this issue?
From the description so far, I can't think of any areas in Micrometer that would provide more insight. Given that future publishes arrive as expected, the meters are still registered and the task scheduler is still scheduling.
You can certainly add logging to your publish implementation, though, since you're extending LoggingMeterRegistry anyways. If the metrics are actually being output to logs, I'd check to see if they are in the logs for the time missing in Elasticsearch. If it isn't going to logs, then you probably need more insight (e.g. logs) into what's happening in the loggingSink consumer.
 shakuzen
on 30 Mar 2021
shakuzen
on 30 Mar 2021
Thanks for the feedback.
Could be an intermittent network issue, which would affect transmissions around the same time.
I initially thought so as well, though in this case I would expect other logs (non-metrics) to be affected as well.
We'll try adding some additional logging to see if we can isolate the problem. In the meantime, I'll close this issue. I'll reopen if my investigation bears any fruit. Thanks!
filpano
on 21 Apr 2021
Related issues
 ericsogm
·
3Comments
ericsogm
·
3Comments
 ffeltrinelli
·
4Comments
ffeltrinelli
·
4Comments
 jonatan-ivanov
·
3Comments
jonatan-ivanov
·
3Comments
 nugnoperku
·
4Comments
nugnoperku
·
4Comments
 ITman1
·
4Comments
ITman1
·
4Comments
Most helpful comment
Thanks for the feedback.
I initially thought so as well, though in this case I would expect other logs (non-metrics) to be affected as well.
We'll try adding some additional logging to see if we can isolate the problem. In the meantime, I'll close this issue. I'll reopen if my investigation bears any fruit. Thanks!