Micrometer: New kafka metrics is really slow
I've an application with a simple Kafka Stream.
I've added latest implementation of KafkaStreamsMetrics.
The loading time of my /prometheus endpoint is very long and consuming a lot of cpu.
I try to troubleshot this and I found this to be really slow :
If I removed the double check, loading time is fine again :
//Double-check if new metrics are registered
checkAndBindMetrics(registry);
With checkAndBindMetrics :
time curl http://kestra:2553/prometheus
real    0m6,209s
user    0m0,015s
sys 0m0,001s
Without checkAndBindMetrics :
time curl http://kestra:2553/prometheus
real    0m0,079s
user    0m0,013s
sys 0m0,013s
Since in Kafka metrics, there is a lot of gauge with a lot of tags (metrics x topic x partition x thread, 300 for my application), I think we must not do this check or used a cache if necessary (didn't see any impact removing this check), this check will fetch all the metrics and use a synchronized methods and will be really slow, since call for every metrics.
 tchiotludo
All 10 comments
Thank you for trying out the new KafkaStreamsMetrics, and sorry for the performance issue. We'll take a look at improving this. /cc @jeqo
 shakuzen
on 27 Mar 2020
shakuzen
on 27 Mar 2020
Thanks @tchiotludo. Yes, keeping Kafka metrics registry updated has been one of the most challenging parts when implementing this instrumentation. This double check is in place to keep the registry up to date when metrics change (e.g. when sending data to/consuming data from a new topic).
This check is under the assumption that the number of metrics will stabilize at some point (e.g. an application sending data to some topics will register all metrics when sending at least one message to all topics it's suppose to, same for consumer). Although this is not optimal, with current API this is the strategy to keep metrics updated.
Could you share a bit more about your use-case? e.g. how many stream-processors/producers/consumers are you instrumenting? how many topics are been used by clients and often this changes? are you getting this performance penalty on every call or only once?
 jeqo
on 27 Mar 2020
jeqo
on 27 Mar 2020
Hello.
It's a simple stream application with this topology (no other process involve except the stream).
Topologies:
   Sub-topology: 0
    Source: KSTREAM-SOURCE-0000000000 (topics: [RAW-ESB-RECEIPTSYNC-V1])
      --> KSTREAM-PEEK-0000000001
    Processor: KSTREAM-PEEK-0000000001 (stores: [])
      --> KSTREAM-MAPVALUES-0000000002
      <-- KSTREAM-SOURCE-0000000000
    Processor: KSTREAM-MAPVALUES-0000000002 (stores: [])
      --> KSTREAM-MAPVALUES-0000000003
      <-- KSTREAM-PEEK-0000000001
    Processor: KSTREAM-MAPVALUES-0000000003 (stores: [])
      --> KSTREAM-FILTER-0000000004
      <-- KSTREAM-MAPVALUES-0000000002
    Processor: KSTREAM-FILTER-0000000004 (stores: [])
      --> KSTREAM-TRANSFORM-0000000005
      <-- KSTREAM-MAPVALUES-0000000003
    Processor: KSTREAM-TRANSFORM-0000000005 (stores: [])
      --> KSTREAM-PEEK-0000000006
      <-- KSTREAM-FILTER-0000000004
    Processor: KSTREAM-PEEK-0000000006 (stores: [])
      --> KSTREAM-MAPVALUES-0000000010, KSTREAM-SINK-0000000007
      <-- KSTREAM-TRANSFORM-0000000005
    Processor: KSTREAM-MAPVALUES-0000000010 (stores: [])
      --> KSTREAM-TRANSFORMVALUES-0000000011
      <-- KSTREAM-PEEK-0000000006
    Processor: KSTREAM-TRANSFORMVALUES-0000000011 (stores: [])
      --> KSTREAM-SINK-0000000012
      <-- KSTREAM-MAPVALUES-0000000010
    Sink: KSTREAM-SINK-0000000007 (topic: RAW-SALES-TICKET-V1)
      <-- KSTREAM-PEEK-0000000006
    Sink: KSTREAM-SINK-0000000012 (topic: EDM-SALES-CUSTOMERRECEIPT-V1)
      <-- KSTREAM-TRANSFORMVALUES-0000000011

  Sub-topology: 1 for global store (will not generate tasks)
    Source: KSTREAM-SOURCE-0000000008 (topics: [EDM-OFFERS-PRODUCT-V1])
      --> KTABLE-SOURCE-0000000009
    Processor: KTABLE-SOURCE-0000000009 (stores: [product_join])
      --> none
      <-- KSTREAM-SOURCE-0000000008
So : 5 topics with 24 partitions.
It's always the same topics, no changed at all on this.
The performance penalty is on all call, not only on first call.
In my app I've 258 gauge generated (x number of tags) = 8910 generated metrics from this kafka stream.
After analyse the checkAndBindMetrics(registry); is called on every collection of the gauge for every gauge, on all hit to the prometheus page (so 8910 called in my case)
since checkAndBindMetrics will collect all metrics and forEach all of them in a synchronized way, it mean that lead to foreach millions of entry at the end of the prometheus call.
tchiotludo
on 27 Mar 2020
thanks @tchiotludo ! this sounds like a bug, will look into it..
jeqo
on 27 Mar 2020
@tchiotludo calling checkAndBindMetrics is not the issue but passing by the first validation on every call is:
    Map<MetricName, ? extends Metric> metrics = metricsSupplier.get();
        if (!currentMeters.equals(metrics.keySet())) { // if this is true on every call then it's a bug
If the set of meter names is different, then it attempts to synchronize values.
I've created a branch with a flag to test this doesn't happen on every call: https://github.com/micrometer-metrics/micrometer/compare/master...jeqo:test-kstreams
Would be possible for you to test against this branch or create a test-case to validate your scenario?
jeqo
on 6 Apr 2020
Thanks @jeqo I was just starting looking to find a way to reproduce the issue with a unit test.
(don't have find for now)
There is no changed in performance with that branch.
To be honest, I can understand why changing a simple bool value would change the behavior, or I don't understand the change ?
I've look deeper the checkAndBindMetrics and you are true with this part : // if this is true on every call then it's a bug
At the start of the application, there is many case where where metrics changed and after it more stable and don't enter the loop.
I try to have a profile :
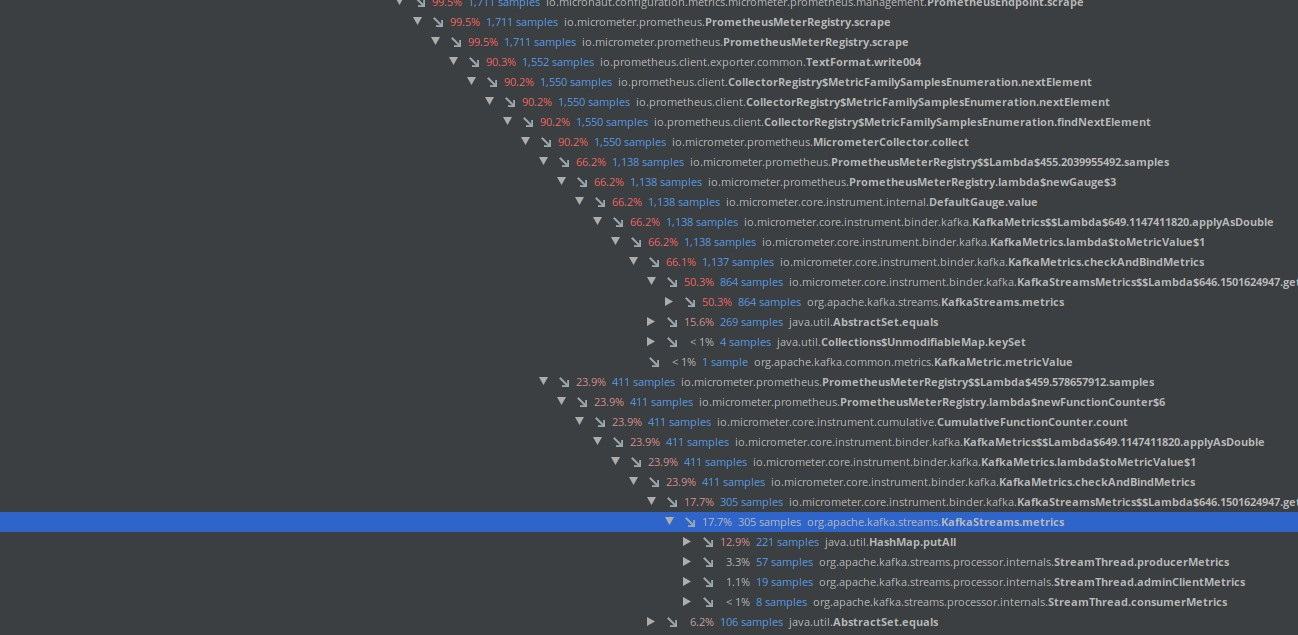
Here we can see that the application if take at least 75% of the time on method :
Map<MetricName, ? extends Metric> metrics = metricsSupplier.get();
since this method is called for every gauge, it's here the bottleneck IMO.
If you look inside this one, for every gauge collect (a lot for a kafka stream and a prometheus integration that displayed all gauge), Kafka client create an hashmap that seems to take a lot of time:

The flamegraph :
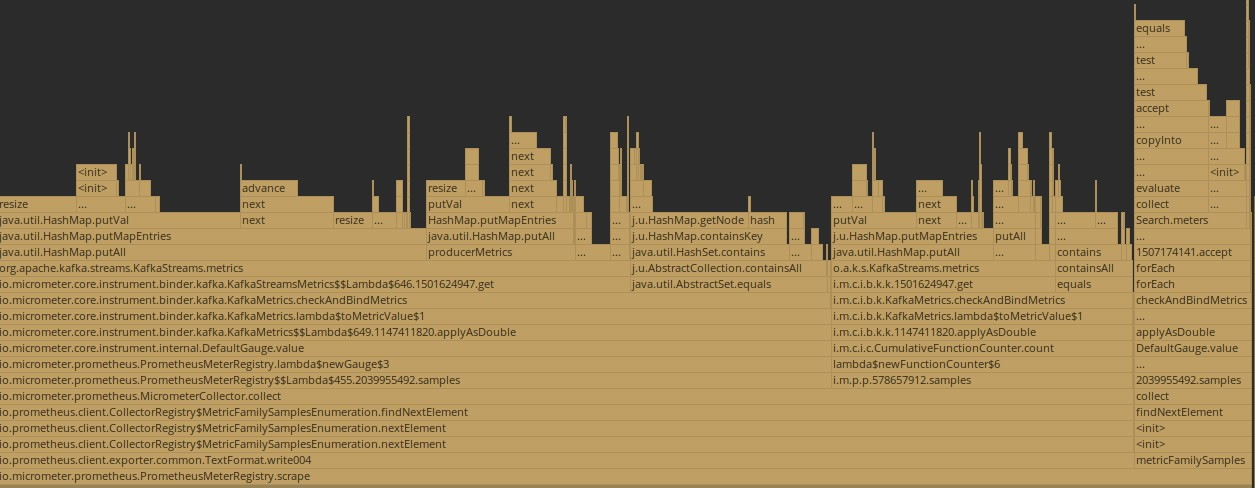
IMO, you should find a way to do not call this method for every metric collect, maybe in a background thread ?
tchiotludo
on 6 Apr 2020
There is no changed in performance with that branch.
To be honest, I can understand why changing a simple bool value would change the behavior, or I don't understand the change ?
No change in performance intended, just added a flag and an IT for Kafka Streams to validate things :)
Thanks for the profiling!
IMO, you should find a way to do not call this method for every metric collect, maybe in a background thread ?
Agree, this will be a better way to deal with this.
jeqo
on 6 Apr 2020
I made a simple draft PR about that.
Tell me what to you think about.
In my case, it fix performance issue and I seems to update tags properly.
In the unit test, I need to add an extra thread sleep, since new metrics are available only when the background task was running (as I understand).
I've a bigger Kafka Application that have some overhead with this metrics, but seems startup & warmup is very long (many producer / consumer / stream on the same application).
Maybe we have to deal that this no concurrent running of the background tasks ?
This allow us to remove the synchronized (this) on checkAndBindMetrics and simply skip a concurrent access on scheduler.scheduleAtFixedRate runnable ?
Wait for your opinion :thinking:
tchiotludo
on 6 Apr 2020
Forgot the concurrent part, I discovered that no concurrent call is possible :
https://stackoverflow.com/a/35498230/1590168
This does not mean that there will not no concurrency over all scheduled tasks. Rather, for each task (created by invocation of scheduleAtFixedRate), the Runnable only executes on one thread at a time - even if the execution time overruns the interval.
So we can remove the synchonized without risk
tchiotludo
on 6 Apr 2020
@tchiotludo thanks! we can follow up on the PR then.
jeqo
on 6 Apr 2020
Related issues
 jonatan-ivanov
·
3Comments
jonatan-ivanov
·
3Comments
 ITman1
·
4Comments
ITman1
·
4Comments
 edeandrea
·
3Comments
edeandrea
·
3Comments
 matsumana
·
4Comments
matsumana
·
4Comments
 exploder86
·
3Comments
exploder86
·
3Comments