Micrometer: Stackdriver metrics not ending up in Stackdriver
Micrometer version: 1.1.0
Spring boot version: 5.1.0
JDK version: 11
There seem to be multiple issues with the Stackdriver integration of Micrometer:
- Metrics are created, but are not under the Global resource it seems. (The ones with global were created using our current solution) See also the screenshot below.

- When debugging, the
StackdriverMeterRegistry#publishcall is just done once. With theLoggingMeterRegistry, the publish-method is called every interval. - Any way of using Spring integration with actuator?
- Feature request: Can we use the prefix for the custom metric, so instead of
custom/jvm/buffer/etcsomething likecustom/{prefix}/jvm/buffer/etc? This makes it much easier to distinguish between services running in the same project. - I'm also missing the documentation right now. ;-)
See also the demo zip I have added for my sample code.
monitoringdemo.zip
 amohabir
All 22 comments
Feature request: Can we use the prefix for the custom metric, so instead of custom/jvm/buffer/etc something like custom/{prefix}/jvm/buffer/etc? This makes it much easier to distinguish between services running in the same project.
@amohabir why not setup common tags in registry?
 IRus
on 6 Dec 2018
IRus
on 6 Dec 2018
So as far as I see the implementation, the common tags are used as additional tags to the metric and has nothing to do with the creation of the metric and its name. That's at least not the way I'm using Stackdriver at the moment. Putting everything under the same metric but with different tags is going to be incredibly messy and you'll have to filter out the tags yourself. Prefixing the custom metrics would make it much easier to distinguish between multiple services running in for example K8S.
See also the following line: https://github.com/micrometer-metrics/micrometer/blob/master/implementations/micrometer-registry-stackdriver/src/main/java/io/micrometer/stackdriver/StackdriverMeterRegistry.java#L363
amohabir
on 6 Dec 2018
@amohabir If you require prefixing, you can accomplish that by overriding the naming convention on StackdriverMeterRegistry.
I don't think we want to encourage it in general. Being able to differentiate metrics by tag is essential to being able to dimensionally aggregate a metric in ways you may not be able to anticipate with prefixing.
We are setting the global resource type on every time series Micrometer creates, so it should be recorded in that way.
 jkschneider
on 12 Dec 2018
jkschneider
on 12 Dec 2018
In regards to naming convention: I get the idea, I do think it's going to look really messy within the resource exploer of Stackdriver UI with just a single metric type on multiple services using the situation I described above.
In regards to the global resource type: This was already the case in version 1.1.0 as well, but it did not end up as global custom metrics. I'll have another look tomorrow to see if the global custom metrics are working as you're expecting.
In regards to Spring Actuator: I actually meant to say how to use Micrometer Metrics without enabling Actuator. :-)
amohabir
on 12 Dec 2018
In regards to Spring Actuator: I actually meant to say how to use Micrometer Metrics without enabling Actuator. :-)
You'd have to wire everything manually. You can follow what MetricsExportAutoConfiguration does in Spring Boot Actuator. Any reason why you can't include actuator?
jkschneider
on 12 Dec 2018
It's not that I can't include actuator, but I just want to keep my options open in regards to the framework and not be tied to Spring or Micronaut for usage.
amohabir
on 14 Dec 2018
and not be tied to Spring or Micronaut for usage.
Understandable. Configuring manually shouldn't be too difficult. Just instantiate the registry and register any MeterBinders that you want. Where frameworks do more is instrumenting their particular technologies and some autoconfiguration.
jkschneider
on 14 Dec 2018
The title of this issue is "Stackdriver metrics not ending up in Stackdriver" but your screenshot makes it appear that the metrics do actually end up in Stackdriver. Perhaps this issue is really about resource type customization? If so, is this a duplicate of #1003?
jkschneider
on 14 Dec 2018
So the metric types are created, but not under global it seems. If I go to the metric, I don't see the statistics. I'll do a test tomorrow to see if this is still the case.
amohabir
on 14 Dec 2018
@amohabir were you able to confirm if data is being sent to stackdriver? I see a number of jvm and tomcat custom metrics that were created after setting up micrometer but in the metric explorer all the metrics show "No data is available for the selected timeframe".
I'm using JDK 8, Spring 2.1.1 and Micrometer 1.1.1 on GKE. I have the stackdriver metric writer role added to the default service account on the GKE nodes but not sure if this is a general stackdriver issue or something specific to GKE.

 breinken
on 8 Jan 2019
breinken
on 8 Jan 2019
@breinken IIRC I also saw the "No data" thing, sometimes for quite a while. And then data magically showed up at some point.
jkschneider
on 8 Jan 2019
@breinken I tried again and get similar results. At least now I'm getting single points for the first time it does the StackdriverMetricRegistry#publish method. I think this is related to the second point of my original post in where it hits that method just once.
Put the log levels to TRACE in either JUL or Logback and you'll see that the logger.trace("publishing batch to stackdriver:\n{}", request); on line 160 is either fired once or not at all.
amohabir
on 9 Jan 2019
So the following line throws an ArrayOutOfBoundsException, when creating a new distribution it seems. After the exception is thrown, the thread is seemingly killed and never used again. This happens when a time series for a meter needs to be created.
amohabir
on 9 Jan 2019
I don't even get the single point of data from the initial publish. Logs show publishing metrics to stackdriver every 1m and then a number of creating metric descriptor entries but I don't get any errors or publish the log referenced here:
breinken
on 9 Jan 2019
Could you try to extract the raw metrics using the cloud-java-monitoring library? I'm interested in seeing whether it's the metrics are actually registered or not.
amohabir
on 9 Jan 2019
I was able to confirm that after filtering down to just a single gauge metric its value properly flowed to Stackdriver. Before that I wasn't able to confirm where the thread was dying, but stepping through the debugger it was indeed dying somewhere before reaching
 itzg
on 10 Jan 2019
itzg
on 10 Jan 2019
We have observed the same behaviour as @itzg
  Iterable<TimeSeries> series = batch.stream()
                    .flatMap(meter -> meter.match(
                            m -> createGauge(publishBatch, m),
                            m -> createCounter(publishBatch, m),
                            m -> createTimer(publishBatch, m),
                            m -> createSummary(publishBatch, m),
                            m -> createLongTaskTimer(publishBatch, m),
                            m -> createTimeGauge(publishBatch, m),
                            m -> createFunctionCounter(publishBatch, m),
                            m -> createFunctionTimer(publishBatch, m),
                            m -> createMeter(publishBatch, m)))
                    .collect(toList());
Execution seems to to hang indefinitely somewhere here. I can verify this by pausing execution state in intellij and can see that thread stackdriver-metrics-publish is parked:
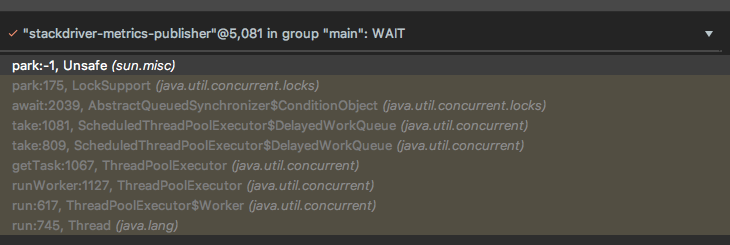
I'm not sure what is going on but i would guess that the toList() on the stream is never completing hence the indefinite park.
 LukeDefeo
on 11 Feb 2019
LukeDefeo
on 11 Feb 2019
As was pointed out before, there is a bug that empty histograms will result in a runtime error like the following which I captured with a modified StackdriverMeterRegistry that surrounded the publish method in a try-catch block to log the exception.
The more generic issue here is that any uncaught exception will not be logged and the scheduled publish task will stop being run. We'll have to consider what to do about that and what behavior is best.
java.lang.IndexOutOfBoundsException: toIndex = 1
    at java.util.ArrayList.subListRangeCheck(ArrayList.java:1012) ~[na:1.8.0_201]
    at java.util.ArrayList.subList(ArrayList.java:1004) ~[na:1.8.0_201]
    at com.example.demo.MyStackdriverMeterRegistry$Batch.distribution(MyStackdriverMeterRegistry.java:404) ~[classes/:na]
    at com.example.demo.MyStackdriverMeterRegistry$Batch.createTimeSeries(MyStackdriverMeterRegistry.java:295) ~[classes/:na]
    at com.example.demo.MyStackdriverMeterRegistry.createTimer(MyStackdriverMeterRegistry.java:213) ~[classes/:na]
    at com.example.demo.MyStackdriverMeterRegistry.lambda$doPublish$3(MyStackdriverMeterRegistry.java:154) ~[classes/:na]
    at io.micrometer.core.instrument.Meter.match(Meter.java:111) ~[micrometer-core-1.1.2.jar:1.1.2]
    at com.example.demo.MyStackdriverMeterRegistry.lambda$doPublish$10(MyStackdriverMeterRegistry.java:151) ~[classes/:na]
    at java.util.stream.ReferencePipeline$7$1.accept(ReferencePipeline.java:267) ~[na:1.8.0_201]
    at java.util.ArrayList$ArrayListSpliterator.forEachRemaining(ArrayList.java:1382) ~[na:1.8.0_201]
    at java.util.stream.AbstractPipeline.copyInto(AbstractPipeline.java:481) ~[na:1.8.0_201]
    at java.util.stream.AbstractPipeline.wrapAndCopyInto(AbstractPipeline.java:471) ~[na:1.8.0_201]
    at java.util.stream.ReduceOps$ReduceOp.evaluateSequential(ReduceOps.java:708) ~[na:1.8.0_201]
    at java.util.stream.AbstractPipeline.evaluate(AbstractPipeline.java:234) ~[na:1.8.0_201]
    at java.util.stream.ReferencePipeline.collect(ReferencePipeline.java:499) ~[na:1.8.0_201]
    at com.example.demo.MyStackdriverMeterRegistry.doPublish(MyStackdriverMeterRegistry.java:161) ~[classes/:na]
    at com.example.demo.MyStackdriverMeterRegistry.publish(MyStackdriverMeterRegistry.java:136) ~[classes/:na]
 shakuzen
on 13 Feb 2019
shakuzen
on 13 Feb 2019
It seems to work with the fix in 1.1.3. :+1:
amohabir
on 26 Feb 2019
Yes Even I am not able to get what should be the filter @amohabir @shakuzen could you please help here
 PA20063329
on 7 Nov 2019
PA20063329
on 7 Nov 2019
The filter should be in the global space under custom/http or custom/jvm.
amohabir
on 7 Nov 2019
Hi,
custom/http and custom/jvm is not working for me.
On Fri, 8 Nov 2019, 00:37 Arvind Mohabir, notifications@github.com wrote:
The filter should be in the global space under custom/http or custom/jvm.
—
You are receiving this because you commented.
Reply to this email directly, view it on GitHub
https://github.com/micrometer-metrics/micrometer/issues/1001?email_source=notifications&email_token=AM5JJL657KIS4GOSTPKU2ITQSRRO3A5CNFSM4GDO5IIKYY3PNVWWK3TUL52HS4DFVREXG43VMVBW63LNMVXHJKTDN5WW2ZLOORPWSZGOEDNPD7I#issuecomment-551219709,
or unsubscribe
https://github.com/notifications/unsubscribe-auth/AM5JJLY75VHFFEYZK6NCKITQSRRO3ANCNFSM4GDO5IIA
.
 shubh0210
on 8 Nov 2019
shubh0210
on 8 Nov 2019
Related issues
 edeandrea
·
3Comments
edeandrea
·
3Comments
 wilkinsona
·
3Comments
wilkinsona
·
3Comments
 ITman1
·
4Comments
ITman1
·
4Comments
 exploder86
·
3Comments
exploder86
·
3Comments
 ericsogm
·
3Comments
ericsogm
·
3Comments
Most helpful comment
I was able to confirm that after filtering down to just a single gauge metric its value properly flowed to Stackdriver. Before that I wasn't able to confirm where the thread was dying, but stepping through the debugger it was indeed dying somewhere before reaching
https://github.com/micrometer-metrics/micrometer/blob/master/implementations/micrometer-registry-stackdriver/src/main/java/io/micrometer/stackdriver/StackdriverMeterRegistry.java#L154