Micrometer: Memory leak in histos in Timers
We use client side percentiles in timers and after running the apps for sometime we see considerable memory usage and finally an OOM on timers. attached is the heap dump leak suspect pic
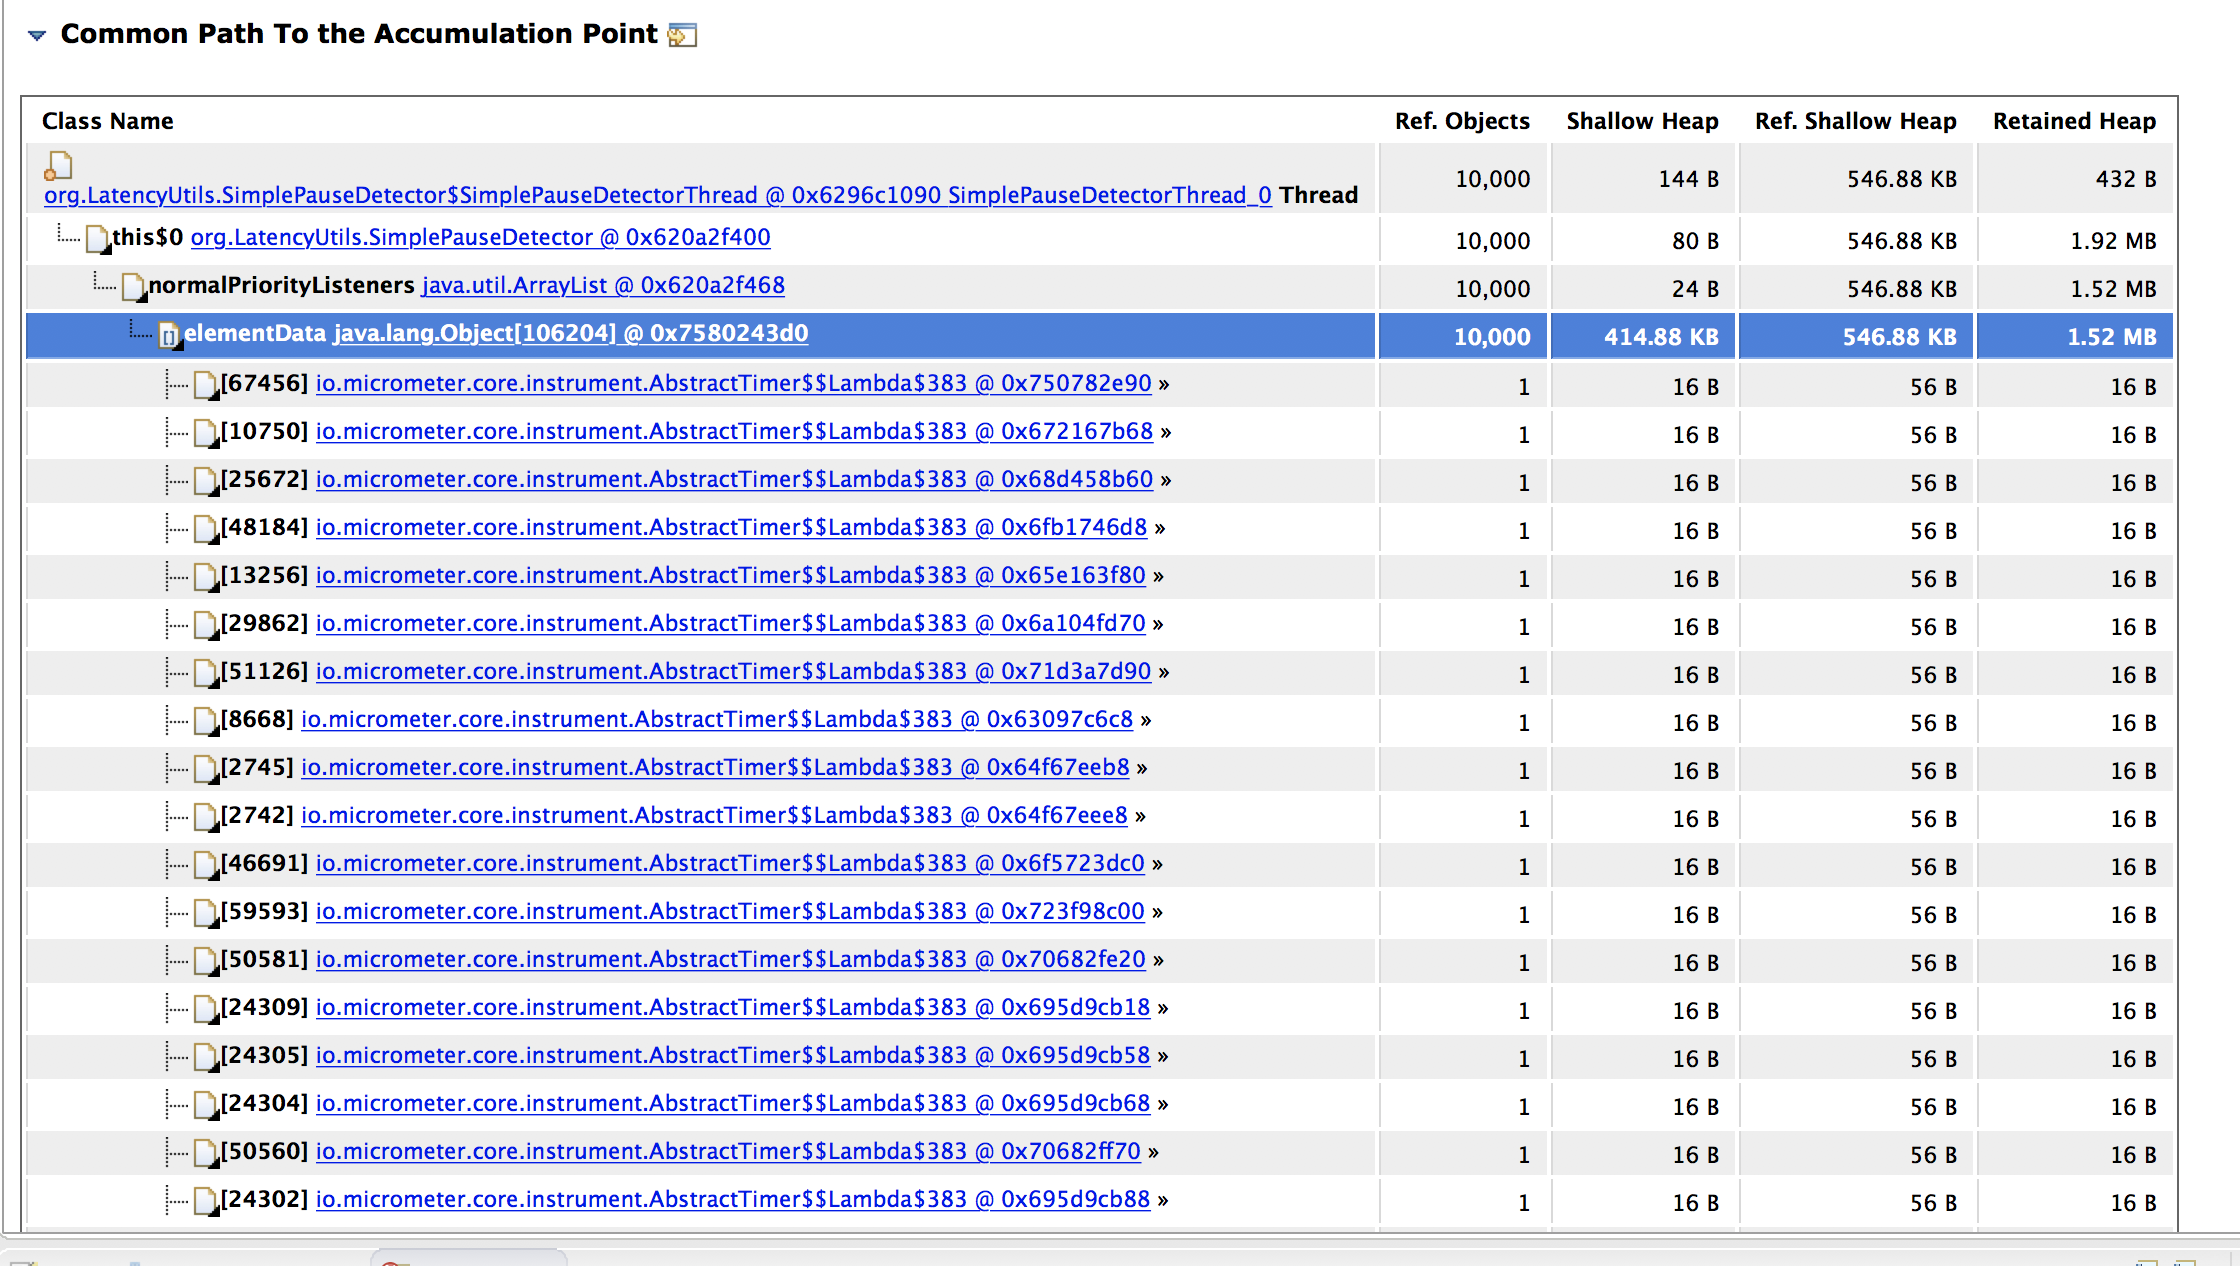
the dump shows about 4GB of accumulated timers.
This is the code we use to create timers.
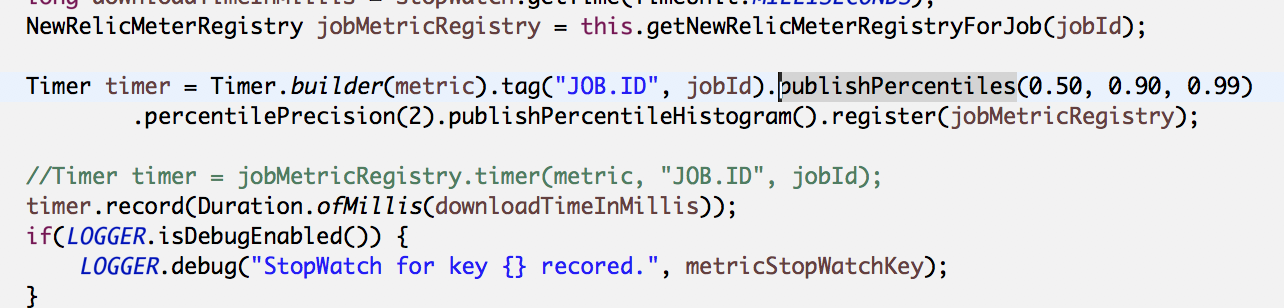
Timers once created are not recreated again but the time recording creates a leak over a few hours of use. we use v1.0.4 of micrometer along with spring boot 2.0.RC6
 vireshwali
All 11 comments
please try with the latest versions of boot and micrometer, 2.0.4.RELEASE and 1.0.6 respectively.
 spencergibb
on 2 Aug 2018
spencergibb
on 2 Aug 2018
I don't have that option at hand right now....the app is in pre production. Changing boot bom will need changes to a lot of other things as well including spring cloud. Is there any solution that i can use in 1.0.4 micrometer and boot 2.0.RC6?
vireshwali
on 2 Aug 2018
There's no such release as spring boot 2.0.0.RC6 https://repo.spring.io/libs-milestone/org/springframework/boot/spring-boot-parent/
Going into production with a release candidate where there is a release seems pretty dangerous.
spencergibb
on 2 Aug 2018
@vireshwali There isn't really a memory leak here, it's just you are creating a _lot_ of unique tag values. Each unique combination of tags requires its own data structure to compute percentiles. If you can't figure out why you are creating so many tags, you can clamp the max tag cardinality with MeterFilter#maximumAllowableTags.
It really never makes sense to use client side percentiles on a metric with more unique tags than can be visualized in a single chart, since there is no way to aggregate percentiles across dimensions.
 jkschneider
on 3 Aug 2018
jkschneider
on 3 Aug 2018
thank @jkschneider
So if i disable client side histograms by adding publishPercentileHistogram(enabled) will that prevent this?
vireshwali
on 3 Aug 2018
I need tags....we use the timers in a scheduled jobs and tags indicate which run of the job had what time stats. So limiting the tags is not correct in my case. Tag here denotes a run of the job. SO if the job runs 100 times a day, it will add 100 tags.
vireshwali
on 3 Aug 2018
That sort of detail is better suited for logs. Metrics are intended to be aggregated
 checketts
on 3 Aug 2018
checketts
on 3 Aug 2018
So if i disable client side histograms by adding publishPercentileHistogram(enabled) will that prevent this?
Tagging with an unbounded tag like job ID is simply going to create memory issues. You can disable percentiles and will get further, but it's still going to catch up with you later. The point of metrics is not to understand how long a particular job took to run but understand the distribution of times for many jobs.
jkschneider
on 3 Aug 2018
Well we were not actually timing the job runs, but the external endpoints hit during an execution of the job run. But your ideology applies there as well......"understand the distribution of times for many jobs"........so i refactored the code to use a single metric and tag for aggregating times to a single target across all job runs. That should do about it, based on what you guys have explained above.
vireshwali
on 3 Aug 2018
Sorry to post on a closed thread, but have a small related question. Does the same ideology and stuff apply on counters and gauges also? I mean they are straight values so once posted to the aggregator, the old values should be available for GC. Are they also retained over tag over an extended period of time?
vireshwali
on 4 Aug 2018
Yes, more tags will take more memory. Counters and Gauges are simpler and won't grow at the same rate, but once a counter of gauge has been created with a given tag it will hang around.
checketts
on 4 Aug 2018
Related issues
 ericsogm
·
3Comments
jkschneider
·
3Comments
ericsogm
·
3Comments
jkschneider
·
3Comments
 ffeltrinelli
·
4Comments
ffeltrinelli
·
4Comments
 matsumana
·
4Comments
matsumana
·
4Comments
 nugnoperku
·
4Comments
nugnoperku
·
4Comments
Most helpful comment
That sort of detail is better suited for logs. Metrics are intended to be aggregated