Micrometer: Add a `LoggingMeterRegistry` that summarizes metrics to a logger
For those cases where we get questions about what metrics are being exported (especially when they don't appear to be showing up in a typical monitoring system).
 jkschneider
All 9 comments
See https://stackoverflow.com/questions/50193287/exporting-metrics-to-files-when-using-spring-boot-2-0
jkschneider
on 16 May 2018
Some random thoughts:
- a log entry per metric or a all in one? (the latter might overwhelm producer and consumer)
- structured (json?) vs plain text? (think structured log analysis and the presentation of more complex metrics like timers/distributionsummaries)
 mweirauch
on 16 May 2018
mweirauch
on 16 May 2018
All good questions :)
- Unless there is a reason not to, I think a log per metric makes sense?
- I can imagine that declarative dimensional pre-aggregation that is needed for CloudWatch and JMX is equally useful here along with a whitelist to pare the list down to just a set of things you care about.
- No idea on format. JSON isn't great for readability, but I suppose benefits structured log analysis? Suggests a configurable format?
I wonder if there is a Splunk person out there that would have an opinion.
jkschneider
on 16 May 2018
No idea on format. JSON isn't great for readability, but I suppose benefits structured log analysis? Suggests a configurable format?
Was just an example. In the golang world most structured loggers seem to go for the key1=value key2=value key3="some whitespace text" style which I tend to find quite readable.
mweirauch
on 16 May 2018
I think a summarized option would be most useful. It could output:
Total Metrics being recorded: 123
or perhaps:
Counters: 50 Timers: 60 LongTaskTimers: 13 Total metrics: 123
I think a details one is also useful, but the summary one could help people answer 'is it working?'
 checketts
on 16 May 2018
checketts
on 16 May 2018
Here's an example of a textual representation of metrics from years past: http://jetm.void.fm/views/monitoring_examples.html
jkschneider
on 17 May 2018
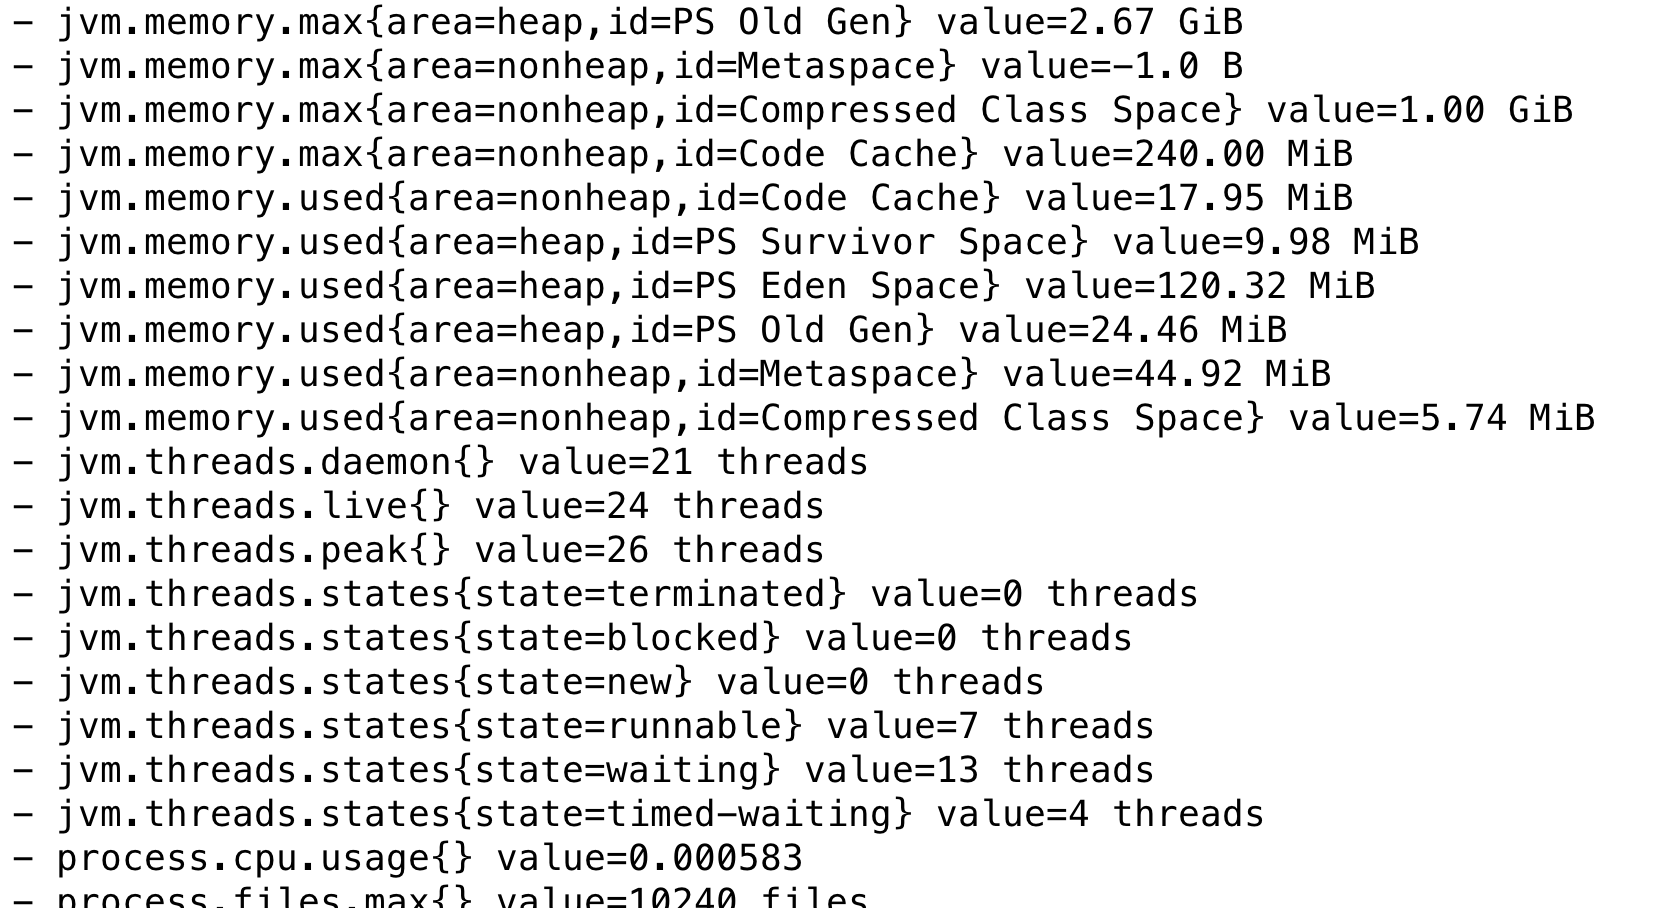
For reference. Here is a dropwizard metric logged output. It's quite readible
2018-07-06 17:00:28,884 [metrics-logger-reporter-thread-1] [INFO] (com.codahale.metrics.Slf4jReporter) type=METER, name=io.dropwizard.jetty.MutableServletContextHandler.async-timeouts, count=0, mean_rate=0.0, m1=0.0, m5=0.0, m15=0.0, rate_unit=events/second

2018-07-06 17:00:28,884 [metrics-logger-reporter-thread-1] [INFO] (com.codahale.metrics.Slf4jReporter) type=TIMER, name=com.impinj.itemsense.agent.TaskRepositoryDao.rawGetNextTaskForReader, count=209, min=145.511, max=7976.1320000000005, mean=858.4775167464114, stddev=1347.4190261974575, median=394.425, p75=594.4985, p95=4190.705, p98=7013.792999999979, p99=7880.0349000000015,
 joeo73
on 6 Jul 2018
joeo73
on 6 Jul 2018
jkschneider
on 27 Oct 2018
hi @jkschneider , when I use LoggingMetricsExportAutoConfiguration, webMvcMetricsFilter would throw an exception, the detail is
https://github.com/micrometer-metrics/micrometer/issues/1431
 JamazRuan
on 21 May 2019
JamazRuan
on 21 May 2019
Related issues
 ericsogm
·
3Comments
ericsogm
·
3Comments
 Comrada
·
4Comments
Comrada
·
4Comments
 samanthacatania
·
4Comments
samanthacatania
·
4Comments
 jonatan-ivanov
·
3Comments
jonatan-ivanov
·
3Comments
 exploder86
·
3Comments
exploder86
·
3Comments
Most helpful comment
For reference. Here is a dropwizard metric logged output. It's quite readible