Micrometer: Micrometer expose process_starttime_seconds in nanoseconds instead of seconds
Issue
Micrometer expose process_starttime_seconds in nanoseconds instead of seconds
Steps to reproduce
When I access prometheus endpoint starttime is:
# HELP process_starttime_seconds The starttime of the Java virtual machine
# TYPE process_starttime_seconds gauge
process_starttime_seconds 1.508362615301E9
Notice that value is in scientific notation (E9). When it value saved into backend, the value will be 1508362615.301 seconds.
Affected versions
v1.0.0-rc.2
 danielmenezesbr
All 10 comments
Prometheus client java for reference: https://github.com/prometheus/client_java/blob/ce76a494acd4f4077f01b6cea40e4329b0d54fac/simpleclient_hotspot/src/main/java/io/prometheus/client/hotspot/StandardExports.java#L72
danielmenezesbr
on 23 Oct 2017
The UptimeMetrics register the Management Beans provided value with the correct TimeUnit (milliseconds) into micrometers MeterRegistry. For the Prometheus integration the value is scaled to seconds.
What is wrong with 1508362615 seconds and 301 milliseconds?
http://www.convert-unix-time.com/?t=1508362615
 mweirauch
on 23 Oct 2017
mweirauch
on 23 Oct 2017
Agree with @mweirauch. It seems to be reporting the correct value. Prometheus' StandardExport also scales this value to seconds.
 jkschneider
on 23 Oct 2017
jkschneider
on 23 Oct 2017
Excuse me for my confusion.
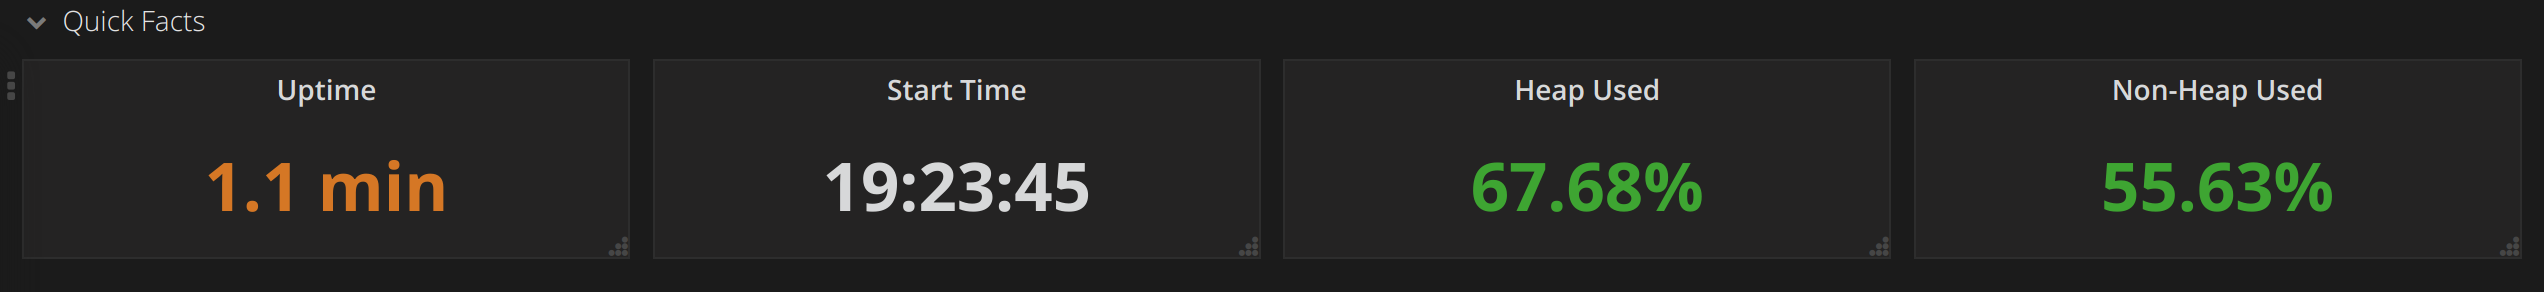
When I looked at the @boeboe dashboard[1], I thought that start time had another meaning. However, the meaning was clear with @mweirauch explanation.
The value of the metric is correct. Apparently there is a problem in dashboard presentation (the dashboard should format the start time value as http://www.convert-unix-time.com/?t=1508362615), but that's another story.
[1] https://grafana.com/api/dashboards/3308/images/2093/image
danielmenezesbr
on 24 Oct 2017
Btw, Grafana 4.6.0 will provide a means of showing dates based on timestamps (ms). (Automatically adding the date when crossing the day boundary.)
mweirauch
on 24 Oct 2017
Grafana 4.6.0 was released:
https://github.com/grafana/grafana/releases/tag/v4.6.0
danielmenezesbr
on 27 Oct 2017
@mweirauch How did you set up your grafana dashboard to show "start time"?
When I tried to configure, my dashboard displays a date of 1970.
My timestamp is 1508424790.
Convert-unix-time show it (http://www.convert-unix-time.com/?t=1508424790):

My dashboard configuration (metric):

My dashboard configuration (option):
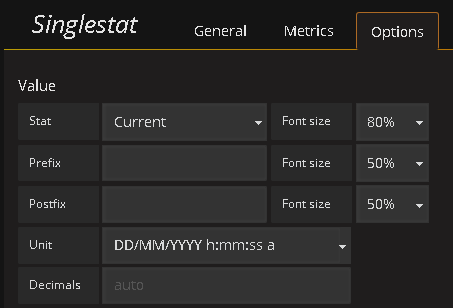
I'm using grafana 4.6.0-stable.
danielmenezesbr
on 31 Oct 2017
@danielmenezesbr
You need to convert to milliseconds:
process_start_time_seconds * 1000
 boeboe
on 1 Nov 2017
boeboe
on 1 Nov 2017
@danielmenezesbr I have updated the dashboard available on grafana.com to reflect the new changes based on Grafana 4.6.0.
boeboe
on 1 Nov 2017
@boeboe Thanks!
danielmenezesbr
on 1 Nov 2017
Related issues
 nickcodefresh
·
3Comments
nickcodefresh
·
3Comments
 adrianboimvaser
·
3Comments
adrianboimvaser
·
3Comments
 matsumana
·
4Comments
matsumana
·
4Comments
 fkoehler
·
3Comments
fkoehler
·
3Comments
 wilkinsona
·
3Comments
wilkinsona
·
3Comments
Most helpful comment
Grafana 4.6.0 was released:
https://github.com/grafana/grafana/releases/tag/v4.6.0