Meteor: [1.6.1] 100% CPU on Ubuntu server, caused by client?
We are experiencing consistent 100% CPU usage on one of our Meteor deployments. This issue seems to have appeared out of nowhere (not after a of a new version).
What we already tried: create a new server with the same specs and deploy to that server. When we switch over our DNS to the new server at first all is well; but (we think) when a particular client connects the Node process starts using 100% CPU.
We're deploying Meteor to a Ubuntu host using MUP (which instantiates a Docker container consisting of the meteord base image and our bundle). The image has NodeJS 8.9.4 and NPM 5.6.0.
Any pointers as to how to pinpoint this issue would be greatly appreciated!
We believe this is the most interesting portion of the V8 profiler we ran on the logs (https://paste2.org/zPsHbDya):
   ticks parent  name
  2420054   92.5%  /opt/nodejs/bin/node
  219101    9.1%    /opt/nodejs/bin/node
  165262   75.4%      Builtin: ArrayMap
  57108   34.6%        LazyCompile: *changeField /bundle/bundle/programs/server/packages/ddp-server.js:287:25
  57067   99.9%          LazyCompile: *added /bundle/bundle/programs/server/packages/mongo.js:3650:23
  57042  100.0%            LazyCompile: *<anonymous> packages/meteor.js:1231:19
  48280   29.2%        LazyCompile: *EJSON.clone.v /bundle/bundle/programs/server/packages/ejson.js:646:15
  47783   99.0%          Function: ~Object.keys.forEach.key /bundle/bundle/programs/server/packages/ejson.js:697:26
  47783  100.0%            Builtin: ArrayForEach
  23827   14.4%        LazyCompile: *Object.keys.forEach.key /bundle/bundle/programs/server/packages/ejson.js:320:28
  23616   99.1%          LazyCompile: *added /bundle/bundle/programs/server/packages/mongo.js:3650:23
  23616  100.0%            LazyCompile: *<anonymous> packages/meteor.js:1231:19
  22206   13.4%        LazyCompile: *Object.keys.forEach.key /bundle/bundle/programs/server/packages/ejson.js:697:26
  22205  100.0%          Builtin: ArrayForEach
  15641   70.4%            LazyCompile: *_sendAdds /bundle/bundle/programs/server/packages/mongo.js:1913:23
   3405   15.3%            LazyCompile: *EJSON.clone.v /bundle/bundle/programs/server/packages/ejson.js:646:15
   2442   11.0%            LazyCompile: *<anonymous> /bundle/bundle/programs/server/packages/mongo.js:1782:34
   6566    4.0%        Builtin: ArrayForEach
   4420   67.3%          LazyCompile: *_sendAdds /bundle/bundle/programs/server/packages/mongo.js:1913:23
   4420  100.0%            Function: ~<anonymous> /bundle/bundle/programs/server/packages/mongo.js:1782:34
   2082   31.7%          LazyCompile: *<anonymous> /bundle/bundle/programs/server/packages/mongo.js:1782:34
   2082  100.0%            LazyCompile: *<anonymous> packages/meteor.js:1231:19
   3827    2.3%        RegExp: ([!#\\$%&'\\*\\+\\-\\.\\^_`\\|~0-9a-z]+)(?:=(?:([!#\\$%&'\\*\\+\\-\\.\\^_`\\|~0-9a-z]+)|"((?:\\\\[\\x00-\\x7f]|[^\\x00-\\x08\\x0a-\\x1f\\x7f"])*)"))? {9}
   3812   99.6%          Function: ~Object.keys.forEach.key /bundle/bundle/programs/server/packages/ejson.js:697:26
   3812  100.0%            Builtin: ArrayForEach
  25601   11.7%      LazyCompile: *ObserveHandle.stop /bundle/bundle/programs/server/packages/mongo.js:1955:41
  21756   85.0%        Function: ~<anonymous> /bundle/bundle/programs/server/packages/mongo.js:3663:25
  21756  100.0%          LazyCompile: *<anonymous> packages/meteor.js:1231:19
  19776   90.9%            Function: ~<anonymous> /bundle/bundle/programs/server/packages/ddp-server.js:1298:32
   1978    9.1%            LazyCompile: *<anonymous> /bundle/bundle/programs/server/packages/ddp-server.js:1298:32
   2805   11.0%        LazyCompile: *baseUniq /bundle/bundle/programs/server/npm/node_modules/lodash.union/index.js:742:18
   2805  100.0%          LazyCompile: *<anonymous> packages/meteor.js:1231:19
   2805  100.0%            Function: ~<anonymous> /bundle/bundle/programs/server/packages/ddp-server.js:1298:32
   1040    4.1%        LazyCompile: *<anonymous> /bundle/bundle/programs/server/packages/mongo.js:3663:25
   1040  100.0%          LazyCompile: *<anonymous> packages/meteor.js:1231:19
    535   51.4%            Function: ~<anonymous> /bundle/bundle/programs/server/packages/ddp-server.js:1298:32
    505   48.6%            LazyCompile: *<anonymous> /bundle/bundle/programs/server/packages/ddp-server.js:1298:32
   2944    1.3%      LazyCompile: *v.map.value /bundle/bundle/programs/server/packages/ejson.js:678:18
   2607   88.6%        Function: ~Socket._writeGeneric net.js:708:42
   2607  100.0%          LazyCompile: *Socket._write net.js:785:35
   1686   64.7%            LazyCompile: *ondata internal/streams/legacy.js:14:18
    495   19.0%            LazyCompile: *Connection.write /bundle/bundle/programs/server/npm/node_modules/meteor/npm-mongo/node_modules/mongodb-core/lib/connection/connection.js:527:38
    419   16.1%            LazyCompile: *clearBuffer _stream_writable.js:469:21
    179    6.1%        Builtin: ArrayMap
     57   31.8%          LazyCompile: *EJSON.clone.v /bundle/bundle/programs/server/packages/ejson.js:646:15
     52   91.2%            Function: ~Object.keys.forEach.key /bundle/bundle/programs/server/packages/ejson.js:697:26
      4    7.0%            Function: ~<anonymous> /bundle/bundle/programs/server/packages/mongo.js:1879:36
      1    1.8%            Function: ~changeField /bundle/bundle/programs/server/packages/ddp-server.js:287:25
     55   30.7%          LazyCompile: *changeField /bundle/bundle/programs/server/packages/ddp-server.js:287:25
     55  100.0%            LazyCompile: *added /bundle/bundle/programs/server/packages/mongo.js:3650:23
     31   17.3%          LazyCompile: *Object.keys.forEach.key /bundle/bundle/programs/server/packages/ejson.js:697:26
     31  100.0%            Builtin: ArrayForEach
     20   11.2%          LazyCompile: *Object.keys.forEach.key /bundle/bundle/programs/server/packages/ejson.js:320:28
     20  100.0%            LazyCompile: *added /bundle/bundle/programs/server/packages/mongo.js:3650:23
      5    2.8%          Builtin: ArrayForEach
      5  100.0%            LazyCompile: *_sendAdds /bundle/bundle/programs/server/packages/mongo.js:1913:23
      4    2.2%          RegExp: ([!#\\$%&'\\*\\+\\-\\.\\^_`\\|~0-9a-z]+)(?:=(?:([!#\\$%&'\\*\\+\\-\\.\\^_`\\|~0-9a-z]+)|"((?:\\\\[\\x00-\\x7f]|[^\\x00-\\x08\\x0a-\\x1f\\x7f"])*)"))? {9}
      4  100.0%            Function: ~Object.keys.forEach.key /bundle/bundle/programs/server/packages/ejson.js:697:26
      4    2.2%          LazyCompile: *<anonymous> /bundle/bundle/programs/server/packages/mongo.js:1879:36
      4  100.0%            Function: ~SQp._run packages/meteor.js:851:21
      3    1.7%          LazyCompile: *callback zlib.js:447:20
      3  100.0%            Builtin: ArrayForEach
     60    2.0%        Function: ~<anonymous> /bundle/bundle/programs/server/packages/ddp-server.js:740:22
 KoenLav
All 120 comments
Not sure about the cause but perhaps try testing with a Galaxy deploy and see if you can recreate the problem there. Would add some extra data to help triangulate down to the root cause.
From the logs it looks like mongo communication is involved somehow so perhaps check the metrics on your mongo cluster and see if anything looks suspicious.
When you say "when a particular client connects" did you mean one particular customer or "one client" more like, "our desktop client"? If one particular client, have you been able to reproduce it in a test environment using their credentials/configuration?
 alanning
on 6 Apr 2018
alanning
on 6 Apr 2018
@alanning our server setup consists out of multiple microservices (backoffice, operational, scheduled tasks, api, customer, etc.) and is hosted on DigitalOcean. Our database instance is hosted with MongoDB Atlas.
We managed to resolve the issue by either (1) shutting down ALL our production servers which were connected to MongoDB (at the same time) or (2) logging out all connected users (by updating all users). At this point we were spray painting with possible solutions, hoping something would stick.
Before doing so we tried several other options like shutting down our services one by one, but once the container which was experiencing the issue spun up again the issue reappeared (even when we deployed an instance on a completely new server). In addition to that we assumed some kind of infinite loop in our code (resulting from poorly written Collection Hooks) could be the issue, but none of these changes did any good.
I did not mean a specific client (like Cordova/Browser/Desktop) but rather one specific session on one device. This is what we assumed as the issue reappeared x seconds after restarting the instance where x would be longer if we left down the microservice longer (which would result in a longer timeout between reconnect attempts).
Judging from the lodge we concluded there would have to be a MongoDB related issue as well, we checked the logs and found some (limited, non-recurring) limited key errors which appeared right before the issue started, but we have not been able to reproduce this behavior.
As the issue is solved for us now I'm going to leave it at this, but it might be worthwhile to investigate which issues could result from a client continuously writing objects with duplicate keys to MongoDB (as this is the most probable scenario judging from all the details).
KoenLav
on 8 Apr 2018
Today the issue re-appeared; we would really like to find the source of this issue.
Any thoughts on finding the cause would be appreciated!
KoenLav
on 10 Apr 2018
What version of Meteor are you running?
I would work towards reproducing the issue by replicating that problem client's data/session in your test environment. Once you can reproduce it then you can start isolating different parts to find the culprit.
Does MongoDB Atlas provide any relevant metrics for the timeframe in question?
alanning
on 11 Apr 2018
Meteor 1.6.1.
We too would like to replicate the issues, but other than that it will probably have something to do with MongoDB. At present we don't even know how to reproduce the issue in production. We have a specific timestamp when the issue (at least, the high CPU load resulting from the issue) started, so we might be able to get some more information from the logs.
To that effect I searched all our Collections looking for objects which were created/updated within 3 minutes of the issue appearing (the CPU usage increases from 5% to 100% in a matter of seconds), but to no avail.
In addition to that we looked through the MongoDB Atlas metrics but they didn't show any significant increase in CPU, bandwidth, connections, whatsoever. This makes us think that, whereas the problem might be caused by some specific connection/data, the result is only measurable within the code. Could it be that Meteor think a document is updated all the time and attempts to publish changes to all clients, but it is actually not?
Are there any other profilers we could run or logging we could enable to further narrow down the issue?
KoenLav
on 11 Apr 2018
I would like to join in this investigation. I too am experiencing a similar issue. Production servers jump to 100% at random moments, but always during working hours.
First I thought I had a memory leak, or indeed an infinite loop somewhere. But after testing & debugging for a week, I still haven't found a thing.
Even putting the server under load with artillery doesn't bring it to his knees.
Are there any other profilers we could run or logging we could enable to further narrow down the issue?
Any handles you can give us would be highly appreciated. Running Meteor 1.6.1 on Ubuntu via PM2. pm2 restart all "fixes" the issue for some time.
 smeijer
on 11 Apr 2018
smeijer
on 11 Apr 2018
I have a sneaking suspicion that the issues listed here are caused by Fiber spikes. See https://github.com/meteor/meteor/issues/7747 for more details. This is a known issue and still happens with current day Meteor (the repro in that issue still shows the Fiber spike after updating to 1.6.1.1). That issue was closed due to inactivity, but if anyone is interested in digging into this further, the details in that issue should help.
 hwillson
on 11 Apr 2018
hwillson
on 11 Apr 2018
@hwillson interesting!
In our particular app clients are subscribed to +/- 15 collections out of which an entry into one collection causes a cascading insert and update on other collections.
Is there some way to easily try out the patch which sets the fiber pool size?
Also could you sneak in a peek into the logs (or is your suspicion already based on those?) and share what you make out of of them?
To me it looks like Meteor thinks that there are constantly changes in the data, while this is in actuality not the case.
KoenLav
on 11 Apr 2018
@smeijer just to make sure we are experimenting the same issue; the CPU load increases to 100% within a matter of seconds and remains there.
The issue disappeared upon restarting Meteor (but in our initial scenario it resurfaced right away, whereas now it has been gone for a day).
Do you also make use of quite a few subscriptions, or update a significant amount of documents in a collection to which some clients are subscribed at some point?
KoenLav
on 11 Apr 2018
@KoenLav,
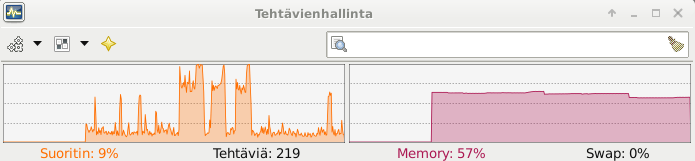
Yes. The CPU increases to 100% within a matter of seconds. Below you'll find a CPU log of the past two weeks. I've tried letting it run, to see if it come down it selves, but that didn't happen.
(50% is 100% of 1 of the 2 cores)

There is no other process running beside the meteor bundle and pm2. And you'll see on the chart that there is power enough for normal operations.
Yes, the issue disappeared upon restarting Meteor pm2 restart x (where x is 0 or 1, depending on which instance is stuck). I'm running a total of 6 instances divided over 3 servers. I never had two servers "crash" at the same time, but after a restart of the stucked one, there is a bigger chance that another instance does get stuck in the next couple of hours. But this isn't a given fact.
Regarding to the subscriptions; I'm in a process of migrating away from publish / subscribe / methods, while going full graphql. So there aren't a lot of subscriptions in my application, but the ones that are still there, use quite a bit of data (geojson transport).
I'm not sure what you feel significant, but I wouldn't say so. I have a write-heavy application. And yes, these are the "busy hours". But you see on my CPU chart that there should be performance enough.
smeijer
on 11 Apr 2018
Is there a way I can count / log the number of active fibers? To see if / when I reach the 120 named in the Fiber thread?
smeijer
on 11 Apr 2018
@KoenLav It's just a hunch - I'll take a closer look at the logs shortly.
@smeijer Try logging Fiber.fibersCreated:
import Fiber from 'fibers';
console.log(`Current fiber count: ${Fiber.fibersCreated}`);
@hwillson thanks! One questions: does this log the number of active fibers or the number of fibers created (all time)?
I believe it to be the latter, according to this: https://github.com/laverdet/node-fibers/issues/85
But I'm not entirely sure how Meteor handles Fibers locally, so these numbers might in fact be the same thing.
@smeijer this might also be interesting: https://github.com/laverdet/node-fibers/issues/91
KoenLav
on 11 Apr 2018
Added:
import Fiber from 'fibers';

setInterval(() => {
  console.log(`Current fiber count: ${Fiber.fibersCreated}`);
}, 60 * 1000);
To our /server/main.js file in production. Let's see what happens.
KoenLav
on 11 Apr 2018
I'll read those two issues tomorrow, but to share some results already. After a cold start, and just clicking away in my local dev environment:
fibersCreated 331
poolsize 120

heapUsed 108.173 MiB
heapTotal 118.438 MiB
rss 148.547 MiB
I don't see the fibersCreated go down after closing my browser session. So at first sight, it seems to be an 'all-time'. But it got there so fast, that it can still be a problem. I have no idea. A restart, and opening directly on a specific page, resulted in 271 fibers under the fibersCreated property. (still not saying anyting if they are being disposed / reused correctly.)
I do use async / await heavily on the graphql part. And triggering 'fire and forget' actions there. (mongo update, and not waiting for results).
import numeral from 'numeral';
import Fiber from 'fibers';

import logger from '../logger';

setInterval(() => {
  const { rss, heapTotal, heapUsed } = process.memoryUsage();
  const { fibersCreated, poolSize } = Fiber;

  log.trace(
    { rss, heapTotal, heapUsed, fibersCreated, poolSize },
    'heapUsed %s heapTotal %s rss %s fibers %d poolSize %d',
    numeral(heapUsed).format('0.000 ib'),
    numeral(heapTotal).format('0.000 ib'),
    numeral(rss).format('0.000 ib'),
    fibersCreated,
    poolSize,
  );
}, 5000).unref();
I'm using Meteor 1.6.0.1, having same problems, adding this comment to follow this issue.
 xet7
on 11 Apr 2018
xet7
on 11 Apr 2018
@xet7 does your problem also occur randomly and do you suspect it to be related to subscriptions/observing changes?
Do you have any more information that is relevant from the other thread(s)?
KoenLav
on 12 Apr 2018
@KoenLav
Setup is like mentioned at https://github.com/wekan/wekan-mongodb/issues/2#issuecomment-380606330
Also when tested with 4 EC2 instances without Docker, result is same, node has 100% CPU usage.
Oplog should be setup correctly, I'm not sure.
Problem is with Wekan https://wekan.github.io and all other Meteor.js projects, on powerful servers, and on Raspberry Pi small projects, so all new projects start with some other than Meteor.js, because of problems with Meteor.js CPU usage.
xet7
on 12 Apr 2018
i found that
https://bugs.chromium.org/p/v8/issues/detail?id=5338#c7
https://github.com/sandstorm-io/node/commit/0b882566078cb14537f9f91220f1a58530fa7687
 aboire
on 12 Apr 2018
aboire
on 12 Apr 2018
@hwillson could you provide some more information on what sort of scenario's could cause such a Fiber spike?
This could help us find the offending code portions in our application code.
KoenLav
on 12 Apr 2018
Is this still the same fiber issue that can be reproduced with this?
https://github.com/meteor/meteor/issues/7747#issuecomment-247055405
xet7
on 12 Apr 2018
So I guess this is a way to track the currently active fibers:
import numeral from 'numeral';
import Fiber from 'fibers';

const runFiber = Fiber.prototype.run;

Fiber.fibersActive = 0;
Fiber.prototype.run = function runWithCount(...args) {
  const wasStarted = this.started;

  try {
    runFiber.apply(this, args);
  } finally {
    Fiber.fibersActive +=
      wasStarted && !this.started ? -1 : !wasStarted && this.started ? +1 : 0;
  }
};

setInterval(() => {
  const { fibersActive, fibersCreated, poolSize } = Fiber;

  console.log(`fibersActive ${fibersActive}/${poolSize} fibersCreated ${fibersCreated}`);
}, 5000).unref();
Logging statements like:
fibersActive 1/120 fibersCreated 3
fibersActive 5/120 fibersCreated 8
fibersActive 10/120 fibersCreated 17
fibersActive 13/120 fibersCreated 17
fibersActive 21/120 fibersCreated 264
fibersActive 21/120 fibersCreated 386
I had a case where fibersActive was -1, but I guess there are already active fibers before the wrap is applied. Not a big issue for now. As it's still giving useful insights, just with a 1 or 2 offset.
smeijer
on 12 Apr 2018
I tried the repro code here:
https://github.com/jparyani/meteor-fiber-repro
1) Upgraded to Meteor 1.6.0.1:
meteor update --release 1.6.0.1
2) Added babel
meteor npm install --save babel-runtime
3) Started it
meteor run
4) Webbroser at http://localhost:3000 has this web interface:

5) Clicked left button, and then clicked right button. Those are visible as left and right spike at orange CPU usage area:
6) On console there is this log:
$ meteor run
[[[[[ ~/repos/meteor-fiber-repro ]]]]]

=> Started proxy.
=> A patch (Meteor 1.6.1.1) for your current release is available!
   Update this project now with 'meteor update --patch'.
=> Started MongoDB.
I20180412-11:05:12.832(3)? 4
=> Started your app.

=> App running at: http://localhost:3000/
I20180412-11:05:17.832(3)? 5
I20180412-11:05:22.833(3)? 5
I20180412-11:05:27.834(3)? 5
I20180412-11:05:32.835(3)? 5
I20180412-11:05:37.835(3)? 5
I20180412-11:05:42.835(3)? 5
I20180412-11:05:47.835(3)? 5
I20180412-11:05:52.835(3)? 5
I20180412-11:05:57.836(3)? 5
I20180412-11:06:02.837(3)? 5
I20180412-11:06:07.837(3)? 5
I20180412-11:06:12.837(3)? 5
I20180412-11:06:17.837(3)? 5
I20180412-11:06:22.837(3)? 5
I20180412-11:06:27.838(3)? 5
I20180412-11:06:32.838(3)? 5
I20180412-11:06:37.838(3)? 5
I20180412-11:06:42.841(3)? 5
I20180412-11:06:47.842(3)? 5
I20180412-11:06:52.843(3)? 5
I20180412-11:06:57.844(3)? 5
I20180412-11:07:02.845(3)? 5
I20180412-11:07:07.845(3)? 5
I20180412-11:07:12.846(3)? 5
I20180412-11:07:17.847(3)? 5
I20180412-11:07:22.848(3)? 5
I20180412-11:07:27.850(3)? 5
I20180412-11:07:32.850(3)? 5
I20180412-11:07:38.680(3)? 5
I20180412-11:07:43.681(3)? 5
I20180412-11:07:48.683(3)? 5
I20180412-11:07:53.684(3)? 5
I20180412-11:07:58.685(3)? 5
I20180412-11:08:03.815(3)? 540
I20180412-11:08:12.340(3)? 4420
I20180412-11:08:15.584(3)? set complete
I20180412-11:08:17.384(3)? 9155
I20180412-11:08:22.397(3)? 9155
I20180412-11:08:27.399(3)? 9155
I20180412-11:08:32.398(3)? 9155
I20180412-11:08:34.261(3)? unset complete
I20180412-11:08:37.398(3)? 9155
I20180412-11:08:42.399(3)? 9155
I20180412-11:08:47.399(3)? 9155
I20180412-11:08:52.399(3)? 9155
I20180412-11:08:57.400(3)? 9155
I20180412-11:08:58.500(3)? set complete
I20180412-11:09:03.110(3)? 12354
I20180412-11:09:08.499(3)? 17928
I20180412-11:09:13.500(3)? 17959
I20180412-11:09:18.502(3)? 17959
I20180412-11:09:23.501(3)? 17959
I20180412-11:09:28.502(3)? 17959
I20180412-11:09:33.503(3)? 17959
I20180412-11:09:38.504(3)? 17959
I20180412-11:09:43.505(3)? 17959
Running artillery on my local environment. I'm simulating the HTTP get request to get an initial page, which is using onPageLoad to preload a redux state (only fetching the current user by logintoken), and fetching data through the matching graphql endpoint. Something like:
- http.get /blog/$id
- graphql.query blog(id: $id)
- http.get /blog/$id/comments
- graphql.query comments(blogId: $id)
Turns out, the number of fibers is running trough the roof. Although, it does return below the pool size, the used memory does not.
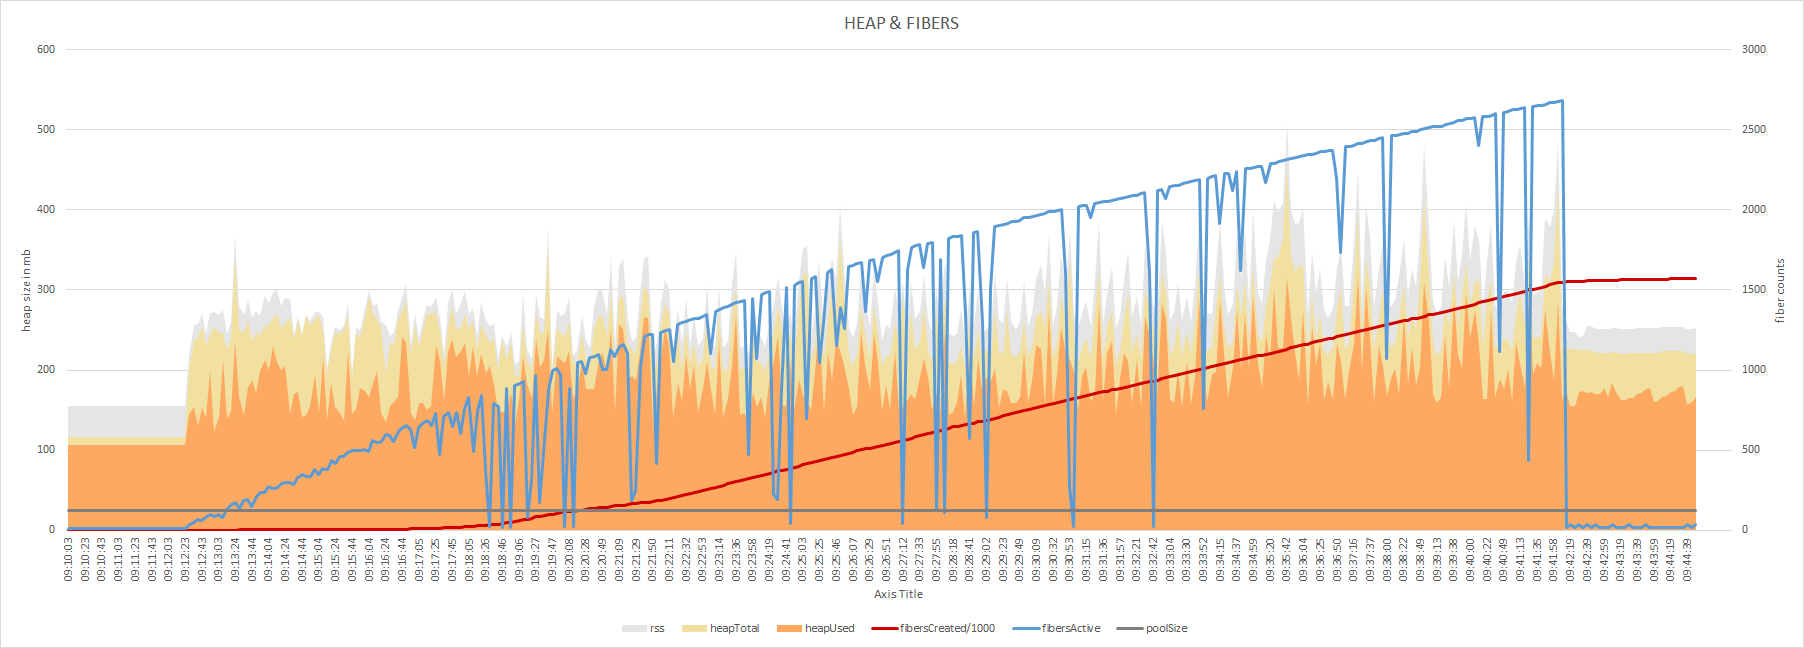
I've scaled the fibersCreated down by a factor 1000 to keep the chart readable.
Worth mentioning, I've killed artillery before it finished. Because it started to be terribly slow. I'll try tuning the number down. But I think it will be useful to run this code in production, to get some real data.
smeijer
on 12 Apr 2018
So I've been logging production for a day now, and the number of active fibers are settled around ~25. (based on the code posted above).
In the meanwhile, I've also scaled one server up. I've been running the same amount of instances as the server has cores (pm2 instances: max), and I've now scaled one server up to have 1 spare CPU (pm2 instances: -1).
I've been playing a bit with the --max_old_space_size flag on my dev machine, and when that's to low, I'm getting the same symptoms. So it looks like the garbage becomes just too much for the CPU to handle.
That does also confirm another scenario. To debug this issue, I've implemented a pmx trigger to create a heap snapshot and a heap profile on request. But when requesting a heap snapshot the CPU has a big chance of getting stuck. Not all the time, but 1 out of 4 for sure.
As I've been restarting the services quite often these days to implement debugging options/logging statements, the services haven't gone stale in the last 24 hours. I guess I have to wait now.
smeijer
on 13 Apr 2018
Stable at 37 or 38 fibers here.
KoenLav
on 13 Apr 2018
Creating a heap-dump in dev mode (on a windows pc), throws an exception here.
Exited with code: 3221225477
I've searched for this error, and found a good explanation at stackoverflow
The error code 3221225477 is 0xC0000005 in hex, which on Windows is:
define STATUS_ACCESS_VIOLATION ((NTSTATUS)0xC0000005L)
Access violation is Windows' version of "segmentation fault", which simply said means that the program tried to access a memory which is not allocated. This can happen for a lot of different reasons, but mostly (if not always) is a bug in the program.
So can this issue be related to the other segmentation bugs reported here? There are a lot lateley due to a bug in node. I have no idea why I don't see this error code on production. But the case is, on my dev machine a heap-dump kill's meteor, with this error, and restarts the instance.
On production, sometimes the snapshot works, sometimes it causes the CPU to hang at 100%. But when the snapshot was made successful, the process is restarted somehow. Can a segmentation fault cause a CPU to get stuck at 100%?
For reference, my heap-dumping-code:
import heapDump from 'heapdump';
import path from 'path';

export function writeSnapshot(savePath) {
  try {
    const filename = `${Date.now()}.heapsnapshot`;

    heapDump.writeSnapshot(path.join(savePath, filename), () => {
      console.log('Saved heap snapshot to disk.');
    });
  } catch (ex) {
    console.error('Err saving heap snapshot');
  }
}

setTimeout(() => {
  setInterval(() => {
    writeSnapshot(process.env.PROFILE_DATA_PATH);
  }, ~~process.env.HEAP_DUMP_INTERVAL * 1000).unref();
}, ~~process.env.HEAP_DUMP_INTERVAL * 1000);
Confirmed that dumping memory on production also causes a segmentation fault. This doesn't make debugging easier 😕
After attaching the debugger via --inspect, and creating a heapdump:
exited with code [0] via signal [SIGSEGV]
smeijer
on 14 Apr 2018
If this is the fiber problem, it should be really obvious in a profile taken using Linux's perf tool. See my old blog post for background (including screenshots of what the profile looks like): https://sandstorm.io/news/2016-09-30-fiber-bomb-debugging-story
I maintain a patched version of Node that fixes the performance problem here (currently Node 8.11.1, same version Meteor 1.6.1.1 ships with): https://github.com/sandstorm-io/node
The relevant patch is the very last commit on that tree (EDIT: not anymore, it's now second-to-last, see below), if you want to cherry-pick it on top of some other version. https://github.com/sandstorm-io/node/commit/0b882566078cb14537f9f91220f1a58530fa7687
 kentonv
on 16 Apr 2018
kentonv
on 16 Apr 2018
@kentonv do you patch nodejs like here too? https://github.com/meteor/galaxy-images/pull/2
aboire
on 16 Apr 2018
@aboire Holy cow I've been struggling to debug segfaults in the latest Node today, which I assumed were my fault somehow. This is probably it. I'm going to apply that patch right now. Thanks!
kentonv
on 16 Apr 2018
@aboire I've cherry-picked the segfault fix, thanks so much for pointing that out, you just saved me a bunch of (completely unrelated) time.
kentonv
on 16 Apr 2018
@kentonv very interesting read!
The symptoms you describe in the first paragraph are exactly those we have been experiencing.
I do suspect that the underlying cause might be different, because I believe Meteor has since implemented the 'alreadyWrapped' patch into their monkey-patching of .then(). @hwillson can you confirm?
Could you explain some more why the implementation of a hash table, rather than a linked list, makes the sudden spike in Fibers less of an issue?
Also, at this point, for Meteor in general, would you suggest focusing on getting this patch applied to Node or distilling down the 'root' of the fiber spike? If the latter, do you have any pointers (based on the logs in our first post)?
Thanks a lot for your time so far!
KoenLav
on 16 Apr 2018
@KoenLav
I believe Meteor has since implemented the 'alreadyWrapped' patch into their monkey-patching of .then().
Yes, but that only fixes one particularly egregious case where lots of fibers were being created. A high-traffic Meteor server, working as intended, may legitimately need a large number of concurrent fibers. Unfortunately, with stock Node.js, the more fibers you create, the slower the process gets.
Note that, by default, if your server ever goes over 120 fibers, it will actually permanently leak entries in this table, causing it to grow over time and the process to slow over time. The further over 120 you go, the faster the leakage. However, this can be fixed by changing the fiber pool size to be larger than 120. See:
I think Meteor should consider increasing the fiber pool size by default (in addition to applying the Node/V8 patch).
Could you explain some more why the implementation of a hash table, rather than a linked list, makes the sudden spike in Fibers less of an issue?
V8 uses a linked list to map thread IDs to some thread-local data. Fibers aren't threads, but the fibers package fakes out V8 into thinking that fibers are threads, so this applies to fibers too. If a large number of fibers are created, the list becomes long, and so every lookup into the table becomes slow, because a lookup in a linked list is O(n). These lookups happen frequently, slowing down everything. Using a hash table makes the lookups O(1).
Also, at this point, for Meteor in general, would you suggest focusing on getting this patch applied to Node or distilling down the 'root' of the fiber spike?
Note that the bug is in V8: https://bugs.chromium.org/p/v8/issues/detail?id=5338
This same bug actually affects Cloudflare Workers, a V8-based server runtime that doesn't use Node. As such, I personally maintain two versions of this same patch -- one for Sandstorm and one for Cloudflare.
Given that I've been hit by this issue twice in completely unrelated projects, I don't really understand how this hasn't been a huge problem across the V8 ecosystem... but, for whatever reason, it hasn't been fixed upstream, and I haven't had time to push on it.
kentonv
on 16 Apr 2018
@kentonv thanks a lot for taking the time to reply so extensively!
@hwillson are there any reasons not to increase the fiber pool size as suggested by @kentonv? Even though it probably only masquerades the real cause of this specific problem.
@kentonv is it possible to simply import Fibers and increase the pool size in our application code? (Or would this only apply to Fibers created by that specific import?)
@kentonv thanks for pointing out the reference to the V8 bug report again. Because you fixed the issue in a fork of Node.js I assumed the issue resided with Node.js. It might however still be nice to open an issue there, to allow other users running into the same problem with Node.js to track any progress more easily (down the rabbit hole, from this issue, but possibly others in other frameworks/packages).
I'll try to exert some push right now and would like to ask @hwillson and others from MDG to do the same (your names hold quite some value in the community, even 'down the rabbit hole', I imagine ;)).
KoenLav
on 16 Apr 2018
Can I suggest https://github.com/v8/v8/wiki/Contributing? A CL will probably result in a quicker fix - or at least feedback - than trying to get the V8 bug prio-bumped.
It's an issue that affects neither Chromium nor Node.js so there's not much reason for V8 people to spend time on it except for goodwill.
 bnoordhuis
on 16 Apr 2018
bnoordhuis
on 16 Apr 2018
@KoenLav Yes, you can just import it and set the pool size in your app. That's exactly what Sandstorm is doing in the code I linked. :)
Increasing the pool size may or may not actually fix your problem, but in my opinion there's no reason not to in a long-running server.
kentonv
on 16 Apr 2018
@bnoordhuis The patch I have is a hack and is almost certainly not appropriate to upstream into V8, due to using std::unordered_map and not considering all use cases. I don't know V8 well enough to understand what's really needed here.
kentonv
on 16 Apr 2018
@kentonv presented your patch for review anyhow (with the proper context). We'll see if they are willing to pick this up.
KoenLav
on 16 Apr 2018
@KoenLav No, that patch cannot be submitted to V8 as-is, it will break things. Please close your PR.
On another note, have you actually verified that this is your problem? I don't see any hard evidence in this thread that your problem is related to fibers, only a lot of speculation. One way to verify would be to take a profile using perf and see if it looks like the ones in my blog post. Another way would be to try deploying the patched node binary to production and see if it fixes things. I think you need to do one of these things before saying definitively that this is your issue.
kentonv
on 16 Apr 2018
@kentonv I updated the PR to reflect your latest patch; I'd like to leave it open to gather some feedback (for you/me/anyone involved). Also it seems they don't accept PR's to the GitHub repo, so there's no risk of this causing any issues.
To me it does not really matter whether this specific issue is caused by the problem as described in your original issue from 2016; as far as I can tell it's a significant performance issue and should be fixed regardless.
We've instrumented our app to allow debugging using perf and are awaiting any future spikes. I'm not sure how to use the patched binary; we are using a forked version of the meteord base image, I should probably be able to grab your fork from there (will look into that now).
@kentonv do you have an easy way to make use of your build using the following code (i.e. do you have a built variant of your fork, or would you recommend just building from source here?):
if [ "$NODE_VERSION" == "8.11.1" ]
then
    NODE_URL="https://s3.amazonaws.com/com.meteor.jenkins/dev-bundle-node-129/node_Linux_x86_64_v8.11.1.tar.gz"
else
    NODE_URL="https://nodejs.org/dist/v$NODE_VERSION/node-v$NODE_VERSION-linux-x64.tar.gz"
fi

curl -sSL "$NODE_URL" | tar -xz -C /
@kentonv presented his patch to V8 here: https://chromium-review.googlesource.com/c/v8/v8/+/1014407
KoenLav
on 17 Apr 2018
I have one report:
The problem seems to be in pthread_mutex_lock and pthread_mutex_unlock. So it does seem to be a threading / fiber issue. @kentonv, do you know if your node version fixes this issue?
First a 30 second profile:
> perf record -F 99 -p `pgrep -n node` -g -- sleep 30

Samples: 2K of event 'cycles', Event count (approx.): 86758113380
+  31.58%  node /home/www/  libpthread-2.19.so  [.] pthread_mutex_lock
+  27.46%  node /home/www/  libpthread-2.19.so  [.] pthread_mutex_unlock
+  15.55%  node /home/www/  perf-9882.map       [.] 0x00003835d18bf7a0
+  12.90%  node /home/www/  node                [.] v8::internal::Runtime_TryInstallOptimizedCode(int, v8::internal::Object**, v8::internal::Isolate*)
+   6.20%  node /home/www/  node                [.] v8::internal::StackGuard::CheckAndClearInterrupt(v8::internal::StackGuard::InterruptFlag)
+   2.63%  node /home/www/  node                [.] v8::internal::StackLimitCheck::JsHasOverflowed(unsigned long) const
+   1.75%  node /home/www/  node                [.] v8::base::RecursiveMutex::Unlock()
+   1.58%  node /home/www/  node                [.] v8::base::RecursiveMutex::Lock()
+   0.07%  node /home/www/  [kernel.kallsyms]   [k] pvclock_clocksource_read
+   0.07%  node /home/www/  node                [.] pthread_mutex_lock@plt
+   0.04%  node /home/www/  [kernel.kallsyms]   [k] sch_direct_xmit
+   0.03%  node /home/www/  [kernel.kallsyms]   [k] irq_enter
+   0.03%  node /home/www/  [kernel.kallsyms]   [k] ktime_get_update_offsets
+   0.03%  node /home/www/  [kernel.kallsyms]   [k] native_write_msr_safe
+   0.03%  node /home/www/  [kernel.kallsyms]   [k] scheduler_tick
+   0.03%  node /home/www/  [kernel.kallsyms]   [k] __remove_hrtimer
Directly after that, a 60 second profile:
> perf record -F 99 -p `pgrep -n node` -g -- sleep 60

Samples: 5K of event 'cycles', Event count (approx.): 173895585393
+  31.50%  node /home/www/  libpthread-2.19.so  [.] pthread_mutex_lock
+  26.73%  node /home/www/  libpthread-2.19.so  [.] pthread_mutex_unlock
+  15.75%  node /home/www/  perf-9882.map       [.] 0x00003835d18bf6fe
+  13.38%  node /home/www/  node                [.] v8::internal::Runtime_TryInstallOptimizedCode(int, v8::internal::Object**, v8::internal::Isolate*)
+   6.13%  node /home/www/  node                [.] v8::internal::StackGuard::CheckAndClearInterrupt(v8::internal::StackGuard::InterruptFlag)
+   2.73%  node /home/www/  node                [.] v8::internal::StackLimitCheck::JsHasOverflowed(unsigned long) const
+   1.94%  node /home/www/  node                [.] v8::base::RecursiveMutex::Lock()
+   1.63%  node /home/www/  node                [.] v8::base::RecursiveMutex::Unlock()
+   0.02%  node /home/www/  [kernel.kallsyms]   [k] sched_clock_local
+   0.02%  node /home/www/  [kernel.kallsyms]   [k] get_work_pool
+   0.02%  node /home/www/  [kernel.kallsyms]   [k] rcu_check_callbacks
+   0.02%  node /home/www/  [kernel.kallsyms]   [k] rb_next
+   0.02%  node /home/www/  [kernel.kallsyms]   [k] vtime_gen_account_irq_exit
+   0.02%  node /home/www/  [kernel.kallsyms]   [k] pvclock_clocksource_read
+   0.02%  node /home/www/  [kernel.kallsyms]   [k] __do_softirq
+   0.02%  node /home/www/  [kernel.kallsyms]   [k] account_system_time
+   0.02%  node /home/www/  [kernel.kallsyms]   [k] kvm_clock_get_cycles
+   0.02%  node /home/www/  [kernel.kallsyms]   [k] tcp_transmit_skb
+   0.02%  node /home/www/  node                [.] pthread_mutex_lock@plt
+   0.02%  node /home/www/  [kernel.kallsyms]   [k] __schedule
+   0.02%  node /home/www/  [kernel.kallsyms]   [k] sched_clock_cpu
+   0.00%  node /home/www/  [kernel.kallsyms]   [k] perf_pmu_enable
+   0.00%  node /home/www/  [kernel.kallsyms]   [k] native_write_msr_safe
@smeijer Since you passed -g, what are the most common stack traces leading up to the lock/unlock calls?
(FWIW, I agree it looks like a fiber issue. I expect ExecutionAccess and/or StackGuard to show up in the stack traces.)
bnoordhuis
on 17 Apr 2018
@bnoordhuis, I'm new to this profiling with perf thing. Can you tell me what to do to get the other stacktrace that you want to compare with?
Also, if there are better args than perf record -F 99 -p $PID, I'm happy to hear and try.
smeijer
on 17 Apr 2018
@smeijer perf report --stdio should print them. The output can be a bit unwieldy so you might want to gist it.
Also, if there are better args than perf record -F 99 -p $PID, I'm happy to hear and try.
99 is on the low side, I'd try 997. Prime number intentional, sampling profiling should be done at acyclic intervals.
bnoordhuis
on 17 Apr 2018
Thanks. I expected that one, but I cannot get the graph like it's printed in the fibers-blog-post.
I'm stuck with:
perf report
30.39%  node /home/www/  libpthread-2.19.so  [.] pthread_mutex_lock
        |
        --- pthread_mutex_lock
            v8::internal::Runtime_TryInstallOptimizedCode(int, v8::internal::Object**, v8::internal::Isolate*)
            0x3c014cd0463d
            0x3c014cdbf7db
            0x3c014cd7964b
            0x3c014cd78982
            LazyCompile:*enter /home/www/app/programs/server/npm/node_modules/graphql/language/visitor.js:319
            0x3c014cdf461c
            0x3c014cdbf9ce
            0x3c014cd05d1b
            0x3c014cdf4c04
            0x3c014cdbf9ce
            0x3c014cdf48c5
            0x3c014cdbf9ce
            LazyCompile:* /home/www/app/programs/server/npm/node_modules/sift/sift.js:304
            0x3c014cd05d1b
            0x3c014cd5ff5a
            LazyCompile:* /home/www/app/programs/server/npm/node_modules/meteor/npm-mongo/node_modules/mongodb-core/lib/connection/pool.js:1164
            0x3c014cdf48c5
            0x3c014cdbf9ce
            LazyCompile:*completeValueCatchingError /home/www/app/programs/server/npm/node_modules/graphql/execution/execute.js:550
            0x3c014cdf48c5
            0x3c014cdbf9ce
            0x3c014cd05d1b
            0x3c014cd57d30
            0x3c014cdf476a
            0x3c014cdbf9ce
            0x3c014cd05d1b
            0x3c014cdf5022
            0x3c014cdbf9ce
            LazyCompile:*completeValueCatchingError /home/www/app/programs/server/npm/node_modules/graphql/execution/execute.js:550
            0x3c014cdf48c5
            0x3c014cdbf9ce
            0x3c014cdf48c5
            0x3c014cdbf9ce
            0x3c014cd05d1b
            0x3c014cd5ff5a
            LazyCompile:* /home/www/app/programs/server/npm/node_modules/meteor/npm-mongo/node_modules/mongodb-core/lib/connection/pool.js:1164
            0x3c014cdf48c5
            0x3c014cdbf9ce
            LazyCompile:*completeValue /home/www/app/programs/server/npm/node_modules/graphql/execution/execute.js:619
            0x3c014cdf48c5
            0x3c014cdbf9ce
            LazyCompile:* /home/www/app/programs/server/npm/node_modules/meteor/promise/node_modules/meteor-promise/fiber_pool.js:14
            0x3c014cdbe479
            0x3c014cd0410d
            v8::internal::Execution::Call(v8::internal::Isolate*, v8::internal::Handle<v8::internal::Object>, v8::internal::Handle<v8::internal::Object>, int, v8::internal::Handle<v8::internal::Object>*)
            v8::Function::Call(v8::Local<v8::Context>, v8::Local<v8::Value>, int, v8::Local<v8::Value>*)
            v8::Function::Call(v8::Local<v8::Value>, int, v8::Local<v8::Value>*)
            Fiber::RunFiber(void**)
            Coroutine::trampoline(void*)
            coro_init
            0x7fad47baa8b0
            0x20
I guess I need to run node with debuging symbols instead? So I need to run a self-compiled version?
smeijer
on 17 Apr 2018
No need, this is good enough. Can you try running node with --trace_opt --trace_deopt? Perhaps it's not a fibers issue after all, that stack trace suggests the optimizer/deoptimizer.
bnoordhuis
on 17 Apr 2018
Can you try running node with --trace_opt --trace_deopt?
Done, and waiting again. If there was only a way to trigger this 😪
smeijer
on 17 Apr 2018
Okay, there it is again:
perf record -F 997 -p `pgrep -n node` -g -- sleep 60
perf report > perf-report.gist
perf report --stdio > perf-report-stdio.gist
Let me know if more of the --stdio is needed
perf report
+  32.37%  node /home/www/  libpthread-2.19.so  [.] pthread_mutex_unlock
+  31.39%  node /home/www/  libpthread-2.19.so  [.] pthread_mutex_lock
+  13.38%  node /home/www/  perf-16094.map      [.] 0x0000285d4fd3f7df
+  11.40%  node /home/www/  node                [.] v8::internal::Runtime_TryInstallOptimizedCode(int, v8::interna
+   5.89%  node /home/www/  node                [.] v8::internal::StackGuard::CheckAndClearInterrupt(v8::internal:
+   2.34%  node /home/www/  node                [.] v8::internal::StackLimitCheck::JsHasOverflowed(unsigned long)
+   1.47%  node /home/www/  node                [.] v8::base::RecursiveMutex::Unlock()
+   1.39%  node /home/www/  node                [.] v8::base::RecursiveMutex::Lock()
+   0.02%  node /home/www/  [kernel.kallsyms]   [k] apic_timer_interrupt
+   0.02%  node /home/www/  [kernel.kallsyms]   [k] native_write_msr_safe
+   0.02%  node /home/www/  [kernel.kallsyms]   [k] notifier_call_chain
+   0.02%  node /home/www/  [kernel.kallsyms]   [k] rcu_sysidle_exit
+   0.02%  node /home/www/  [kernel.kallsyms]   [k] run_timer_softirq
+   0.02%  node /home/www/  [kernel.kallsyms]   [k] task_tick_fair
+   0.02%  node /home/www/  [kernel.kallsyms]   [k] timerqueue_add
+   0.02%  node /home/www/  [kernel.kallsyms]   [k] _raw_spin_unlock_irqrestore
+   0.02%  node /home/www/  [kernel.kallsyms]   [k] raise_softirq
+   0.01%  node /home/www/  [kernel.kallsyms]   [k] ttwu_do_wakeup
+   0.01%  node /home/www/  [kernel.kallsyms]   [k] pvclock_gtod_notify
+   0.01%  node /home/www/  [kernel.kallsyms]   [k] fetch_task_cputime
+   0.01%  node /home/www/  [kernel.kallsyms]   [k] rb_insert_color
+   0.01%  node /home/www/  [kernel.kallsyms]   [k] rb_next
+   0.01%  node /home/www/  [kernel.kallsyms]   [k] __x2apic_send_IPI_mask
+   0.01%  node /home/www/  [kernel.kallsyms]   [k] _raw_spin_lock_irqsave
+   0.01%  node /home/www/  [kernel.kallsyms]   [k] update_cfs_shares
+   0.01%  node /home/www/  [kernel.kallsyms]   [k] update_curr
+   0.01%  node /home/www/  [kernel.kallsyms]   [k] ktime_get_update_offsets
+   0.01%  node /home/www/  [kernel.kallsyms]   [k] kvm_clock_read
+   0.01%  node /home/www/  [kernel.kallsyms]   [k] update_vsyscall
+   0.01%  node /home/www/  [kernel.kallsyms]   [k] enqueue_entity
+   0.01%  node /home/www/  [kernel.kallsyms]   [k] update_cfs_rq_blocked_load
+   0.01%  node /home/www/  [kernel.kallsyms]   [k] tcp_queue_rcv
+   0.01%  node /home/www/  [kernel.kallsyms]   [k] rb_erase
+   0.01%  node /home/www/  [kernel.kallsyms]   [k] cpumask_next_and
+   0.01%  node /home/www/  node                [.] pthread_mutex_lock@plt
perf report stdio
# ========
#
# Samples: 9K of event 'cycles'
# Event count (approx.): 28368710272
#
# Overhead          Command       Shared Object                                                                                                  Symbol
# ........  ...............  ..................  ......................................................................................................
#
    32.37%  node /home/www/  libpthread-2.19.so  [.] pthread_mutex_unlock
            |
            --- pthread_mutex_unlock
                v8::internal::Runtime_TryInstallOptimizedCode(int, v8::internal::Object**, v8::internal::Isolate*)
                0x285d4fc8463d
                0x285d4fd3f7db
                0x285d4fd094a8
                0x285d4fd3e479
                0x285d4fc8410d
                v8::internal::Execution::TryCall(v8::internal::Isolate*, v8::internal::Handle<v8::internal::Object>, v8::internal::Handle<v8::internal::Object>, int, v8::internal::Handle<v8::internal::Object>*, v8::internal::Execution::MessageHandling, v8::internal::MaybeHandle<v8::internal::Object>*)
                v8::internal::Isolate::PromiseReactionJob(v8::internal::Handle<v8::internal::PromiseReactionJobInfo>, v8::internal::MaybeHandle<v8::internal::Object>*, v8::internal::MaybeHandle<v8::internal::Object>*)
                v8::internal::Isolate::RunMicrotasksInternal()
                v8::internal::Isolate::RunMicrotasks()
                v8::internal::FunctionCallbackArguments::Call(void (*)(v8::FunctionCallbackInfo<v8::Value> const&))
                v8::internal::MaybeHandle<v8::internal::Object> v8::internal::(anonymous namespace)::HandleApiCallHelper<false>(v8::internal::Isolate*, v8::internal::Handle<v8::internal::HeapObject>, v8::internal::Handle<v8::internal::HeapObject>, v8::internal::Handle<v8::internal::FunctionTemplateInfo>, v8::internal::Handle<v8::internal::Object>, v8::internal::BuiltinArguments)
                v8::internal::Builtin_HandleApiCall(int, v8::internal::Object**, v8::internal::Isolate*)
                0x285d4fc8463d
                0x285d4fd74dc1
                0x285d4fd3f9ce
                0x285d4fd3e479
                0x285d4fc8410d
                v8::internal::Execution::Call(v8::internal::Isolate*, v8::internal::Handle<v8::internal::Object>, v8::internal::Handle<v8::internal::Object>, int, v8::internal::Handle<v8::internal::Object>*)
                v8::Function::Call(v8::Local<v8::Context>, v8::Local<v8::Value>, int, v8::Local<v8::Value>*)
                v8::Function::Call(v8::Local<v8::Value>, int, v8::Local<v8::Value>*)
                node::InternalCallbackScope::Close()
                node::InternalMakeCallback(node::Environment*, v8::Local<v8::Object>, v8::Local<v8::Function>, int, v8::Local<v8::Value>*, node::async_context)
                node::AsyncWrap::MakeCallback(v8::Local<v8::Function>, int, v8::Local<v8::Value>*)
                node::StreamBase::EmitData(long, v8::Local<v8::Object>, v8::Local<v8::Object>)
                node::LibuvStreamWrap::OnReadImpl(long, uv_buf_t const*, uv_handle_type, void*)
                node::LibuvStreamWrap::OnRead(uv_stream_s*, long, uv_buf_t const*)
                uv__read
                uv__stream_io
                uv__io_poll
                uv_run
                node::Start(uv_loop_s*, int, char const* const*, int, char const* const*)
                node::Start(int, char**)
                __libc_start_main

    31.39%  node /home/www/  libpthread-2.19.so  [.] pthread_mutex_lock
            |
            --- pthread_mutex_lock
                v8::internal::Runtime_TryInstallOptimizedCode(int, v8::internal::Object**, v8::internal::Isolate*)
                0x285d4fc8463d
                0x285d4fd3f7db
                0x285d4fd094a8
                0x285d4fd3e479
                0x285d4fc8410d
                v8::internal::Execution::TryCall(v8::internal::Isolate*, v8::internal::Handle<v8::internal::Object>, v8::internal::Handle<v8::internal::Object>, int, v8::internal::Handle<v8::internal::Object>*, v8::internal::Execution::MessageHandling, v8::internal::MaybeHandle<v8::internal::Object>*)
                v8::internal::Isolate::PromiseReactionJob(v8::internal::Handle<v8::internal::PromiseReactionJobInfo>, v8::internal::MaybeHandle<v8::internal::Object>*, v8::internal::MaybeHandle<v8::internal::Object>*)
                v8::internal::Isolate::RunMicrotasksInternal()
                v8::internal::Isolate::RunMicrotasks()
                v8::internal::FunctionCallbackArguments::Call(void (*)(v8::FunctionCallbackInfo<v8::Value> const&))
                v8::internal::MaybeHandle<v8::internal::Object> v8::internal::(anonymous namespace)::HandleApiCallHelper<false>(v8::internal::Isolate*, v8::internal::Handle<v8::internal::HeapObject>, v8::internal::Handle<v8::internal::HeapObject>, v8::internal::Handle<v8::internal::FunctionTemplateInfo>, v8::internal::Handle<v8::internal::Object>, v8::internal::BuiltinArguments)
                v8::internal::Builtin_HandleApiCall(int, v8::internal::Object**, v8::internal::Isolate*)
                0x285d4fc8463d
                0x285d4fd74dc1
                0x285d4fd3f9ce
                0x285d4fd3e479
                0x285d4fc8410d
                v8::internal::Execution::Call(v8::internal::Isolate*, v8::internal::Handle<v8::internal::Object>, v8::internal::Handle<v8::internal::Object>, int, v8::internal::Handle<v8::internal::Object>*)
                v8::Function::Call(v8::Local<v8::Context>, v8::Local<v8::Value>, int, v8::Local<v8::Value>*)
                v8::Function::Call(v8::Local<v8::Value>, int, v8::Local<v8::Value>*)
                node::InternalCallbackScope::Close()
                node::InternalMakeCallback(node::Environment*, v8::Local<v8::Object>, v8::Local<v8::Function>, int, v8::Local<v8::Value>*, node::async_context)
                node::AsyncWrap::MakeCallback(v8::Local<v8::Function>, int, v8::Local<v8::Value>*)
                node::StreamBase::EmitData(long, v8::Local<v8::Object>, v8::Local<v8::Object>)
                node::LibuvStreamWrap::OnReadImpl(long, uv_buf_t const*, uv_handle_type, void*)
                node::LibuvStreamWrap::OnRead(uv_stream_s*, long, uv_buf_t const*)
                uv__read
                uv__stream_io
                uv__io_poll
                uv_run
                node::Start(uv_loop_s*, int, char const* const*, int, char const* const*)
                node::Start(int, char**)
                __libc_start_main

    13.38%  node /home/www/  perf-16094.map      [.] 0x0000285d4fd3f7df
            |
            |--6.47%-- 0x285d4fc8463d
            |          0x285d4fd3f7db
            |          0x285d4fd094a8
            |          0x285d4fd3e479
            |          0x285d4fc8410d
            |          v8::internal::Execution::TryCall(v8::internal::Isolate*, v8::internal::Handle<v8::internal::Object>, v8::internal::Handle<v8::internal::Object>, int, v8::internal::Handle<v8::internal::Object>*, v8::internal::Execution::MessageHandling, v8::internal::MaybeHandle<v8::internal::Object>*)
            |          v8::internal::Isolate::PromiseReactionJob(v8::internal::Handle<v8::internal::PromiseReactionJobInfo>, v8::internal::MaybeHandle<v8::internal::Object>*, v8::internal::MaybeHandle<v8::internal::Object>*)
            |          v8::internal::Isolate::RunMicrotasksInternal()
            |          v8::internal::Isolate::RunMicrotasks()
            |          v8::internal::FunctionCallbackArguments::Call(void (*)(v8::FunctionCallbackInfo<v8::Value> const&))
            |          v8::internal::MaybeHandle<v8::internal::Object> v8::internal::(anonymous namespace)::HandleApiCallHelper<false>(v8::internal::Isolate*, v8::internal::Handle<v8::internal::HeapObject>, v8::internal::Handle<v8::internal::HeapObject>, v8::internal::Handle<v8::internal::FunctionTemplateInfo>, v8::internal::Handle<v8::internal::Object>, v8::internal::BuiltinArguments)
            |          v8::internal::Builtin_HandleApiCall(int, v8::internal::Object**, v8::internal::Isolate*)
            |          0x285d4fc8463d
            |          0x285d4fd74dc1
            |          0x285d4fd3f9ce
            |          0x285d4fd3e479
            |          0x285d4fc8410d
            |          v8::internal::Execution::Call(v8::internal::Isolate*, v8::internal::Handle<v8::internal::Object>, v8::internal::Handle<v8::internal::Object>, int, v8::internal::Handle<v8::internal::Object>*)
            |          v8::Function::Call(v8::Local<v8::Context>, v8::Local<v8::Value>, int, v8::Local<v8::Value>*)
            |          v8::Function::Call(v8::Local<v8::Value>, int, v8::Local<v8::Value>*)
            |          node::InternalCallbackScope::Close()
            |          node::InternalMakeCallback(node::Environment*, v8::Local<v8::Object>, v8::Local<v8::Function>, int, v8::Local<v8::Value>*, node::async_context)
            |          node::AsyncWrap::MakeCallback(v8::Local<v8::Function>, int, v8::Local<v8::Value>*)
            |          node::StreamBase::EmitData(long, v8::Local<v8::Object>, v8::Local<v8::Object>)
            |          node::LibuvStreamWrap::OnReadImpl(long, uv_buf_t const*, uv_handle_type, void*)
            |          node::LibuvStreamWrap::OnRead(uv_stream_s*, long, uv_buf_t const*)
            |          uv__read
            |          uv__stream_io
            |          uv__io_poll
            |          uv_run
            |          node::Start(uv_loop_s*, int, char const* const*, int, char const* const*)
            |          node::Start(int, char**)
            |          __libc_start_main
            |
I think I may have found a reasonable explanation for the cause of the (assumed) fiber spike in our application; we had a collection with operational data which should have been cleared every 3 hours (removing entries not modified in the last 5 days, using multi: true) by our service which runs scheduled jobs.
Due to a bug in the way we se the tenant for our scheduled jobs this was only done for the last of our tenants; resulting in a rather large collection which we needed to manually clean/update (a short moment before the first issues arose). However; all clients are subscribed to a (subset of) this collection (having a representation of the data, which is now gone/updated), so the server would need to inform all these clients at once of these changes.
I assume publishing all those changes caused a fiber spike (or in any way, some load which was enough to bring the server down to a crawl).
@hwillson is there a difference between making changes to MongoDB from a different instance than the instance which publishes a collection OR making those changes from that very same instance (i.e. does Meteor use some logic to see whether it is going to be updating a collection it is subscribed to and somehow batch the DDP messages associated with the update, we use multi: true)?
KoenLav
on 18 Apr 2018
@KoenLav, I think you could easily confirm this by moving the expiration logic to the database itself:
db.log_events.createIndex( { "modifiedAt": 1 }, { expireAfterSeconds: 3600 * 24 * 5 } )
@KoenLav, have you changed the poolSize as well? Did it impact your app's behavior in any way?
I've changed it to 1e9, and now my fibersCreated have been settled around ~500, whereas before the change, it would have risen to 40.000 within a day.
Not sure if it changes anything, just something I've noticed and I'm curious about.
@bnoordhuis, does my latest perf log tell you anything interesting, or nothing yet?
smeijer
on 18 Apr 2018
@smeijer confirm what?
Also I did not increase the poolSize as suggested by @laverdet here: https://github.com/laverdet/node-fibers/issues/371
KoenLav
on 18 Apr 2018
@smeijer I'm interested in what --trace_opt --trace_deopt prints to stdout, no perf involved. :-)
bnoordhuis
on 18 Apr 2018
I understand now. Now need to figure out how this works with Meteor / pm2, as it looks like I don't have any extra output with those flags.
smeijer
on 18 Apr 2018
@bnoordhuis, I've found the data you need. It's written in a pm2.log, instead of the app.log 😄
Does this trace info contain sensitive information? And do you want a log from the entire run? Startup untill exit / stuck? Or just a the bootup?
The full log is 96.692 lines 😨
*edit, I see there is sensitive information in this log. I did find some password-reset-tokens :(
smeijer
on 18 Apr 2018
As I understand the issue now (going down the rabbit hole):
Application code
In our application we subscribed to an entire (tenantified) Collection, containing +/- 30.000 documents, on every client. Simply put: each client was subscribed to a subset of that Collection. At some point we triggered an update to 20.000 documents in that Collection. This is very similar to the reproduction posted in this thread.
Meteor framework
Question: how does this work in Meteor internally? Does Meteor create one Fiber per document? Per client? (Not necessarily specifically in our specific case, but rather in the simple reproduction,)
Assumption: the behavior described above, as shown in the reproduction, creates a large number of Fibers.
Fibers package
These Fibers are created in order to allow Node.js to asynchronously execute these changes AND they may (or may not) have a differing memory context.
Question: is it necessary to create so much Fibers based on the behavior described above, or can we limit this in Meteor's use of Fibers (batching MongoDB updates/DDP messages)?
Node.js runtime
Meteor runs Node.js in a single Isolate (https://v8docs.nodesource.com/node-0.8/d5/dda/classv8_1_1_isolate.html), but within the Isolate it is possible to start multiple 'threads'. This is what Fibers does; create multiple threads within the same running process.
V8 Engine
Currently, in V8, the memory contexts of these threads are stored in a linked list. When the amount of threads increases, the size of the linked list increases and it is easy to assume that switching between threads will also occur more frequently.
Problem: lookups in linked lists become exponentially slower when the list increases in size. The list grows larger and we switch threads more often, hence Node.js slows down to a crawl.
Solution: implement a hash table rather than a linked list for storing the memory context as, apparently, lookups in a hash table do not become exponentially slower when the table grows.
=====
As stated above the solution to this problem can be found in the patch to V8 as presented by @kentonv, but I also think we could look at some Meteor framework code to find out whether it is possible to catch this specific scenario (a lot of updates on a Collection) and run it in a single Fiber, rather than creating a Fiber per X.
@hwillson any thoughts?
@everyone feel free to point out any inaccuracies, incorrect assumptions or mistakes in the text above!
Reproduction mentioned in the text above, updated to Meteor 1.6.1: https://github.com/KoenLav/meteor-fiber-repro
KoenLav
on 20 Apr 2018
Thanks for outlining all of this @KoenLav, and everyone else as well for the excellent debugging details. I haven't had a chance to look into all of this further yet, but I have been digesting everything as it comes in. We did discuss this issue briefly on our last triage call, so it is known to the core team. Right now the focus is on prepping a 1.7 RC, so looking into this further will likely not happen until >= 1.7.1. If anyone has new findings to share though, please do post them. Thanks all!
hwillson
on 20 Apr 2018
It seems like the patch to V8 is on track to being accepted.
Adding to that: we did not experience the issue anymore (which would be expected if the explanation above holds).
@smeijer can you think of a scenario within your app which could trigger a large number of Fibers? It could be similar to ours, but could also be completely unrelated.
KoenLav
on 21 Apr 2018
Not really one specific case unfortunately. One hour ago the cpu also spiked, on a Sunday and no traffic at all.
smeijer
on 22 Apr 2018
@smeijer that's strange... Are there any scheduled tasks which could trigger the behavior? Or maybe an incoming API call?
KoenLav
on 22 Apr 2018
@hwillson the patch to V8 by @kentonv was merged.
Even though we are no longer experiencing this issue it might still be good to know when this would normally land in Node.js and eventually in Meteor.
KoenLav
on 24 Apr 2018
Great news @KoenLav and thanks @kentonv! I wish I could say when this will land in v8/Node. On the Meteor side, we're trying to stay on top of Node (LTS) releases, so when it does land it will likely be included in the first Meteor release that happens after that. We'll sometimes manage a custom fork of Node (and cherry pick the commits we need) to get fixes like this into a Meteor release sooner than later, but we have to make sure the benefits of doing this justify that additional overhead of managing that fork. In either case, with a Meteor 1.7 RC around the corner, I don't think this will be looked at further until after 1.7 is released.
hwillson
on 24 Apr 2018
@kentonv Do you happen to have a Galaxy-compatible docker image up on Docker Hub which has your patch?
Also, if anyone could advise on how to run Linux 'perf' or a similar tool on Galaxy I'd appreciate it. My understanding is that it's not possible and we have to self-host and simulate prod load...
alanning
on 24 Apr 2018
@alanning Sorry, I am neither a Galaxy nor a Docker user.
kentonv
on 24 Apr 2018
@alanning you have to build the fork of nodejs https://github.com/sandstorm-io/node and replace it here https://github.com/meteor/galaxy-images/blob/master/galaxy-app/app/install_node.sh#L23 and publish on docker hub
aboire
on 25 Apr 2018
I'm not yet sure if it's related, but I've noticed issue #9828. So I thought, why not add blocked-at to my monitoring/logging scripts as well.
And I'm quite shocked of the results. I have a lot of blocked moments. Anywhere 100ms to 4.000ms. (I don't record a block below 100ms)
I'm basically receiving two types of "blocking" stack traces. A few from a Mongo reconnect. Ranging from 100 to 130ms:
at Socket.connect (net.js:1006:40)",
at Object.connect (net.js:103:35)",
at Connection.connect (/home/www/app/programs/server/npm/node_modules/meteor/npm-mongo/node_modules/mongodb-core/lib/connection/connection.js:412:25)",
at _createConnection (/home/www/app/programs/server/npm/node_modules/meteor/npm-mongo/node_modules/mongodb-core/lib/connection/pool.js:1133:14)",
at /home/www/app/programs/server/npm/node_modules/meteor/npm-mongo/node_modules/mongodb-core/lib/connection/pool.js:1263:15",
at waitForAuth (/home/www/app/programs/server/npm/node_modules/meteor/npm-mongo/node_modules/mongodb-core/lib/connection/pool.js:1156:39)",
at /home/www/app/programs/server/npm/node_modules/meteor/npm-mongo/node_modules/mongodb-core/lib/connection/pool.js:1164:5",
at /home/www/app/programs/server/npm/node_modules/meteor/npm-mongo/node_modules/mongodb-core/lib/connection/pool.js:1028:21",
at _combinedTickCallback (internal/process/next_tick.js:131:7)",
at process._tickDomainCallback (internal/process/next_tick.js:218:9)"
And a lot originating from graphql resolvers. Reaching up to 4.000ms:
at Promise.then (<anonymous>)",
at Promise.meteorPromiseThen [as then] (/home/www/app/programs/server/npm/node_modules/meteor/promise/node_modules/meteor-promise/promise_server.js:30:31)",
at completeValue (/home/www/app/programs/server/npm/node_modules/graphql/execution/execute.js:623:20)",
at completeValueWithLocatedError (/home/www/app/programs/server/npm/node_modules/graphql/execution/execute.js:585:21)",
at completeValueCatchingError (/home/www/app/programs/server/npm/node_modules/graphql/execution/execute.js:560:21)",
at resolveField (/home/www/app/programs/server/npm/node_modules/graphql/execution/execute.js:500:10)",
at /home/www/app/programs/server/npm/node_modules/graphql/execution/execute.js:367:18",
at Array.reduce (<anonymous>)",
at executeFields (/home/www/app/programs/server/npm/node_modules/graphql/execution/execute.js:364:42)",
at executeOperation (/home/www/app/programs/server/npm/node_modules/graphql/execution/execute.js:290:122)",
at executeImpl (/home/www/app/programs/server/npm/node_modules/graphql/execution/execute.js:154:14)",
at Object.execute (/home/www/app/programs/server/npm/node_modules/graphql/execution/execute.js:131:229)",
at doRunQuery (/home/www/app/programs/server/npm/node_modules/apollo-server-core/dist/runQuery.js:98:42)",
at /home/www/app/programs/server/npm/node_modules/apollo-server-core/dist/runQuery.js:22:54",
at /home/www/app/programs/server/npm/node_modules/meteor/promise/node_modules/meteor-promise/fiber_pool.js:43:40"
Interesting for sure!
Leaving this here for when I get another chance to look: https://www.npmjs.com/package/blocked-at
I think it's worthwhile to look at which Meteor internals cause the blocking of the event loop. Would this affect just a single Fiber, or all of them?
Side note: does this package (blocked-at) "understand" Fibers?
@hwillson given the discussion up until this point could you point at some areas in the Meteor code base which we could take a look at?
KoenLav
on 25 Apr 2018
@smeijer I think if you are already using Apollo it's probably better to keep it separate from meteor. It is possible to connect to another GraphQL endpoint from your meteor app. Then you don't have Fibers there, you can always update node.js without a lot of hassle. And as a bonus you have faster builds and tests. We have been using GraphQL with Absinthe in Elixir. There you can not ever have a blocked event loop and is much easier to scale and blazing fast.
 koszta
on 27 Apr 2018
koszta
on 27 Apr 2018
We are now experiencing a similar issue (not necessarily, but possibly, the same) on our staging servers when observing a large collection (20K documents). This specific service is our API and it observes our Bills collection; whenever a bill is added it attempts to contact a TPA via a HTTP.call.
      // When the server is starting we do not want to fire added hooks for every document
      let initializing = true;

      // Listeners for Bills
      this.billListener = Bills.find({}).observe({
        changed(bill) {
          that.handleUpdate(bill, 'bills', 'changed');
        },
        added(bill) {
          if (!initializing) {
            that.handleUpdate(bill, 'bills', 'added');
          }
        },
        removed(bill) {
          that.handleUpdate(bill, 'bills', 'added');
        },
      });

      initializing = false;
Our Bills have a modifiedAt which is automatically updated via collection hooks (and set to the createdAt upon creation), so a simple resolution would be to simply only observe Bills with a modifiedAt greater than the time of startup of the API.
However I'm actually more interested in the fact that this problem seems reproducible. Given the fact that observe (or some underlying mechanism) is probably also used (internally) in subscriptions these issues might be related.
I don't have time to do any further research currently, but leaving this here for consideration.
KoenLav
on 30 Apr 2018
@KoenLav You're describing a situation similar to mine. My first "CPU-lock" happened in staging. As staging runs on a single node-server (mongo separately), I thought it was due to performance issues, and I decided to scale it up. Now it's 4 core machine instead of 2 cores. And I'm running 3 instances on it with pm2, instead of a single one. The lock never happened again.
A few iterations later, and production started with this nonsense.
Back to the issue; I'm also having a collection with ~ 35.000 documents, and the createdAt and modifiedAt attributes like you describe. Although, I don't really understand why this should be a problem.
These documents are never published all on the same time. And a modifiedAt doesn't update multiple documents.
Is the problem here really the collection size? I expected it would something like active-user-count or a lot of changes at the same time. Wouldn't there be more users experiencing when a collection of ~ 25k documents seems to be the max?
@koszta, _completely offtopic; so this is the only comment I'm spending on it_.
I've read your message after you've posted it. But running away for the troubles doesn't feel like the right thing to do. I've read about Absinthe and Elixir a long time ago. And yes, it sounds interesting. But it's an entirely new stack to learn for my dev-team. And is thereby a no-go. I plan to stay with NodeJS for the long-term.
Pulling the graphql part out of Meteor is something that's on my wishlist for some time now. But the integration with Meteor accounts is preventing a full extraction for the moment.
And even if I could meteor eject right now. Then I still don't like to eject in the moment of crisis. The thing is, you never know what will hit you next. Especially when quickly migrating from framework X to Y, because of some trouble you're experiencing.
smeijer
on 30 Apr 2018
@KoenLav I can reproduce the issue with the subscriptions without observers as well. So if I just use this.added in a publication and unsubscribe, I have the same error. So I don't think it's related.
I would not recommend to use meteor observers for background tasks (especially not billing). We had quite some reliability issues with it. I would rather just poll the database or use a message queue (we use RabbitMQ).
You are using {} in the query, which is safe, but this is something worth reading:
https://blog.meteor.com/mongodb-queries-dont-always-return-all-matching-documents-654b6594a827
@smeijer Sorry for the offtopic, I just wanted to share my experiences with solving similar issues.
Regarding the accounts package:
You can use the meteor resumeToken, exchange it with a JWT token (can be done with a GraphQL mutation for example). This way you can do a hassle-free transition.
koszta
on 30 Apr 2018
https://github.com/meteor/meteor/pull/9855/files
The PR above might help with this issue, but I don't think we've gotten down to the root just yet!
KoenLav
on 3 May 2018
For the fiber spike, couldn't we just limit the number of simultaneous requests made by DocFetcher? Could just queue up any requests surpassing the throttling limit. Seems like that might be the simplest solution
 veered
on 15 May 2018
veered
on 15 May 2018
@veered when there are 100 requests in the queue to be fetched (for one particular collection) it is much faster to simply say 'byebye-oplog' and start polling until the rapid updates stop. Let alone the cases where there are 1000 or even 10000!
I think as a general rule whenever there are more than 100 changes within a second the oplog should probably opt to fallback to polling every x seconds instead of tailing the oplog. The number I just mentioned (100, 1 second) are up for debate, but the general idea behind this idea is sound, in my opinion.
By throttling the DocFetcher we would simply be moving the problem; instead of a lot of Fibers being created at once a certain maximum number of Fibers would be created, but still the 100, 1000, 10000 documents need to be fetched; this is not ideal.
I also considered fetching the documents all at once (as in fetching the documents using { _id: { $in: [ids] } }), which might be a more simple resolution.
KoenLav
on 15 May 2018
It's possible that falling back to polling could end up causing even more db queries than working through the oplog. Suppose you have 100 distinct (aka not multiplexed) observers on a collection. If you see an oplog entry that requires a db lookup, then it'll only do one db lookup, no matter how many observers there are. But if you fallback to polling, then you'd have to refetch the entire result set for each of those 100 observers. This could result in a 100 queries (each potentially returning many documents) rather than just one query returning a single document.
Side note: You'll still have to tail the oplog to tell which observers need to fallback to polling, right? Or will all observers across all collections switch to polling?
Also, after a certain point parallelizing queries across fibers will actually be slower than doing them in serial. Very quickly the bottleneck becomes BSON & EJSON serialization/deserialization, so performance is CPU bound not DB bound.
In other news, Meteor really really should switch to using https://github.com/mongodb-js/bson-ext for BSON serialization/deserialization. It's way faster.
It even more other news, it'd be so cool if it were possible to process oplog tailing in a separate non-blocking thread or process. I've looked into it a bit, and unfortunately it would not be easy.
veered
on 15 May 2018
It even more other news, it'd be so cool if it were possible to process oplog tailing in a separate non-blocking thread or process. I've looked into it a bit, and unfortunately it would not be easy.
I'm curious if switching to Mongo ChangeStreams would have any impact on this.
Placing oplog tailing in a separate thread, doesn't really sound possible to me. As node is single threaded by design.
smeijer
on 16 May 2018
@KoenLav , are you still experiencing the spikes? Or were you able to resolve it?
Also; will Meteor still tail the oplog, when there are not publications defined in my app?
smeijer
on 16 May 2018
@smeijer Previous discussion of change streams: https://github.com/meteor/meteor-feature-requests/issues/158#issuecomment-339376181 (note especially the comment by @klaussner). Short version: change streams only support watching documents by ID, so they probably are not a full replacement for oplog tailing.
Spawning a separate process to do oplog tailing seems feasible, though definitely not trivial.
 benjamn
on 16 May 2018
benjamn
on 16 May 2018
@veered very good point! Then I guess implementing a fetch of multiple ids at once (rather than one fetch per ID) would be the resolution. This should be rather easy to implement.
As for the side note: yes, tailing will still be used for the other collections.
@smeijer we are still experiencing the spikes. (We're not running Meteor from a checkout in production, yet.) When comparing the call stack in my first post with the functions I refactored in my PRs which dealt with DDP and OplogTailing I see that the 99% CPU issue is definitely related.
We also noticed that when we spread our server over more nodes (behind a load balancer) the issue appears less frequently.
In addition to that I have a feeling that this issue is related to us subscribing to a collection (Printjobs) only for the last 24 hours, but this doesn't actually work; it subscribes on all documents in the collection which were created within the last 24 hours, but won't remove those documents when we are 24 hours later (as in the selector is only applied when the subscription is instantiated). I'm writing a fix for this now (resubscribing to the collection every x hours).
KoenLav
on 17 May 2018
+1 got this issue in production, too.
Saw the V8 thread: https://bugs.chromium.org/p/v8/issues/detail?id=5338
What would be the ETA, or any workarounds for the time being?
 MingStar
on 20 May 2018
KoenLav
on 25 Jun 2018
MingStar
on 20 May 2018
KoenLav
on 25 Jun 2018
I've opened an issue for updating Meteor's default to Node 8.12 as soon as they've made a release: #10117. In the meantime, you can make yourself an unofficial Node binary and put it in your .meteor directory.
 jimrandomh
on 2 Aug 2018
jimrandomh
on 2 Aug 2018
@jimrandomh How can you change the version of internal NodeJS of Meteor? Can you show me the instruction?
 dongtanhuy
on 8 Aug 2018
dongtanhuy
on 8 Aug 2018
@dongtanhuy
Meteor does not have internal node. First you install node, then meteor.
There is prebuilt in-progress version of node v8.12:
https://github.com/nodejs/node/pull/21593#issuecomment-406716339
For example, you can unarchive it, and replace node binary with new one.
Look at where node is installed:
which node
Then replacing::
sudo su
cd /usr/bin
# check that it's binary, not symlink, with directory listing
ls -lah  | grep node
mv /home/user/Downloads/node node
chown root:root node
chmod a+x node
Just wanted to let know that I haven't experienced this issue anymore since I've replaced a lot of meteor publications with apollo/graphql requests.
The reactivity is thereby lost, but in my case a 30sec poll is also fine. On the places that I do require reactivity, I only publish a single timestamp. This timestamp is passed through to apollo, which triggers a refetch when the timestamp is changed.
The discussion here has also been helpfull to improve performance here and there.
smeijer
on 8 Aug 2018
@smeijer we also haven't experienced this issue anymore after rewriting some of our (long-running) publications (or actually the subscriptions); we made all clients resubscribe on a specific publication (which receives a lot of updates) every 6 hours.
KoenLav
on 8 Aug 2018
@dongtanhuy For my development system, I found that meteor was not using the system install of node, but one that it kept somewhere in ~/.meteor. I found it with find ~/.meteor -name node and replaced it with a pre-release node 8.12. This is not an ideal way to do it, but it works well enough as a stopgap until node 8.12 is released.
jimrandomh
on 8 Aug 2018
@jimrandomh Can you explain more detail?
I find in .meteor folder by find ~/.meteor -name node and the result is a very long list of packages with content folder name node. What should I do next?
Here is a part of my search result:
/Users/juliandong/.meteor/packages/babel-compiler/.6.14.1.14hmmwc++os+web.browser+web.cordova/npm/node_modules/babel-generator/lib/node
/Users/juliandong/.meteor/packages/babel-compiler/.6.14.1.14hmmwc++os+web.browser+web.cordova/npm/node_modules/reify/node
/Users/juliandong/.meteor/packages/babel-compiler/.7.0.6.lb792n.450y++os+web.browser+web.cordova/npm/node_modules/@babel/generator/lib/node
/Users/juliandong/.meteor/packages/babel-compiler/.7.0.6.lb792n.450y++os+web.browser+web.cordova/npm/node_modules/reify/node
/Users/juliandong/.meteor/packages/babel-compiler/.7.1.1.12085lg.zffz++os+web.browser+web.browser.legacy+web.cordova/npm/node_modules/@babel/generator/lib/node
@dongtanhuy On my system (Linux) it was in ~/.meteor/packages/meteor-tool/.1.5.2.ecibw9++os.linux.x86_64+web.browser+web.cordova/mt-os.linux.x86_64/dev_bundle/bin/node. I'm not sure where it would be on MacOS.
jimrandomh
on 10 Aug 2018
I have a different suggestion to the CPU hogging issue. At the bottom of the description of https://www.npmjs.com/package/fibers an issue of GC trying to unwind an fiber but causes an endless loop. In doc_fetcher.js there is a while loop with ejson.clone and then call the callback which swallows errors.
I have some small evidence to this by using gdb to core dump a few times on CPU hogging instances. I then load it into llnode and look at the stack. All times it's been busy in the ejson clone call inside the doc fetcher.
Evidence that this loop could occur is the issue #10032 . To my knowledge however using of custom fields is not the cause for my infinity loop.
 stelund
on 2 Oct 2018
stelund
on 2 Oct 2018
@kentonv Now that the fiber fix has landed in Node 8.12.0 is it still necessary to increase the pool size for meteor?
 AndrewMorsillo
on 27 Nov 2018
AndrewMorsillo
on 27 Nov 2018
@AndrewMorsillo Increasing the pool size was to work around a different issue, involving a memory leak when the number of fibers goes over the pool size. I think that was fixed a long time ago. So no, it shouldn't be necessary to increase the pool size, although it may still improve performance by a small amount if you commonly have more fibers than the default pool size.
kentonv
on 27 Nov 2018
Are others still experiencing this specific issue, or something like it?
=====
Just to inform everyone following this issue about our specific problem; it hasn't surfaced anymore since we refactored a long running subscription which receives a lot of updates.
Previously we subscribed to this collection at startup, and clients could remain running that same subscription for weeks if not months. Now we refresh the subscription every 6 hours (by stopping it and resubscribing).
We've only noticed CPU hogging once more; when a client fired off a method to generate a report from the server based on a huge amount of data. Restarting the server wouldn't do any good; the client would simply reconnect and re-rerun the method for which it had not yet received any data. Luckily we managed to isolate the client which performed this action relatively quickly, and the issue disappeared the second I closed the browser window on their machine.
Since then we have isolated the reporting capabilities in a separate micro-service to allow us to scale these instances independently and isolate them from our operational instances.
KoenLav
on 1 Dec 2018
Since then we have isolated the reporting capabilities in a separate micro-service to allow us to scale these instances independently and isolate them from our operational instances.
This is great advice, independent of Meteor. Not really related to this github issue but in the past my company also didn't isolate our reporting properly and had a case of a report doing SELECT N+1 which pegged CPU for whichever Meteor webserver got the request. Identified via APM (kadira). Exhibited symptoms exactly matched the ones @KoenLav mentioned. For us it was exacerbated by Meteor's behavior of auto-wrapping async calls to be compatible with the fiber context but the underlying cause was just poor query design.
Summary: identify the core service your app is providing and make sure it is running independently. Put everything non-critical, including reporting, on some other system.
alanning
on 2 Dec 2018
Are there any good tutorials or guides on how to create separate services or micro-services for Meteor?
Presently my app has two components - an admin app and a client app and they both share the same server collection code so they can both work with all the required collections and call Meteor Methods etc.
But how does one go about writing a server-only service? Does it just use the server collection code it requires and then omits any of the client packages? Any advice would be great. Sorry to post this here but was following the conversation.
 evolross
on 3 Dec 2018
evolross
on 3 Dec 2018
Can folks try updating to the latest Meteor 1.8.1 beta to see if this is fixed?
meteor update --release 1.8.1-beta.8
Note that this version uses Node 8.14.0 and [email protected] (the Meteor package), which uses [email protected] (an npm package), which includes this commit by @VeselyT, which should allow excess (non-recycled) fibers to be garbage collected.
See also #10359.
benjamn
on 6 Dec 2018
@benjamn the logic being that the issue in the issue in this thread also triggers a lot of Fibers which are never returned to the pool.
Maybe a nice start to verify this would be running the reproduction listed in the older Fiber spike issue mentioned by hwillson?
KoenLav
on 7 Dec 2018
@KoenLav thanks for your effort on this,
I am running meteor on EC2 (with MUP docker deployment tool) and Mongodb atlas,
I am facing the same problem unexpected CPU hang on EC2 , option is to reboot to put it on normal stage.
Do you guys find any solution? as i was going through this discussion, and was not able to find any particular solution for this issue.
 vinaykevadia
on 4 Jan 2019
vinaykevadia
on 4 Jan 2019
@vinaykevadia we managed to mitigate the issue in one of our services by limiting the amount of 'hard calculation' we are performing there.
We are however currently experiencing this issue again, in another service where reports are generated based on a decent amount of data. I'm working on profiling this specific issue now.
The only thing that has helped for us, so far, is spray painting with solutions and hoping somethings sticks.
KoenLav
on 4 Jan 2019
Do you guys find any solution?
I solved it by removing almost all publications, and replace them by polling. Try to find your most expensive publication, and get rid of that one first.
https://github.com/meteor/meteor/issues/9796#issuecomment-411373831
smeijer
on 4 Jan 2019
@KoenLav, I am a bit curious about your situation though.
Previously we subscribed to this collection at startup, and clients could remain running that same subscription for weeks if not months. Now we refresh the subscription every 6 hours (by stopping it and resubscribing).
...
Luckily we managed to isolate the client which performed this action relatively quickly, and the issue disappeared the second I closed the browser window on their machine.
Do I understand correctly, that your users (/clients), keep their browser open for several months? No reboot, or even a simple F5 browser refresh?
I think that if something like this could indeed be a problem, that Meteor should add the (optional) refreshing of subscriptions on an given interval to the core. If I understnad it correctly, and that's what your problem fixed.
smeijer
on 4 Jan 2019
@smeijer we provide a cash register system for hospitality establishments based on a combination of Meteor, React, Electron and Cordova (slowly migrating to React Native). Some of these cash registers (behind a bar, for instance) will just be "always on". Hence subscriptions are never refreshed (unless we do so manually).
Before we used to have a monolithic application, as such reports and the like were also generated in the same application (which was just poor design) and this may have been the cause of the issue there (rather than the long-standing publications).
Now we have migrated these reports to the backoffice service, which is accessed via the browser (rather than Electron/Cordova), and the problem reappeared. Hence it's unlikely to have anything to do with (long-standing) publications (in this specific case). We have isolated the cause of the issue, which is generating a big (but nog huge) report based on sales data for the past year, and have instrumented the application to allow for easy profiling based on the qualialabs:profile package by @veered.
In my opinion the issue isn't that the CPU spikes to 100% (I mean, that can just happen, especially on computationally heavy tasks), but rather the fact that it remains at 100% CPU even after completing the task (which seems to be happening right now).
I intend to provide a profile of the application while it is performing the heavy computations (which I don't think will render much, if any, interesting results) and one after it has finished the heavy computations (which I expect will show some kind of endless loop in Meteor/Fiber/Node/V8 internals).
KoenLav
on 6 Jan 2019
This isn't meant to be a solution to the problem, but as a work-around and perhaps a more optimized approach to generating these reports, have you considered using Meteor Methods to gather and return the data? Why use pub-sub and "real-time" data for a static report that is pulling a year's worth of data?
evolross
on 7 Jan 2019
@evolross this may not have been clear from my earlier comment, but generating the report is the issue (not subscribing to it afterwards).
The issue also appears when we only generate and don't even subscribe at a later point in time.
Your point is valid nonetheless, from an architectural perspective, but not relevant for this specific issue.
Besides the end result of aggregated data is still less than 128KB, so subscribing shouldn't be an issue (although I agree it's also not necessary).
KoenLav
on 7 Jan 2019
This probably isn't helpful because you mentioned nothing has changed but I've seen issues like this time and time again in our apps when the size of certain publications gets too big and/or when there are too many subscribers to large publications.
Just yesterday I refactored one of our apps that was subscribing to a (static) collection that has grown over the years to hundreds of thousands of documents for admin users (because they could see everything). Generally performance was ok, but one admin signing in brought the entire server to a halt for minutes on end, if not for good.
By getting the data via a Meteor.method and using a mongo aggregation on the sever side for good measure, these CPU spikes are (again) a thing of the past. That said, I didn't refactor another publication that only contains around 300 documents and it alone causes a spike of 50% CPU usage on our small server instance upon subscribing (again, admins only - everyone else only gets a handful of docs). They are not big documents either- in total the data that gets to the server is only about 120kb, like in your instance.
So, based on many experiences with this over the past 5 years I'd strongly recommend for any production app to use Meteor Methods (or these days just GraphQL) for anything that doesn't absolutely need updates in real-time.
 ephemer
on 26 Apr 2019
ephemer
on 26 Apr 2019
@ephemer What are you using to do a "mongo aggregation on the server side"? Is this a certain package?
evolross
on 26 Apr 2019
In Wekan https://wekan.github.io , these fixes were implemented to improve performance:
1) Add more indexes to MongoDB https://github.com/wekan/wekan/pull/2214 . This did lower MongoDB CPU usage a lot, and make Wekan a lot faster, so Wekan is usable for large amount of users.
2) Load only those cards from MongoDB that are visible, having infinite scroll https://github.com/wekan/wekan/pull/2144 and https://github.com/wekan/wekan/pull/2287 . These made possible to load large kanban boards that were originally imported from Trello to Wekan.
There is still a lot more possibilities to improve, like for example using new MongoDB 4.x features like aggregate queries. Wekan has Meteor 1.8.1 and MongoDB 4.0.7 in testing at meteor-1.8 branch, so it works in Docker, so when sometime I get Meteor 1.8.1-based Wekan also working in Snap and Sandstorm then it's possible to start looking at aggregate queries, or even earlier, but currently Wekan is fast enough so it's not urgent yet. Currently Snap and Sandstom Wekan still uses Meteor 1.6.x.
xet7
on 26 Apr 2019
@ephemer we still have a subscription to a collection which receives a lot of inserts, updates and deletes. However we cancel the subscription and resubscribe every 6 hours, limiting the 'exposure' to this potential issue.
Additionally we used to provide a reporting service (which was poorly written to begin with) within our operational service; this reporting service could clog up the entire server leaving no room to process the oplog, which caused another issue (fallback to polling).
All-in-all we noticed that subscriptions perform poorly when they receive either a large number of events or limited events with large payloads.
KoenLav
on 28 Apr 2019
This issue has been automatically marked as stale because it has not had recent activity. It will be closed if no further activity occurs. Thank you for your contributions.
![stale[bot] picture](https://avatars.githubusercontent.com/in/1724?v=4&s=40) stale[bot]
on 10 Dec 2019
stale[bot]
on 10 Dec 2019
So I noticed @vlasky mentioning a performance regression in Meteor 1.9 (Node 12) and I thought let's check how the Fiber bomb repro performs on 1.9 vs 1.8:
Press set and unset 5 times (set, unset, set, unset, etc.), 10 presses total (5 each), this will create +/- 100.000 fibers (depending on system speed).
On Meteor 1.9 the CPU will be 100% for 180 sec
On Meteor 1.8 the CPU will be 100% for 60 sec
I think, again, there is definitely an issue in Node.js which needs resolving, but I would like to repeat that I think Meteor should also make improvements, like:
https://github.com/meteor/meteor/pull/10478
You can see the performance improvements from that PR in the Fiber repro repository clearly.
KoenLav
on 29 Dec 2019
So what's the story with this? Definitely a blocker for us to upgrade to Meteor 1.9.
 elie222
on 24 Jan 2020
elie222
on 24 Jan 2020
@elie222 the problem has been solved. The release version of Meteor 1.9 runs well.
 vlasky
on 24 Jan 2020
vlasky
on 24 Jan 2020
@evolross sorry I didn't get notified about your question here. In case you're still wondering, a mongo aggregation on the server side performed in a method looks like this (no libraries etc. required):
const MyCollection = new Mongo.Collection("my-collection");

Meteor.methods({
  myMethod(params) {
    return MyCollection.rawCollection().aggregate([
      { $match: { _id: { $in: params.ids } } },
      { $limit: 10000 }
      { $group: { _id: { ...blah... } } },
      ...etc
    ])
    .toArray(); // returns a Promise, which Meteor can handle natively
  }
});
This issue has been automatically marked as stale because it has not had recent activity. It will be closed if no further activity occurs. Thank you for your contributions.
stale[bot]
on 31 Oct 2020
Has this issue been fixed? I doubt that closing this one due to inactivity alone, is the right thing to do.
smeijer
on 31 Oct 2020
Nope.
The underlying issue in Node.js which caused fiber bombs to bring the server to a crawl has been resolved, but fiber bombs still exist and the reproduction repo still shows hugea huge slowdown when a large amount of documents are updated when subscribed to.
My PR, outstanding for about two years now, addresses this issue.
KoenLav
on 31 Oct 2020
We don't want to hide/close unsolved important issues, this was just a rename of labels that is already finished and stale-bot is working as expected again.
 filipenevola
on 11 Nov 2020
filipenevola
on 11 Nov 2020
Related issues
 ADobrzycki
·
82Comments
ADobrzycki
·
82Comments
 avital
·
221Comments
avital
·
221Comments
 giacecco
·
80Comments
giacecco
·
80Comments
 cdcv
·
227Comments
cdcv
·
227Comments
 Jayuda
·
85Comments
Jayuda
·
85Comments
Most helpful comment
I have a different suggestion to the CPU hogging issue. At the bottom of the description of https://www.npmjs.com/package/fibers an issue of GC trying to unwind an fiber but causes an endless loop. In doc_fetcher.js there is a while loop with ejson.clone and then call the callback which swallows errors.
I have some small evidence to this by using gdb to core dump a few times on CPU hogging instances. I then load it into llnode and look at the stack. All times it's been busy in the ejson clone call inside the doc fetcher.
Evidence that this loop could occur is the issue #10032 . To my knowledge however using of custom fields is not the cause for my infinity loop.