Metatron-discovery: Introduce engine(druid) monitoring function
Is your feature request related to a problem? Please describe.
We should consider creating an administration tool to figure out how to manage druid better.
Describe the solution you'd like
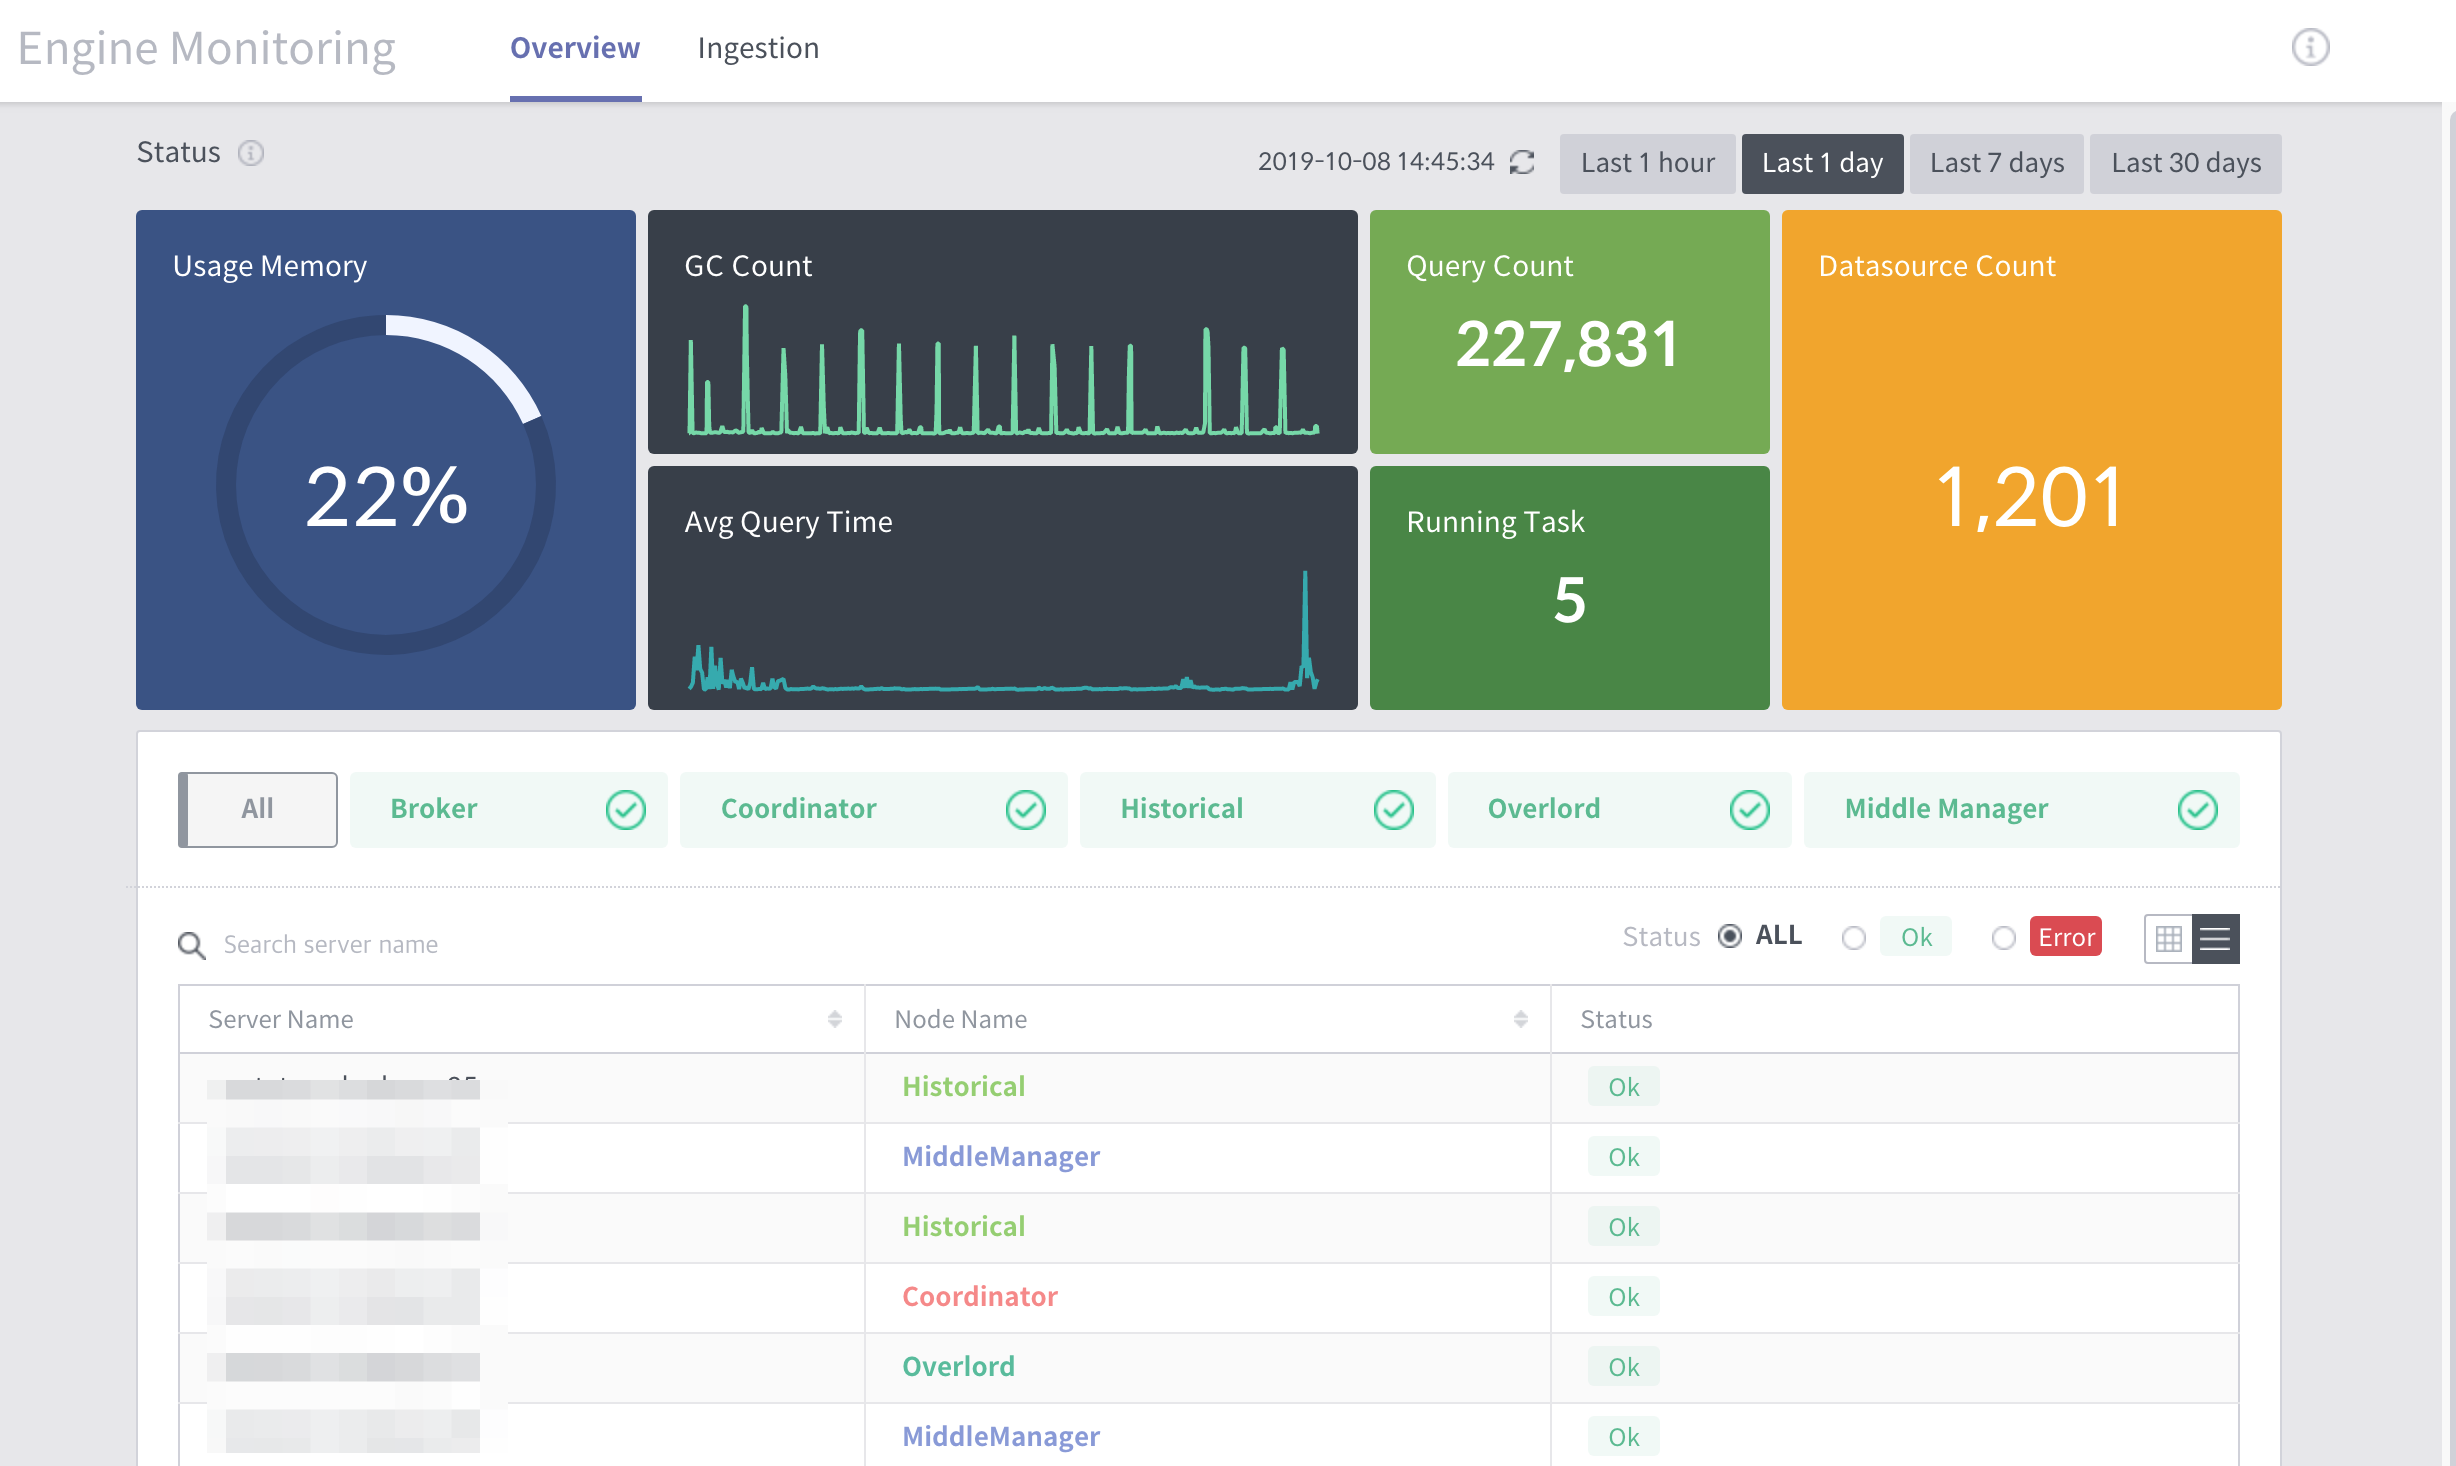
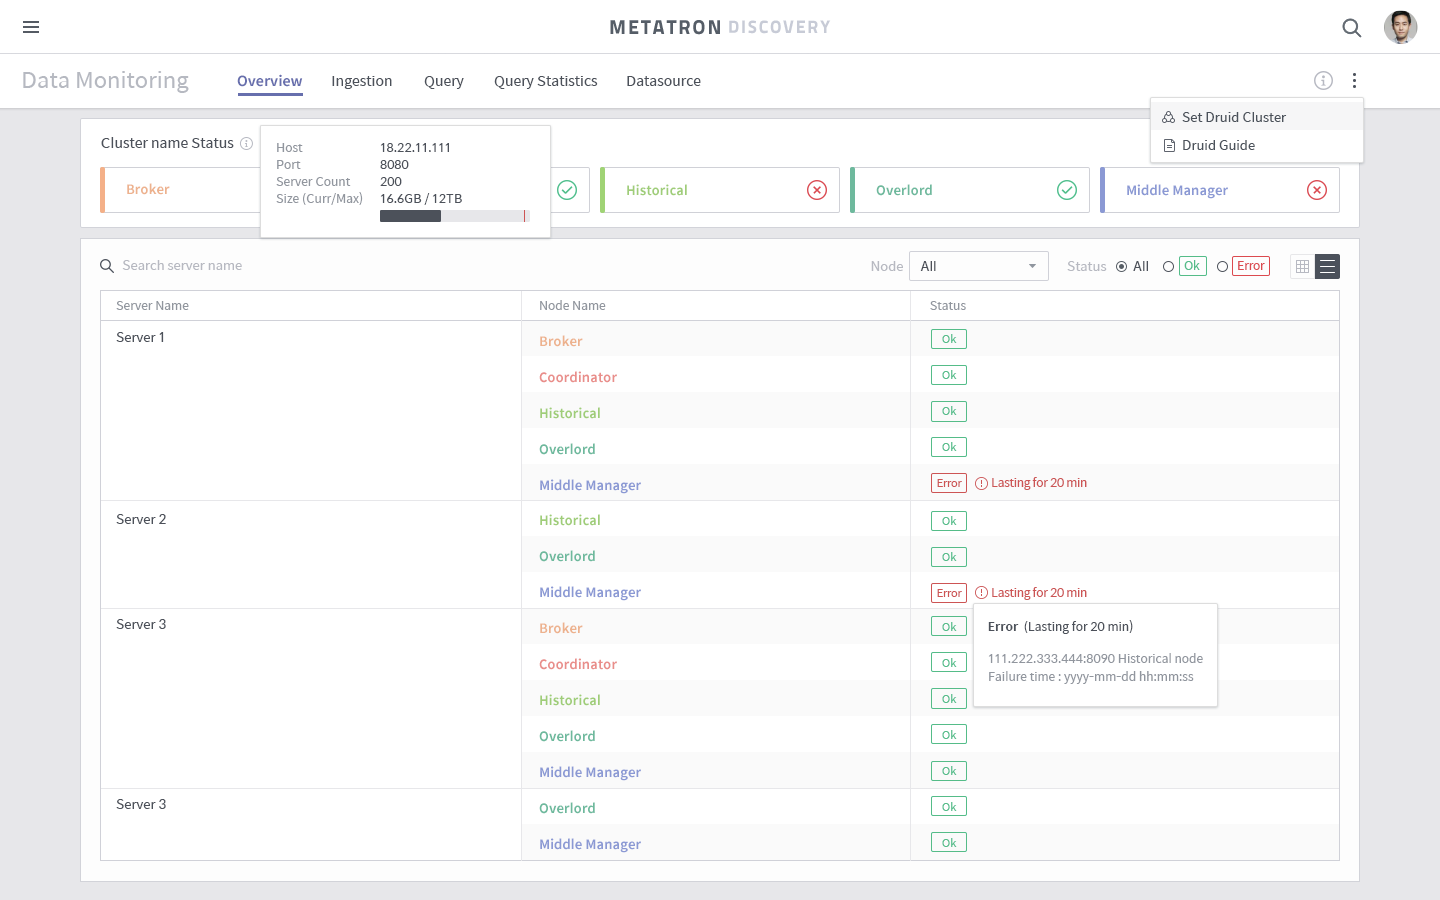
- Overview : We should be able to check the server status in Druid cluster and get comprehensive statistics.
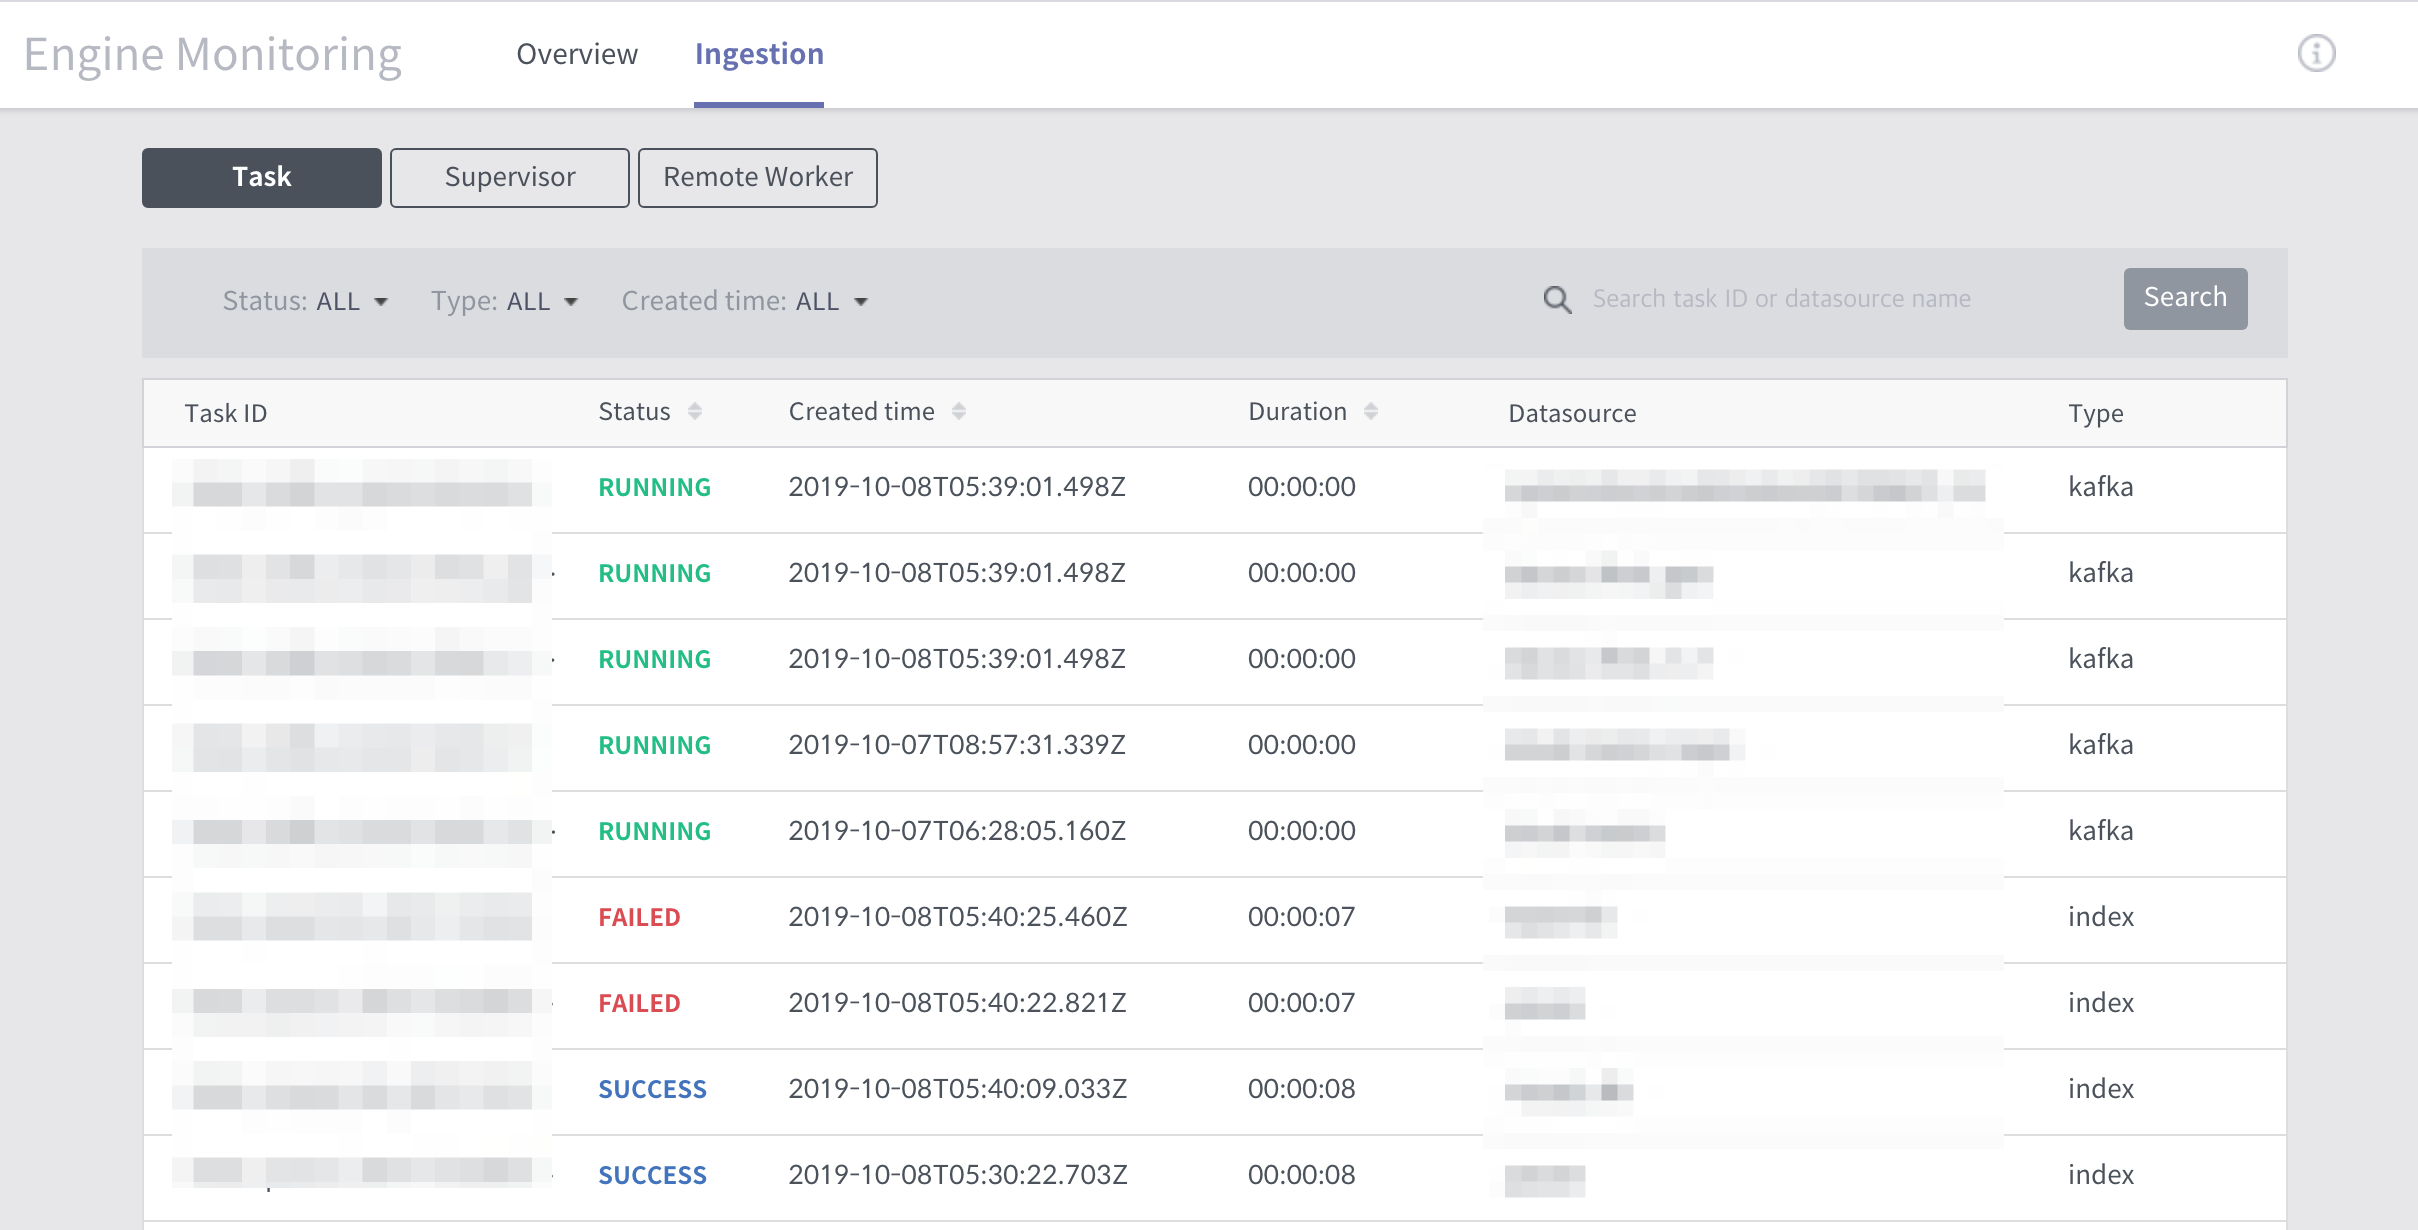
- Ingestion : We should be able to check the status of the ingestion tasks(include supervisors).
※ Additional features will be released in the 3.4 pre-release :)
 deidera08
All 21 comments
@AnnieHwang 디자인 공유드립니다
- Overview list
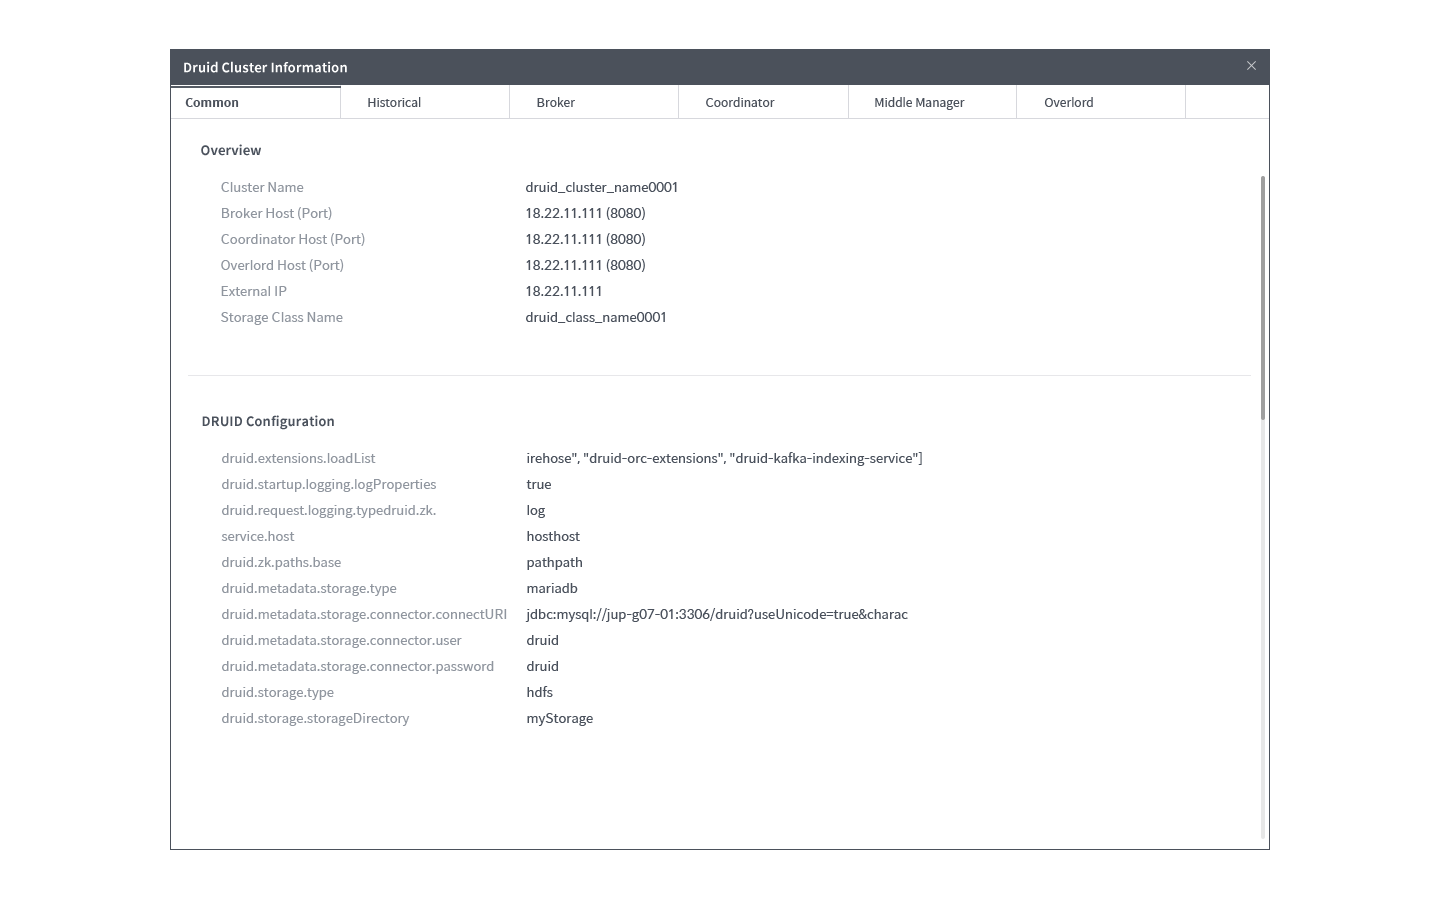
- Druid Cluster Information > common
 koeun222
on 11 Feb 2019
koeun222
on 11 Feb 2019
@AnnieHwang, @koeun222 모니터링 항목 들은 구체화될 예정인거죠? ppt 파일에 내용은 그냥 property 정도 인 듯 하네요~
 Taehui
on 11 Feb 2019
Taehui
on 11 Feb 2019
@Taehui
일정이 촉박하여 우선 구현할 수 있도록 내용을 많이 축소하여 이슈등록을 하였습니다.
Overview화면은 좀 더 보완/개편될 예정입니다.
deidera08
on 11 Feb 2019
@AnnieHwang @koeun222
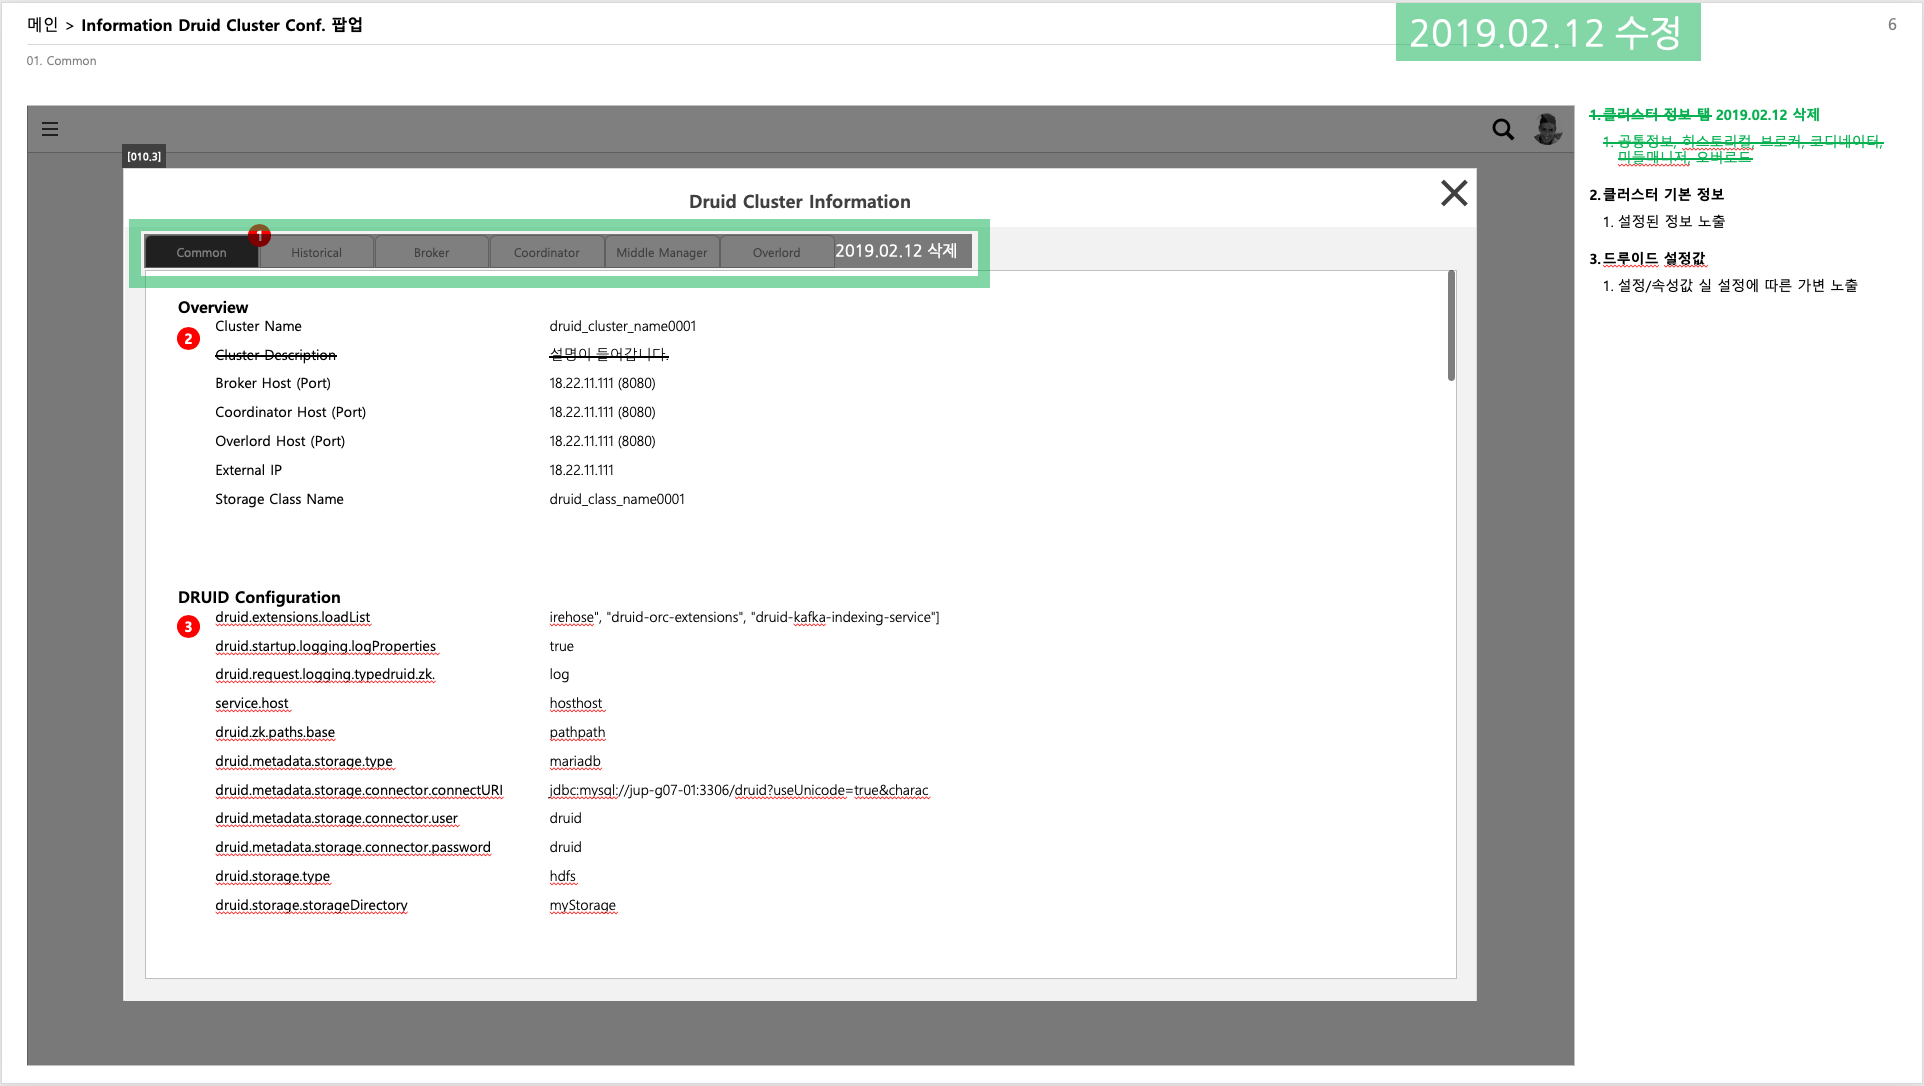
Cluster 정보 팝업 화면이 수정되었습니다.
각각의 node별로 탭을 구성하기 어려운 부분이 있어 삭제하고
한 화면에 Cluster의 전체 정보를 담게 되었습니다.
참고 부탁드립니다.
deidera08
on 12 Feb 2019
@deidera08 엔진 모니터링 메뉴 순서 확인 부탁드립니다

- 이슈 코멘트에는 데이터 스토리지 다음에 추가해달라고 하셨는데
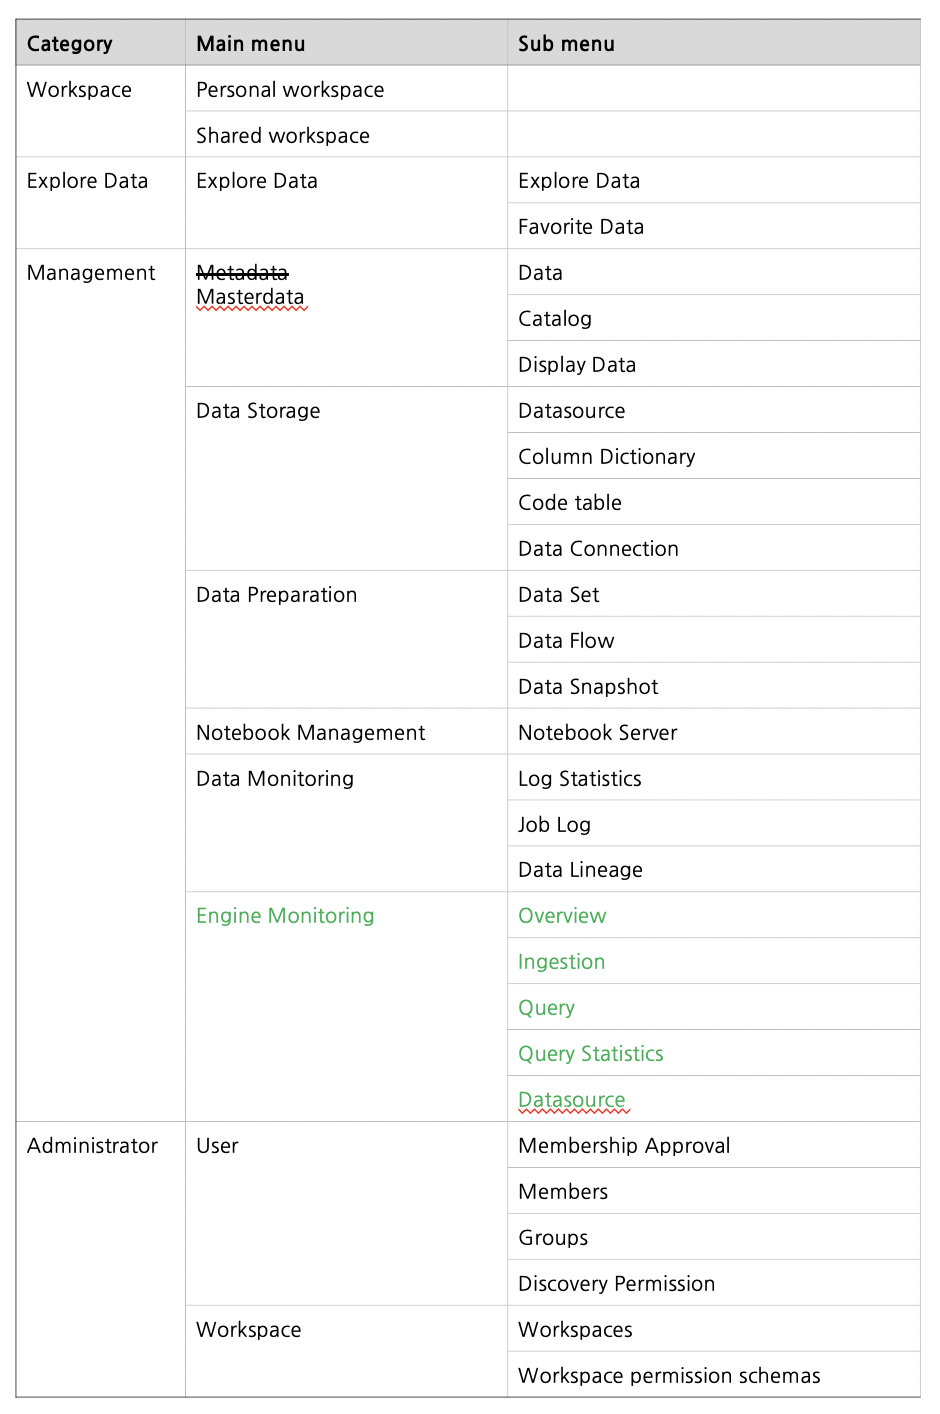
- 기획서에는
엔진 모니터링이 데이터 모니터링 다음에 있습니다. 이슈에 적어주신대로 데이터 스토리지 다음에 엔진 모니터링 메뉴 추가하면 될까요?
 ninezero90hy
on 15 Feb 2019
ninezero90hy
on 15 Feb 2019
@ninezero90hy
제가 이슈에 잘못적었네요. 혼동을 드려서 죄송합니다.
표에 나열한대로 Management 하위에 Data Storage와 동일한 Depth로 부탁드립니다.
deidera08
on 15 Feb 2019
@deidera08 넵 확인 감사합니다 :)
ninezero90hy
on 15 Feb 2019
@ninezero90hy
너무 지연되고 있어서 우선 Overview 화면에서의 조회용 API 먼저 공유 드립니다 😭
궁금하시거나 더 필요하신 것 있다면 말씀해주세요.
- Overview - 서버 타입별 상태 조회
- request :
(GET) /api/monitoring/servers/health - response body :
{
    "coordinator": "true",
    "historical": "true",
    "middleManager": "true",
    "broker": "warn",
    "overlord": "true"
}
- Overview - 전체 서버 목록 조회 (상태 포함)
- request :
(GET) /api/monitoring/ - response body :
{
    "_embedded": {
        "monitorings": [
            {
                "id": "a2ba4b2d-90ac-4b7e-9abe-e67407f229c0",
                "type": "overlord",
                "port": "8090",
                "hostname": "localhost",
                "status": "true",
                "_links": {
                    "self": {
                        "href": "http://localhost:8180/api/monitoring/a2ba4b2d-90ac-4b7e-9abe-e67407f229c0"
                    },
                    "monitoring": {
                        "href": "http://localhost:8180/api/monitoring/a2ba4b2d-90ac-4b7e-9abe-e67407f229c0{?projection}",
                        "templated": true
                    }
                }
            },
            {
                "id": "c569271e-b6a7-4dfe-b133-492bcdcb1622",
                "type": "middleManager",
                "port": "8091",
                "hostname": "localhost",
                "status": "true",
                "_links": {
                    "self": {
                        "href": "http://localhost:8180/api/monitoring/c569271e-b6a7-4dfe-b133-492bcdcb1622"
                    },
                    "monitoring": {
                        "href": "http://localhost:8180/api/monitoring/c569271e-b6a7-4dfe-b133-492bcdcb1622{?projection}",
                        "templated": true
                    }
                }
            }
        ]
    },
    "_links": {
        "self": {
            "href": "http://localhost:8180/api/monitoring{?page,size,sort,projection}",
            "templated": true
        },
        "profile": {
            "href": "http://localhost:8180/api/profile/monitoring"
        }
    },
    "page": {
        "size": 20,
        "totalElements": 5,
        "totalPages": 1,
        "number": 0
    }
}
- Overview - 차트 조회
- request :
(POST) /api/monitoring/query - request body :
{
    "fromDate": string,
    "toDate": string,
    "granularity": string,
    "monitoringTarget": object,
    "resultFormat": object
}
resultFormat은 기존과 그대로 사용해주시면 됩니다.
monitoringTarget의 경우 filter를 간단하게 적용하기 위해 사용되는 값으로
"monitoringTarget": {
        "service": string,
        "host": string,
        "metric": string
    }
형태로 이루어지며, metric이 가질 수 있는 값은 아래 4가지 입니다.
"MEM_MAX"
"MEM_USED"
"GC_CPU"
"GC_COUNT"
- response body :
{
    "rows": [
        "2019-02-25",
        "2019-02-26",
        "2019-02-27"
    ],
    "categories": [],
    "columns": [
        {
            "name": "value",
            "value": [
                19889536890762,
                23987421705677,
                6886588415250
            ],
            "percentage": []
        }
    ],
    "info": {
        "maxValue": 23987421705677,
        "minValue": 6886588415250
    }
}
 alchan-lee
on 5 Mar 2019
alchan-lee
on 5 Mar 2019
@alchan-lee
안녕하세요. Engine Monitoring을 맡게된 서성준 입니다.
현재 Local에서 만들어주신 api호출 하였더니 데이터가 없습니다.
샘플데이터 넣을려면 어떻게 해야 할까요?
 nogah12
on 19 Mar 2019
nogah12
on 19 Mar 2019
@alchan-lee
다음 API 호출 시 서버명, node, 상태 등 필터 기능을 추가 해야 합니다.
Overview - 전체 서버 목록 조회 (상태 포함)
request :(GET) /api/monitoring/
nogah12
on 20 Mar 2019
@nogah12
확인이 늦어진 점 죄송합니다..
말씀하신 API 적용되는대로 공유 드리겠습니다.
alchan-lee
on 21 Mar 2019
@nogah12
아.. 제가 헷갈렸군요 ㅠㅠ
말씀하신 API에 parameter로 조건을 주시면 됩니다.
적용가능한 값은 아래 5가지 입니다.
id, type, port, hostname, status
ex)
(GET) /api/monitoring?id=305a3d69-2693-48cf-9dd0-c343476b589a
(GET) /api/monitoring?type=broker
(GET) /api/monitoring?port=8081
(GET) /api/monitoring?hostname=localhost
(GET) /api/monitoring?status=true
alchan-lee
on 21 Mar 2019
그리고 처음에 말씀하신 샘플데이터는 별도로 생성하실 필요없고
10분 주기로 설정을 파싱해서 업데이트 하게 해두었습니다.
별도 설정이 없다면 application.yaml 파일을 참고해서 localhost 정보를 입력하게 되니
로컬에 druid를 실행하신 뒤 테스트하셔야 합니다
alchan-lee
on 21 Mar 2019
@alchan-lee
로컬에 druid를 실행 하였고 서버에서
EngineMonitoringJob : ########### engine monitoring job : check server health
실행되는것도 확인 하였지만 polaris.engine_monitoring 테이블에 데이터가 적재가 되지 않습니다.
다른것도 확인해야 되나요?
nogah12
on 22 Mar 2019
@alchan-lee 이 이슈 중심으로 ingestion 항목까지 포함 부탁드립니다.
(https://github.com/metatron-app/metatron-discovery/issues/1415, https://github.com/metatron-app/metatron-discovery/issues/1416)
 kyungtaak
on 8 Apr 2019
kyungtaak
on 8 Apr 2019
@nogah12
EngineMonitoringSetter: ########### engine monitoring job : find target servers
이 잡이 수행된 이후에 db에 저장되는데요,
혹시 이 로그 이후에도 저장되지 않는다면 해당 시점 로그 공유 부탁드립니다.
alchan-lee
on 10 Apr 2019
@alchan-lee
slack 에 문의 드렸던 API 관련해서 확인 부탁드립니다.
 eltriny
on 26 Apr 2019
eltriny
on 26 Apr 2019
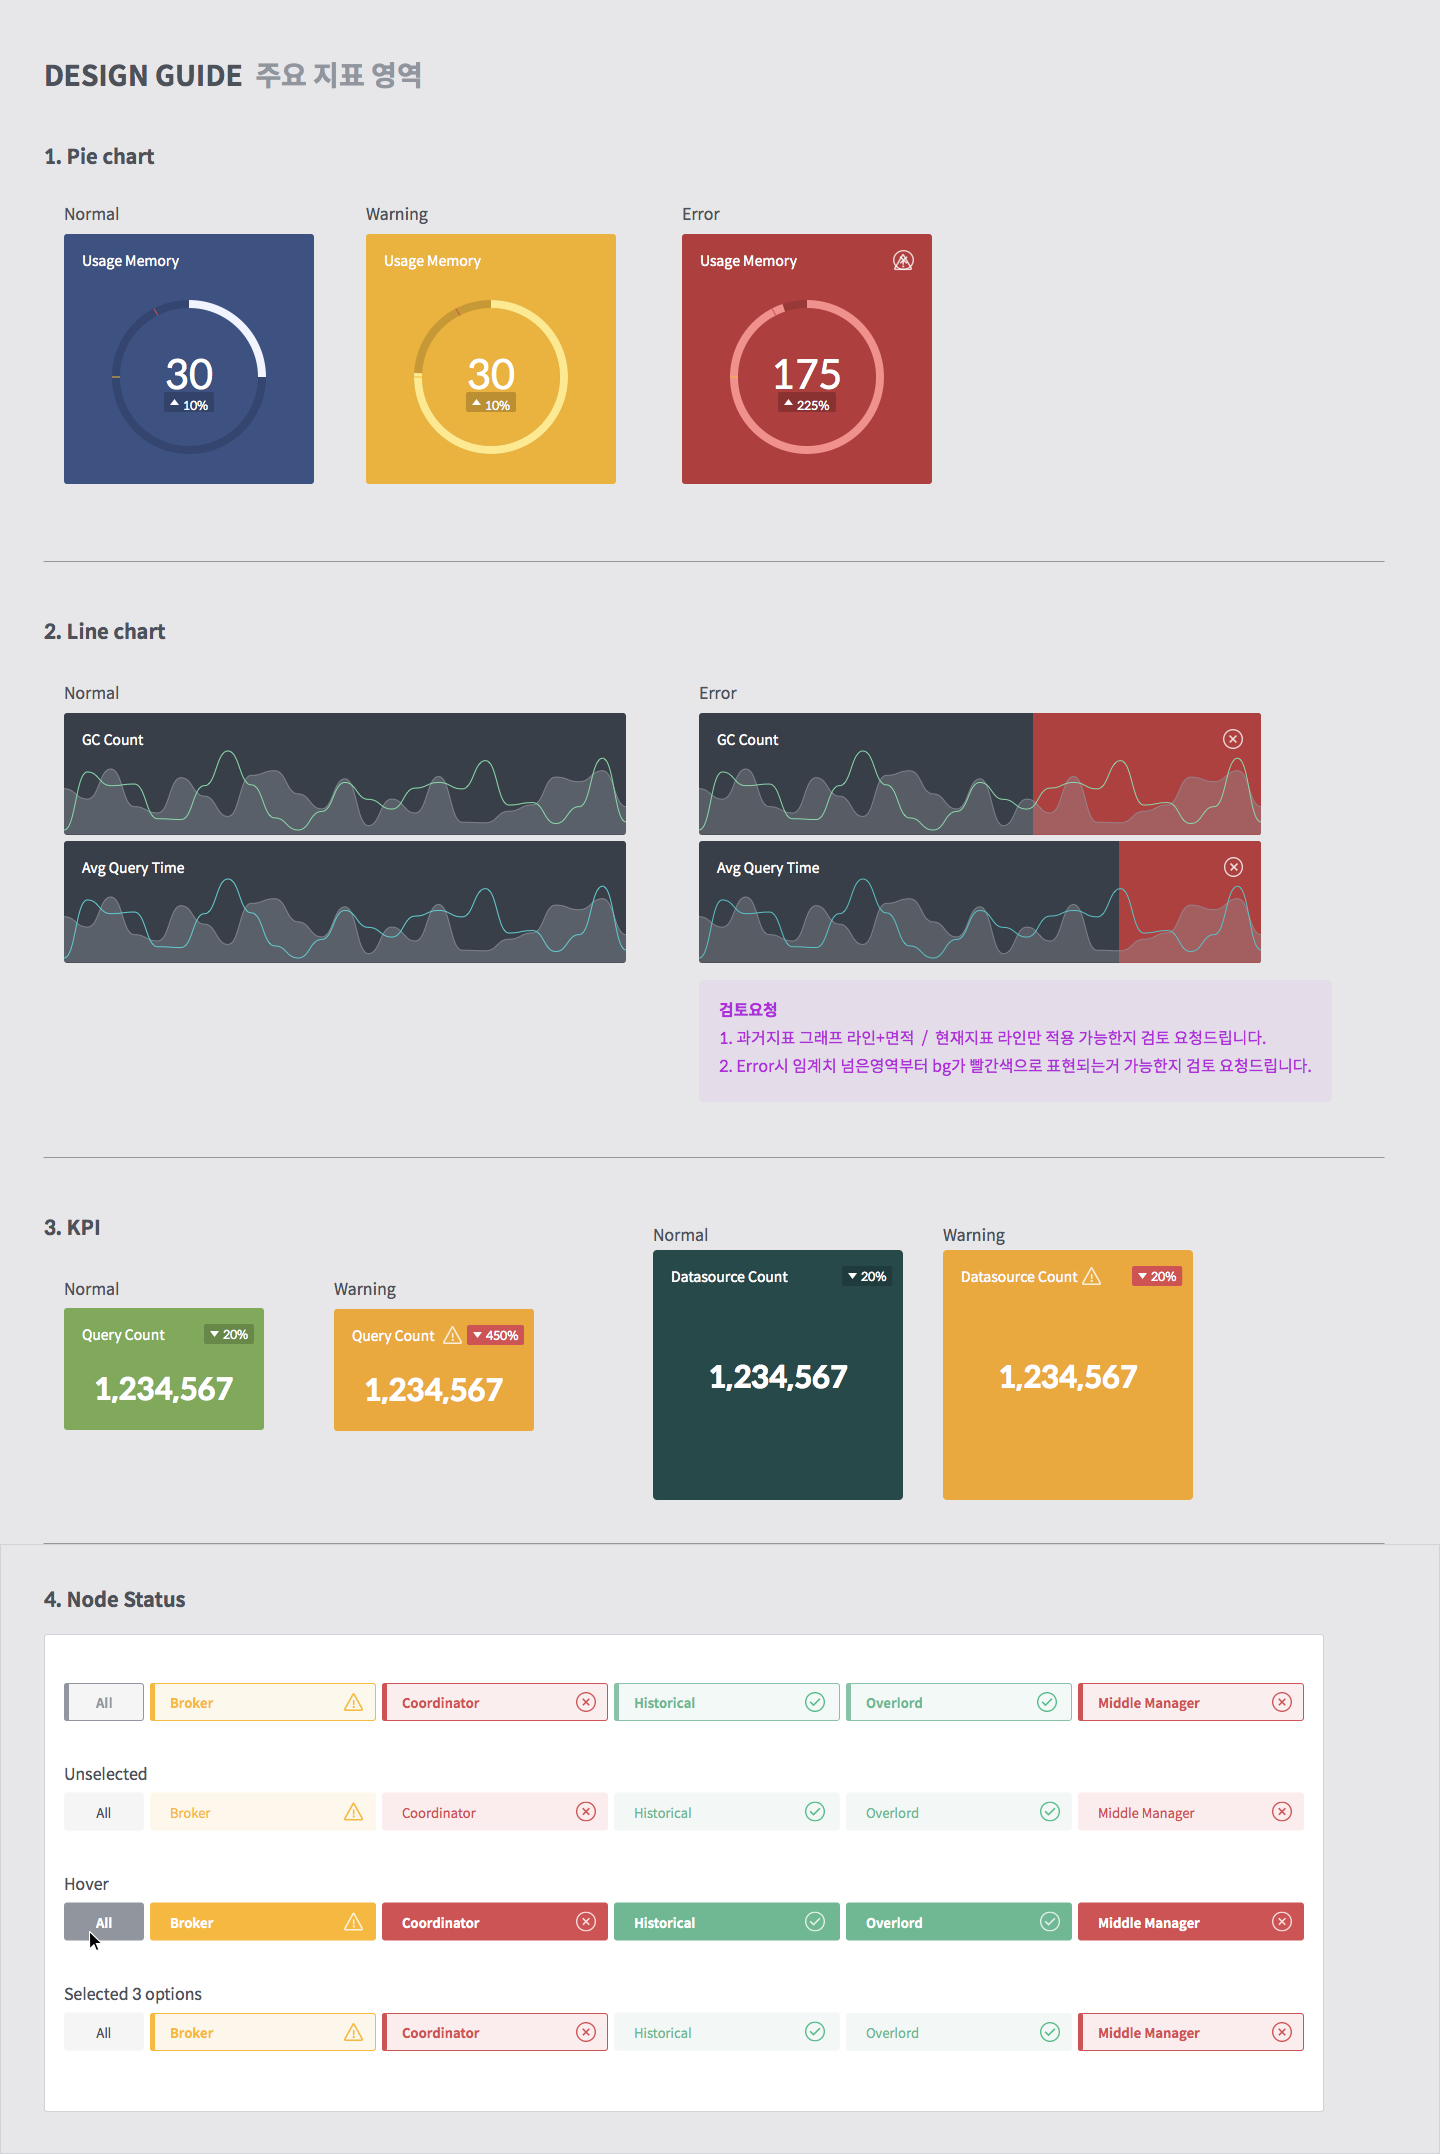
@koeun222 Overview화면 디자인을 좀 수정해주실수 있으신가요?
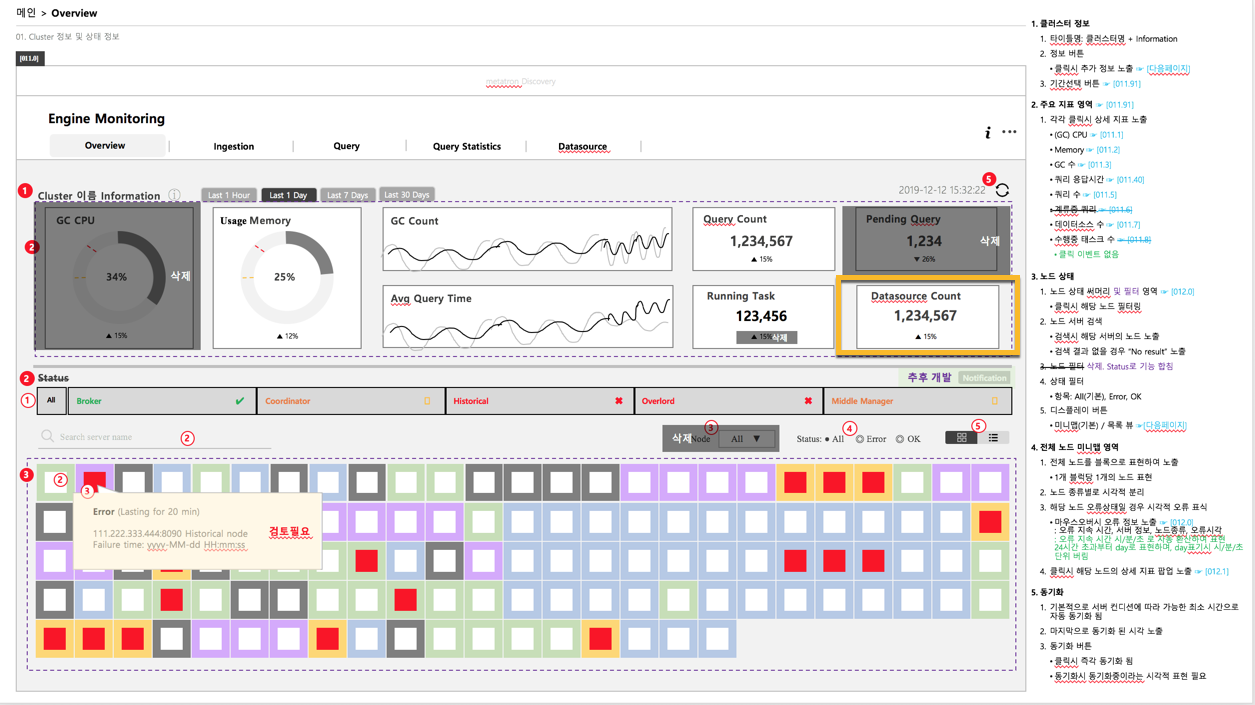
Datasource Count(노란박스)의 위젯 높이를 100%로 만들어주실수 있으신가요? 그리고 맨 앞에 GC CPU는 삭제되었어요.
 AnnieHwang
on 4 Sep 2019
AnnieHwang
on 4 Sep 2019
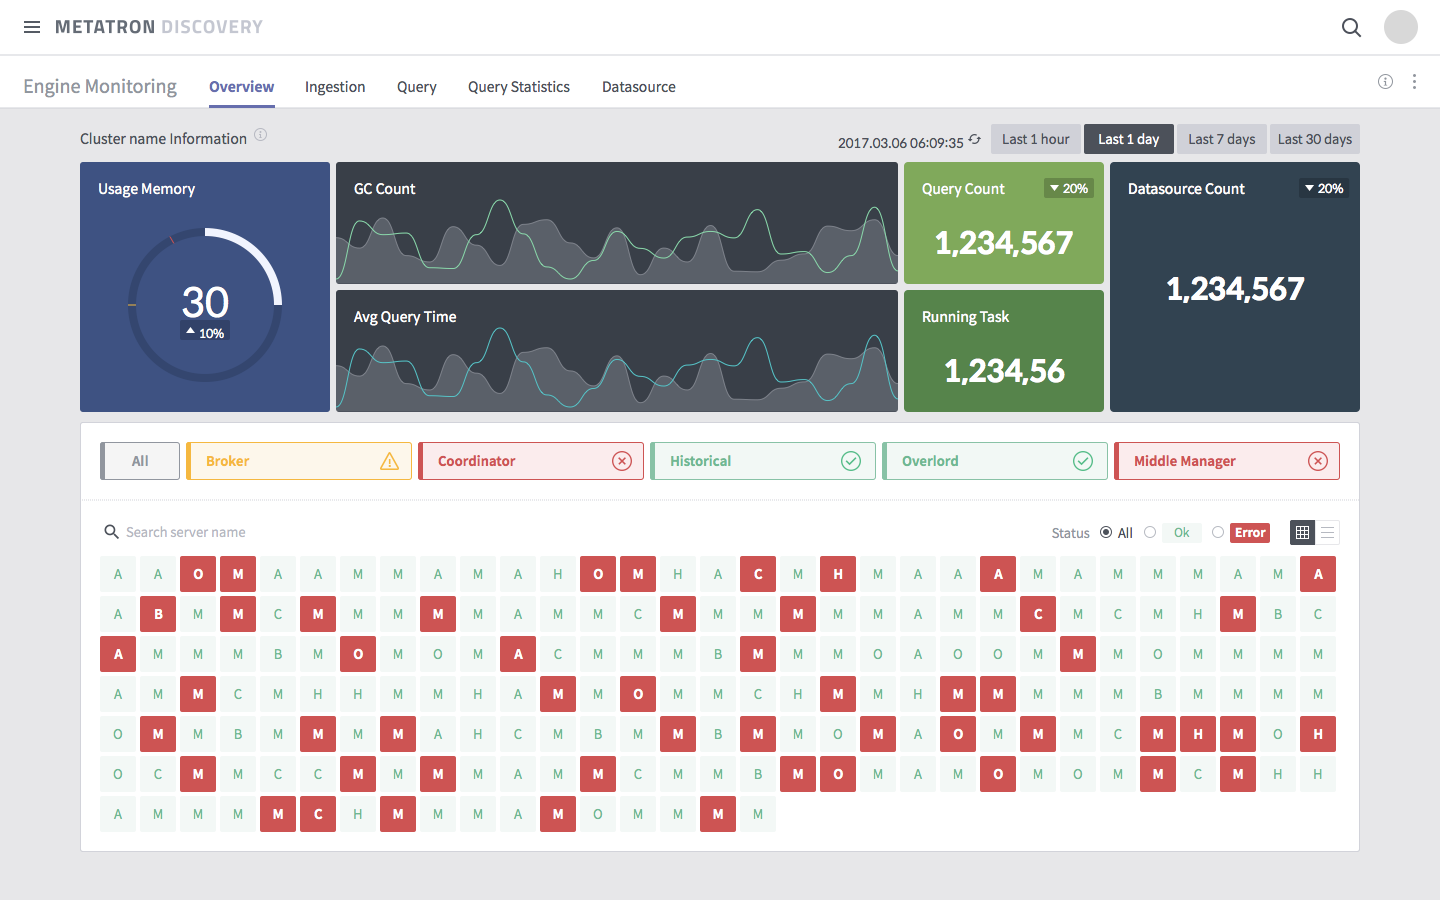
디자인 공유드립니다. 퍼블까지 진행되었습니다
koeun222
on 19 Sep 2019
@minhyun2 @eltriny 개발 진행부탁드려요.
AnnieHwang
on 19 Sep 2019
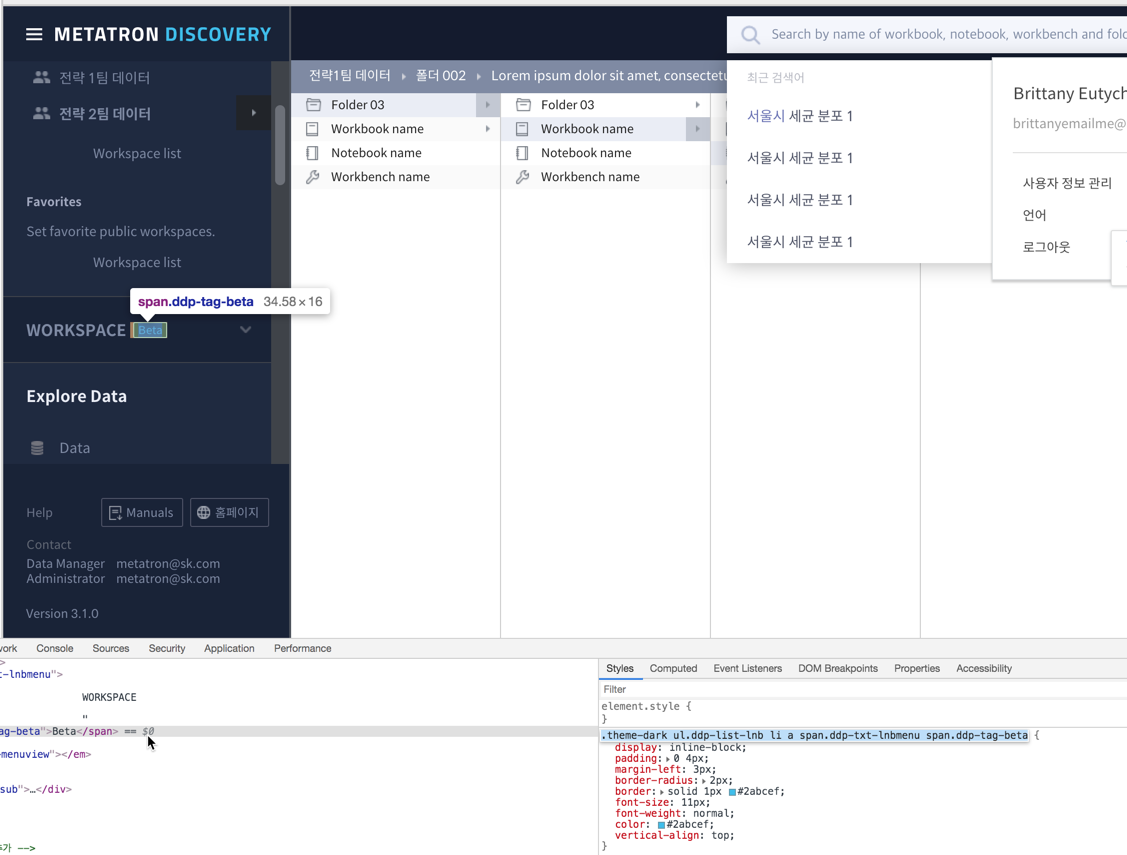
@eltriny Beta 뺏지를 메뉴에 붙어야 할것 같은데 현재는 2depth에만 붙여지게 퍼블이 되었더라고요. 3depth(메뉴 : Management > Engine Monitoring)에도 붙을 수 있게 퍼블 변경 부탁드려요.
AnnieHwang
on 20 Sep 2019
Related issues
 ufoscw
·
8Comments
ufoscw
·
8Comments
 hashansl
·
3Comments
kyungtaak
·
6Comments
AnnieHwang
·
8Comments
hashansl
·
3Comments
kyungtaak
·
6Comments
AnnieHwang
·
8Comments
 minjung-cho
·
3Comments
minjung-cho
·
3Comments