I have been searching a lot how to debug scala in vscode without success. Wondering if there is a way or if you guys are working on that at the moment?.
 virtualdvid
All 17 comments
We are working on it, but there is still some way to go.
 tgodzik
on 12 Aug 2019
tgodzik
on 12 Aug 2019
Awesome, this will put more users of scala in vscode. This's a common frustration I found online and we end using eclipse (which I don't like) Thanks for your answer!
virtualdvid
on 12 Aug 2019
Since https://github.com/scalacenter/bloop/pull/1087 was merged into Bloop, it's possible to breakpoint debug Scala/Java sources that are defined in the workspace. After #1010, it will be possible to debug 3rd party libraries as well. Once that's merged then this issue can be closed.
 olafurpg
on 11 Nov 2019
olafurpg
on 11 Nov 2019
I'm curious, the Bloop documentation states:
_If you want to debug your code with Bloop via an editor such as VS Code, vim, Sublime or emacs you can use Metals._ [1]
Are they just jumping the gun on their decree?
[1] - https://scalacenter.github.io/bloop/docs/debugging-reference#debugging-via-an-editor
 ctataryn
on 20 Dec 2019
ctataryn
on 20 Dec 2019
@ctataryn It's not yet possible, from what I see we still need to finish a couple of things.
tgodzik
on 23 Dec 2019
v0.8.0 is out, supporting this feature! Check out the release notes https://scalameta.org/metals/blog/2020/01/10/cobalt.html#debugging
 gabro
on 14 Jan 2020
gabro
on 14 Jan 2020
Hi, Thank you for this release! I'm getting an issue.
I created a hello.scala script to test it. In the cmd:
C:\Users\myuser\project\scala\my_project>scala hello.scala
Hello World!
But when I use the debugger option in vscode nothing happens:
This is happening in my personal and job laptop.
virtualdvid
on 24 Jan 2020
@virtualdvid when I debug, what happens is above the Hello object there’d be a “Run | Debug” insight that appears.
Click on the “M” icon on the left toolbar, then run the “Doctor” to see if there are any problems. I know for me it wasn’t until I upgraded my project’s Scala version that it all started working.
ctataryn
on 24 Jan 2020
Hi @ctataryn, Thanks for your answer. I got several bugs solved. I did it from scratch since uninstalling vscode. I'm getting now all test in doctor passing:
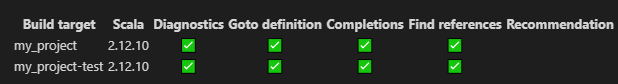
Same result as before, the debugger is not running.
virtualdvid
on 24 Jan 2020
@virtualdvid Hmmm, I'm not entirely sure then. What you could do is exit VSCode, remove the .metals folder, then re-start VSCode and the extension should ask you about "importing" your project again.
As a side note: I just opened VSCode an my Main.scala file was auto-loaded in a tab. I noticed that the Run | Debug options didn't appear until I switched to a different file, and then went back to Main.scala.
ctataryn
on 25 Jan 2020
@ctataryn I did what you said the same result on both laptops. Can you share your launch,json file?. I'm curious how that looks like. Thanks!
EDIT
Checking the logs the only warning is:
WARN no build target for: C:\Users\david\Documents\Documents\scala\my_proyect\src\main\hello.scala
my build.sbt
name := "MyProject"

version := "0.1"

organization := "MyMegaCorp"

scalaVersion := "2.12.10"

sbtVersion := "1.2.8"
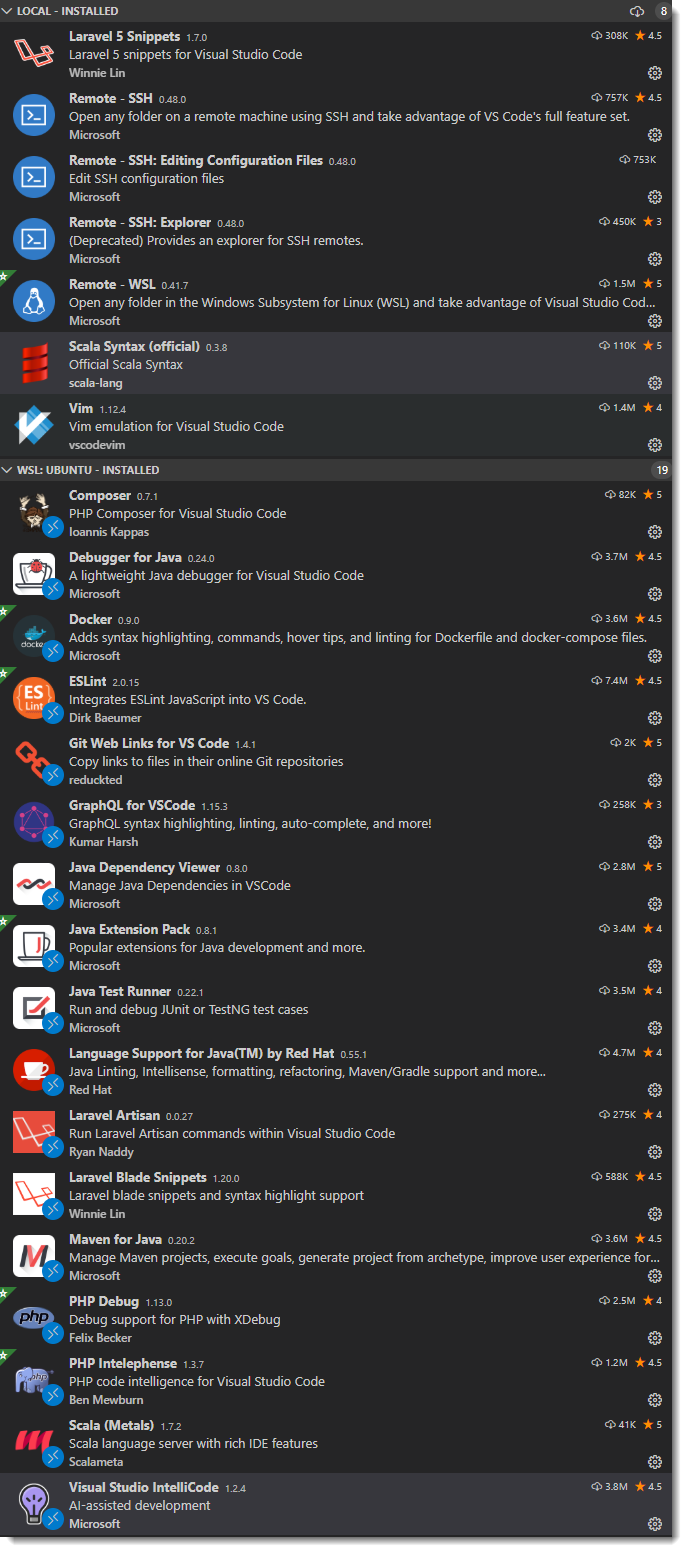
@virtualdvid actually the extension doesn't use launch.json and I don't recognize the "Debug and Run Start" pane you have there on the left. Perhaps it is another extension that's interfering? Here's a shot of extensions that I have installed, I'd suggest disabling all but Metals and any other essential extensions you may need.
👉 And also, double check to see that your Metals extension is at v1.7.2 👈
ctataryn
on 25 Jan 2020
@ctataryn Thanks for your help. I don't know what happened. I turned on my job laptop today and it is working. In my personal laptop stills the issue. Weird!
virtualdvid
on 25 Jan 2020
WARN no build target for: C:\Users\david\Documents\Documents\scala\my_proyect\src\main\hello.scala usually means that the build was either not imported of the directory structure does not correspond to that exported from the build tool.
tgodzik
on 27 Jan 2020
Thank you everybody for reporting back feedback! I encourage you to open a new issue to discuss bugs/problems you encounter. This issue here was mainly about introducing basic debugging functionality.
Debugging is a new feature with a large surface area so it's better to have focused issues on specific functionality. We are also aware that there are also some important features missing like run configurations (see https://github.com/scalameta/metals-feature-requests/issues/63)
olafurpg
on 27 Jan 2020
Am having a similar issue with debug not working - it seems to connect to the debug session, but never reaches the 1st breakpoint. It just sits there:
Output pane:
INFO  time: compiled forcomp in 0.95s
INFO  Listening for transport dt_socket at address: 56516
INFO  tracing is enabled: C:\Users\str_i\AppData\Local\scalameta\metals\cache\dap-server.trace.json
INFO  tracing is enabled: C:\Users\str_i\AppData\Local\scalameta\metals\cache\dap-client.trace.json
INFO  Starting debug proxy for [Main]
INFO  Trying to attach to remote debuggee VM localhost:56516 .
INFO  Attaching to debuggee VM succeeded.
note: I run debug by clicking the 'debug' link above the main entry point:

note: if I click on run it does run OK.
In the log there is a similar warning to what @virtualdvid had:
WARN no build target for: C:\sean\github\mrseanryan\scala-learning\projects\week6\tryout\src\main\scala\tryout\Main.scala
So maybe my project structure is incorrect 🤔
Perhaps someone could point me to a small example project, where debugging works ok ?
btw thanks for making this extension!
 mrseanryan
on 22 Feb 2020
mrseanryan
on 22 Feb 2020
Please open new tickets to start new discussions or ask questions.
olafurpg
on 22 Feb 2020
Related issues
 m4dc4p
·
4Comments
m4dc4p
·
4Comments
 fommil
·
3Comments
fommil
·
3Comments
 Michaelizm
·
4Comments
Michaelizm
·
4Comments
 iokacha
·
4Comments
iokacha
·
4Comments
 sideeffffect
·
4Comments
sideeffffect
·
4Comments
Most helpful comment
Since https://github.com/scalacenter/bloop/pull/1087 was merged into Bloop, it's possible to breakpoint debug Scala/Java sources that are defined in the workspace. After #1010, it will be possible to debug 3rd party libraries as well. Once that's merged then this issue can be closed.