Meshcentral: [Enhancement] CPU Temperature in Details tab
Hi MeshCentral Team,
Can you please capture CPU Temp logging in real time to the details tab ?
Thanks,
SomeGuru
 SomeGuru
All 17 comments
Bryan will need to research this. Not sure if there is a standard way to get temperature information, if there is, certainly something fun to add.
 Ylianst
on 20 Jan 2021
Ylianst
on 20 Jan 2021
I'd also like to see more data like this. Drive utilization/free space, RAM utilization, CPU utilization, etc would all be very nice as well. And, along the same lines as what was requested in #2191 being able to set alerts for these data sets would be incredibly useful as well. These are features that would take MeshCentral more down the road of a full fledge MSP RMM tool. Heck, I'd also love (at some point) for it to be able to monitor and report on things like Windows Updates (you are starting to see my wish list here). ;-)
 PathfinderNetworks
on 21 Jan 2021
PathfinderNetworks
on 21 Jan 2021
First thing that came to mind reading this... there is a RMM system using Meshcentral already.
Tactical RMM
But agreed that more system info would be very welcome
 Allowee
on 21 Jan 2021
Allowee
on 21 Jan 2021
This is a big one! #1802
 L422Y
on 27 Jan 2021
L422Y
on 27 Jan 2021
Bryan will need to research this. Not sure if there is a standard way to get temperature information, if there is, certainly something fun to add.
It's not "standard" - but the sensors are there and each platform typically already polls them, so you just need to tap in to that information:
https://github.com/Ylianst/MeshCentral/issues/1802#issuecomment-743915704
L422Y
on 27 Jan 2021
Bryan has been working on this :) What is amazing is that he got sensor readings in many different operating systems. I never pay attention to this sort of sensor, but yes, maybe I will when it's released in an upcoming MeshCentral version.
Ylianst
on 28 Jan 2021
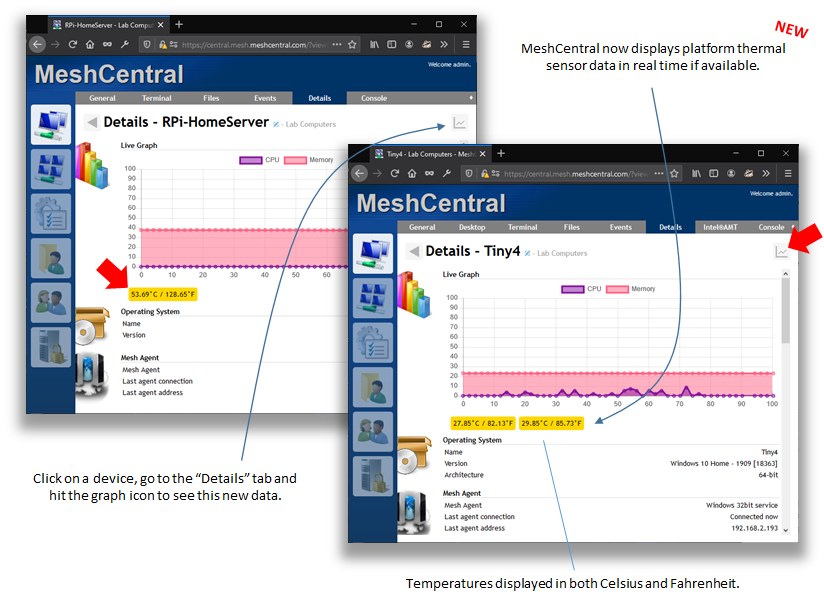
Thanks to Bryan's work on this, MeshCentral v0.7.56 displays thermal sensors for platforms that support it. Go in the details tab of a device and hit to graph icon. Let us know if that works.
Ylianst
on 28 Jan 2021
@Ylianst @krayon007 This is so cool! Thank you guys for all of the hard work. These things seem small but when you add up all the small things you guys have gotten done lately. It becomes a huge push forward in a very short period of time. Thanks for the hard work and dedication to this project guys. I wish there was a way I could donate to you guys. Do you have a place to do that?
 LPJon
on 28 Jan 2021
LPJon
on 28 Jan 2021
Thanks. No need to donate anything, we are doing great and love to have everyone in this community. These positive comments and the involvement you have around this project make it a lot of fun to work on. I did not think temperature sensors would draw such interest, but now that it's there, it is interesting to see it on screen.
Ylianst
on 29 Jan 2021
Thanks. No need to donate anything, we are doing great and love to have everyone in this community. These positive comments and the involvement you have around this project make it a lot of fun to work on. I did not think temperature sensors would draw such interest, but now that it's there, it is interesting to see it on screen.
For me, it is part of the preventative monitoring I do, if I see a machine overheating often, I can do precautionary investigations and or contact the user to see if there may be something wrong.
I'd love to be able to see historical temperatures for the last week, and GPU temps as well, as that would make the aforementioned process even easier :)
L422Y
on 29 Jan 2021
On a 2013 Mac Pro, running the latest agent, and macOS 10.15.7, I am not seeing a temperature, let me know if I can help provide any information!
L422Y
on 29 Jan 2021
Thanks for this! Now, a couple of things that would make this (and maybe some of the other detail data) even more usable would be if there were some icon that can be displayed on the Devices page next to the device when/if a certain CPU temperature were exceeded. Similar to the battery gauge icon you have now. Something that would visibly show that the device has exceeded a threshold we can configure. Or, maybe even better, would be an indicator that shows up on the device when any reading exceeds a threshold we can configure. Say if it exceeds 90% RAM usage, or 85% CPU, X temperature, etc. That way, as we are looking at the devices, we could quickly pick out and investigate devices that are having these issues.
On top of that, being able to configure an email alert system letting us know a device has exceeded some certain threshold- that would also be hugely beneficial.
Thinking deeper we'd probably only want to be alerted if the device continues to exceed that configurable threshold after a certain number of minutes or a configurable number of times in a configurable amount of time.
Hopefully you can see what I'm trying to hash out here.
PathfinderNetworks
on 29 Jan 2021
If you were able to implement an alert system like I'm describing I'm certain there would be other things we'd want to be able to be alerted on- so it is something that would need to be able to scale. Plus, some way to log and generate detailed reports about those devices and alerts would probably be a good idea.
Again, just kind of thinking of wish list items here if you are looking for things to add. :-)
PathfinderNetworks
on 29 Jan 2021
On a 2013 Mac Pro, running the latest agent, and macOS 10.15.7, I am not seeing a temperature, let me know if I can help provide any information!
So far I only tested this on big sur, but I'll go test it on all my older VMs to see
 krayon007
on 29 Jan 2021
krayon007
on 29 Jan 2021
On a 2013 Mac Pro, running the latest agent, and macOS 10.15.7, I am not seeing a temperature, let me know if I can help provide any information!
I think it's a HW issue... I use powermetrics to fetch this value... When I run in a VM, it only works on Big Sur. Older releases, powermetrics reports that it cannot read the smc sensors... When I run it natively on my 2020 macbook Pro 16", on 10.15.7, powermeterics is able to connect, and returns the temperature results...
On your macbook, from an elevated terminal, if you run powermetrics -s smc and report the results.. I'm guessing on yours it's going to say unable to connect to smc sensors.
krayon007
on 31 Jan 2021
I have other, older macbook pros I can test, but I'm out of town at the moment, so I'll check those when I return.
krayon007
on 31 Jan 2021
Going to close this one since we added it. If there are other requests, please open a new issue.
Ylianst
on 15 Feb 2021
Related issues
 penguinthingie
·
4Comments
penguinthingie
·
4Comments
 Julien-asv
·
3Comments
Julien-asv
·
3Comments
 hellofaduck
·
3Comments
hellofaduck
·
3Comments
 coolwormgit
·
3Comments
coolwormgit
·
3Comments
 darryl-h
·
3Comments
darryl-h
·
3Comments
Most helpful comment
Thanks to Bryan's work on this, MeshCentral v0.7.56 displays thermal sensors for platforms that support it. Go in the details tab of a device and hit to graph icon. Let us know if that works.