Meshcentral: Consistent pausing when in remote session
I've been having an issue lately (but not sure since which version) where my remote desktop sessions will pause for 2-3 seconds. The connection doesn't drop- it's just that the remote view doesn't update (and, I assume, my input isn't making it to the remote device- but not 100% certain about that). This is happening across all of my groups and all of my devices (all Windows devices but a mix of Windows 10 and Server 2012, 2016, and 2019).
I'm not seeing any entries in the Windows event logs that might indicate what is going on. Is there anything I can enable or monitor through MeshCentral to try and narrow down what is causing this? It's a pretty huge inconvenience.
 PathfinderNetworks
All 13 comments
One possibility (and this is just a theory) this is that the MeshCentral server is getting stuck doing something and not processing IO for a few seconds. For example, a user is loading the main web page, a database backup is occurring. One thing I can do is have NodeJS call a timer every 100ms and register at what time the timer got called compared to the last time. If the timer is more than 200ms late, it's safe to conclude NodeJS is getting stuck and I can log that. Probably the first stop to finding the problem.
 Ylianst
on 3 Jul 2020
Ylianst
on 3 Jul 2020
Adding the optional timer code now, hold on...
Ylianst
on 3 Jul 2020
Just published MeshCentral v0.5.78 with a new WatchDog feature. You can add the following line in the settings section of config.json:
"WatchDog": { "interval": 100, "timeout": 300 }
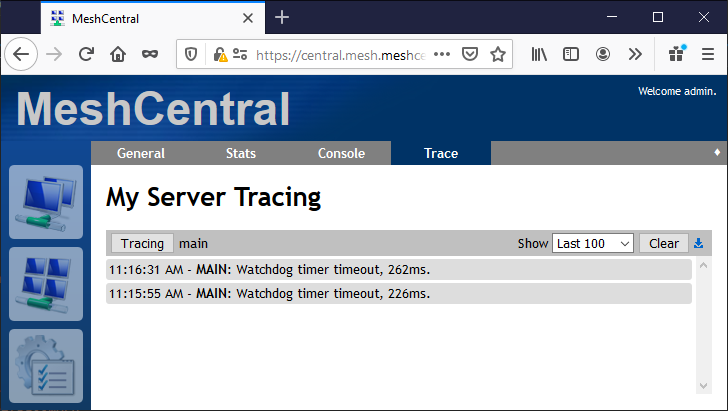
This indicates that every 100ms, there will be a timer triggered and it will check at what time it's been called. If it's more than 300ms late, it will log an entry in the "mesherrors.txt" file and alert on the "main" debug channel. So you can see the timeouts in the "My Server / Trace" screen. Check "Main Server Messages". The warnings should show like this:
You can also go in the server console and type "watchdog", this is a new command:
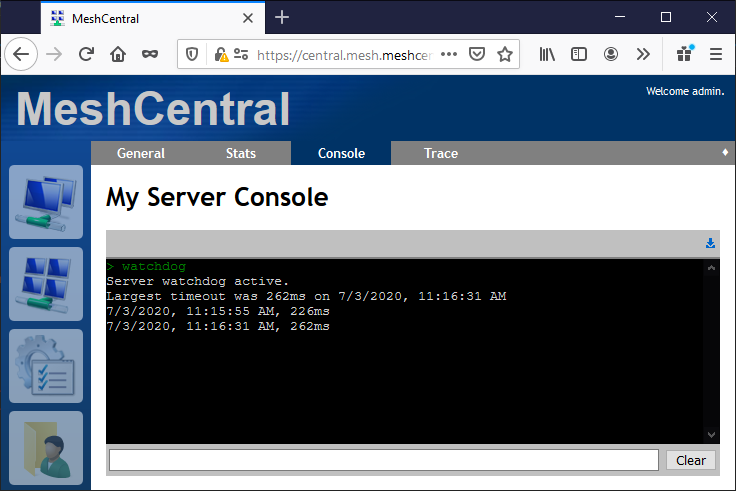
It will show the worst timeout and the last 10 timeouts that exceeded the limit. For the screens above, I set my timeout very low, they would not have shown if my timeout was set to 300ms.
Of course, this is not a solution to your original problem, just a tool to see if the server getting stuck it the problem.
Ylianst
on 3 Jul 2020
Thanks Ylian,
I've just updated to this version and have the config change made. I'll monitor this and let you know what I find.
PathfinderNetworks
on 3 Jul 2020
This does seem to be what is going on. I'm getting some pretty high timeouts every now and then. Any idea where to go next? The server is a VM of Server 2019 running under Hyper-V (the host OS is also Server 2019). It's a server built around an AMD Epic 7351P 16 core CPU with 64GB RAM (although the VM is only assigned 4GB). The drives are SSD. So the server should be plenty powerful.
watchdog
Server watchdog active.
Largest timeout was 6837ms on 7/3/2020, 3:52:57 PM
7/3/2020, 4:02:32 PM, 5541ms
7/3/2020, 4:03:08 PM, 6259ms
7/3/2020, 4:03:09 PM, 525ms
7/3/2020, 4:03:45 PM, 6620ms
7/3/2020, 4:03:45 PM, 665ms
7/3/2020, 4:04:20 PM, 5650ms
7/3/2020, 4:04:21 PM, 759ms
7/3/2020, 4:04:57 PM, 6666ms
7/3/2020, 4:04:58 PM, 603ms
7/3/2020, 4:05:32 PM, 5557ms
PathfinderNetworks
on 3 Jul 2020
WOW!!! 6 seconds of not processing IO and this is happening every minute. That is terrible!! Each time this happens, there is a second missed clock, but I imagine this is normal as NodeJS is trying to catch up on all the IO that had not be handled for a while.
What database are you using? NeDB or MongoDB? Your correct that your server should not have any issues like this. Can you check that the CPU is not at 100% every minute? Also, in the task manager, you can see CPU and Kernel time, check that everything looks ok. Let me know if you see anything go to 100% CPU and/or Kernel every minute.
Ylianst
on 3 Jul 2020
I am using the default database- so I think it must be NeDB? It's whatever is installed with the Windows installer by default. Yes, when I watch the task manager on the server it does hover at 100% pretty consistently- with Node.js: Server-Side JavaScript consuming all available CPU resources. The timing seems to coincide precisely with the watchdog logs- about every minute. Then it drops down to 0% usage for a short time. Then back up to 50% or so before it shoots up to all available resources.
I have around 320 or so devices connecting at the peak times (although the number of active devices doesn't seem to make any difference with this particular issue as, right now, there are only about 210 devices connected and the problem still exists.
PathfinderNetworks
on 5 Jul 2020
I've done some tweaks to Hyper-V and this virtual machine to try and resolve this but it's made no real difference. The Node.js: Server-Sidea JavaScript process is still shooting up to 100% CPU usage every 30-60 seconds. It only does that for 3 or 4 seconds at a time but the cycle is continuous. Would moving to MongoDB solve this? If so, is there documentation for what needs to be done to migrate from the default database over to MongoDB? Or is there some other troubleshooting I can do to try and determine what is causing the service to spike like that?
PathfinderNetworks
on 7 Jul 2020
This is not something I have ever seen before. I run servers will many times more connected devices and don't see this. 320 devices is a small number. I don't know what is causing it. Here is the first thing I would do. Go in "My Server / Trace" tab and turn on all the tracing. Select "Last 1000" on upper right.
It should look like this:

Hold for the next 100% CPU and save the log using the export button on the upper right. You can send over one or more logs, you can do it privately if you like. The goal is to see if anything happens consistently at these moments that would give a hint.
In addition to this, go in "My Server / Console" tab, run the following commands and send over the results:
info
dbstats
tasklimiter
webstats
agentstats
nodeconfig
Hopefully something will show up of interest.
Ylianst
on 8 Jul 2020
FYI. I found a server that uses NeDB that has the same problem you have. It's not as bad, but looking into it now.
Ylianst
on 8 Jul 2020
Found it! Will release a fix shortly.
Ylianst
on 8 Jul 2020
Published MeshCentral v0.5.80 with a fix for this.
Ylianst
on 8 Jul 2020
Hi Ylian- thank you for this fix! I upgraded my server to 0.5.80 and it's working MUCH better and consistently now. Massive improvement in remote responsiveness. I've been watching the task manager and Node.js barely uses 2 or 3% under load. Most of the time it sits at 0% even when I'm actively in a remote session.
I appreciate your responsiveness and for resolving this so quickly.
PathfinderNetworks
on 9 Jul 2020
Related issues
 hellofaduck
·
3Comments
hellofaduck
·
3Comments
 guerby
·
3Comments
guerby
·
3Comments
 penguinthingie
·
4Comments
penguinthingie
·
4Comments
 MailYouLater
·
4Comments
MailYouLater
·
4Comments
 M1CK431
·
3Comments
M1CK431
·
3Comments