Mattermost-server: SQL Performance Issues in Channels With Large History
Summary
SQL Performance Issues in Channels With Large History
Steps to reproduce
Use threads in channels with more than 120,000 posts in a non-clustered environment.
Expected behavior
A user viewing the channel for the first time should see the latest messages almost instantly. When trying to load historical messages, they should load page by page relatively quickly.
Observed behavior (that appears unintentional)
Channel takes 30+ seconds to load on first view, or sometimes fails to load. Looking at history/scrollback by clicking "Load more messages" often times fails on the first try. Also observe SQL processes for creating sort indexes that take a very long time to complete and can lead to the entire system becoming unresponsive if enough users are active and viewing the channel(s) in question.
Possible fixes
We believe the problem is with some inefficiencies in the getPostsAround function:
https://github.com/mattermost/mattermost-server/blob/c73bc21d1ecbc5dfe2702068e53b6dfc05f1abdd/store/sqlstore/post_store.go#L584
The query does not have any kind of limit and causes SQL to perform a sort on the entire post history of a channel. Purging all but the last couple thousand messages restores the channel to a normal state as a workaround.
 timconner
All 21 comments
More specifically, the query that starts here: https://github.com/mattermost/mattermost-server/blob/c73bc21d1ecbc5dfe2702068e53b6dfc05f1abdd/store/sqlstore/post_store.go#L620
timconner
on 8 Jun 2019
Hi @timconner, we are working on improvements related to scrolling for v5.12 and for future releases. The Jira Epic is here: https://mattermost.atlassian.net/browse/MM-11209. Does this sound like it's related to the issue you're seeing?
 amyblais
on 10 Jun 2019
amyblais
on 10 Jun 2019
Hey @amyblais, I'm not seeing anything in the current 5.12 code base or the Jira Epic that addresses this concern in particular. This issue also affects initial channel load as well as scrolling.
In the Jira Epic there is a Google Doc which titled Investigation and Plan. Action items 2.a.i and 2.a.ii would refer to the code i believe to be the issue, but they were marked as "already exists" which makes it seem to me that there was no intention to review this code as part of this overhaul.
timconner
on 10 Jun 2019
It looks like you guys may have already spotted this: https://mattermost.atlassian.net/browse/MM-12072
Is that referring to the same query?
timconner
on 14 Jun 2019
I can confirm we are also seeing this issue in a channel w/ over 500k total posts. Initial load is slow and loading additional backlog via infinite scroll also has a long load time. I'll try to get a slow query log enabled to see if I can be of some assistance.
Mattermost 5.12
Percona MySQL 5.7.25
 shermdog
on 19 Jun 2019
shermdog
on 19 Jun 2019
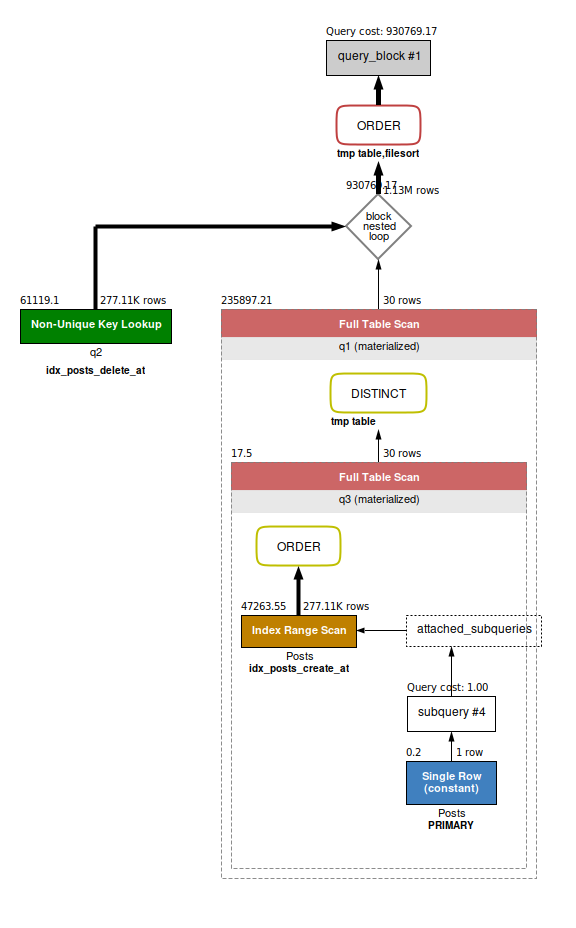
@amyblais I can confirm from my slow query log that @timconner has identified the slow query
More specifically, the query that starts here:
/usr/sbin/mysqld, Version: 5.7.25-28-log (Percona Server (GPL), Release 28, Revision c335905). started with:
Tcp port: 0  Unix socket: /var/lib/mysql/mysql.sock
Time                 Id Command    Argument
# Time: 2019-06-19T22:42:00.276686Z
# User@Host: redacted[redacted] @ localhost [::1]  Id:     4
# Schema: redacted  Last_errno: 0  Killed: 0
# Query_time: 18.619909  Lock_time: 0.000133  Rows_sent: 0  Rows_examined: 537857  Rows_affected: 0
# Bytes_sent: 1059
use redacted;
SET timestamp=1560984120;
SELECT
                            q2.*
                        FROM
                                Posts q2
                                        INNER JOIN
                            (SELECT DISTINCT
                                q3.Id, q3.RootId
                            FROM
                                        (SELECT
                                                Id, RootId
                                        FROM
                                                Posts
                                        WHERE
                                                CreateAt < (SELECT CreateAt FROM Posts WHERE Id = 'redacted')
                                                AND ChannelId = 'redacted'
                                                AND DeleteAt = 0
                                        ORDER BY CreateAt DESC
                                        LIMIT 30 OFFSET 0) q3 -- q3 contains the Id and RootId of every post in posts
                                ) q1 -- q1 is q3 with the duplicates removed
                                ON q1.RootId = q2.Id -- This is the root post of a thread that appears in posts
                                        OR q1.Id = q2.RootId -- This is a comment on a post in posts
                                        OR (q2.RootId != '' AND q1.RootId = q2.RootId) -- This is a comment on a thread that appears in posts
                        WHERE
                                ChannelId = 'redacted'
                                AND DeleteAt = 0
                        ORDER BY CreateAt DESC;
shermdog
on 20 Jun 2019
The git blame shows this issue was introduced in MM-15542 #10859
shermdog
on 21 Jun 2019
@shermdog, for reference, are you able to post the query planner output on your dataset prior to those changes?
 lieut-data
on 24 Jun 2019
lieut-data
on 24 Jun 2019
@timconner What version of Mattermost were you on when you first noticed these problems?
The changes linked by @shermdog shouldn't have caused any new problems. That query is a modified version of the one in getParentPosts which was used as part of GetPosts to do the paging before 5.12.
 hmhealey
on 24 Jun 2019
hmhealey
on 24 Jun 2019
Probably first noticed it in 5.0.8. I posted this issue prior to 5.12 being released. I think this query has been slow for quite some time.
timconner
on 24 Jun 2019
I don't have empirical evidence from previous versions. The query was slow before, but does seem to have gotten worse w/ the latest version.
If needed I can probably stand up a test server w/ an older version of the software and our data to compare.
shermdog
on 24 Jun 2019
This is fine. I just wanted to confirm that there isn't a new issue and that those changes didn't introduce the problem.
hmhealey
on 25 Jun 2019
Thanks for confirming, @shermdog -- this is indeed a known slow area of the product. The medium-term plan is to load the RHS posts on demand instead of with centre channel posts, which should dramatically speed up this entire experience.
lieut-data
on 25 Jun 2019
FWIW, on 5.10 my users never reported issues loading old messages in a channel, and since I updated to 5.12 I had already two users with the problem.
 ThiefMaster
on 4 Jul 2019
ThiefMaster
on 4 Jul 2019
Have same issue on 5.12.2 as @ThiefMaster and I think that #11603 is related to this.
Sometimes users won't get "fresh" messages or, when added to channel, need to reload page to view old messages.
Also, we have issues with timing out API requests that use this query.
{
    'id': 'store.sql_post.get_posts_around.get_parent.app_error',
    'message': 'Unable to get the parent posts for the channel',
    'detailed_error': '',
    'request_id': '566ptsdbdpgn3mkqk6m817h5bo',
    'status_code': 500
}
 tarabanton
on 10 Jul 2019
tarabanton
on 10 Jul 2019
Thanks for the heads up, @tarabanton! We have some folks investigating how to proceed -- cc @grundleborg.
lieut-data
on 10 Jul 2019
Ticket was created here: https://mattermost.atlassian.net/browse/MM-16936
amyblais
on 11 Jul 2019
A fix for this is available in v5.13.2 dot release. I'll close this issue for now, but please re-open this issue if upgrading doesn't help.
amyblais
on 25 Jul 2019
I deployed it on my instance earlier today and the performance issues are gone as far as I could tell :)
ThiefMaster
on 25 Jul 2019
Yesterday I updated to 5.13.2 and some channels with big history loading really long - or don't loading due timeout (>30s)
 Dropsik
on 9 Aug 2019
Dropsik
on 9 Aug 2019
Hi @Dropsik, does your issue seem related to this one https://github.com/mattermost/mattermost-server/issues/11734?
amyblais
on 9 Aug 2019
Related issues
 esethna
·
3Comments
esethna
·
3Comments
esethna
·
3Comments
esethna
·
3Comments
 clarfonthey
·
3Comments
esethna
·
3Comments
clarfonthey
·
3Comments
esethna
·
3Comments
 harshilsharma2
·
3Comments
harshilsharma2
·
3Comments
Most helpful comment
I deployed it on my instance earlier today and the performance issues are gone as far as I could tell :)