Material-table: Performance blocker after a version 1.62.0 of material-table
Hi,
This is not an easy issue.
I am using material-table extensively on my application.
I was having serious performance issues, to the extend of having 3 tables loaded on the view and the performance after a few clicks just killed the browser.
Started trying to understand the issue.
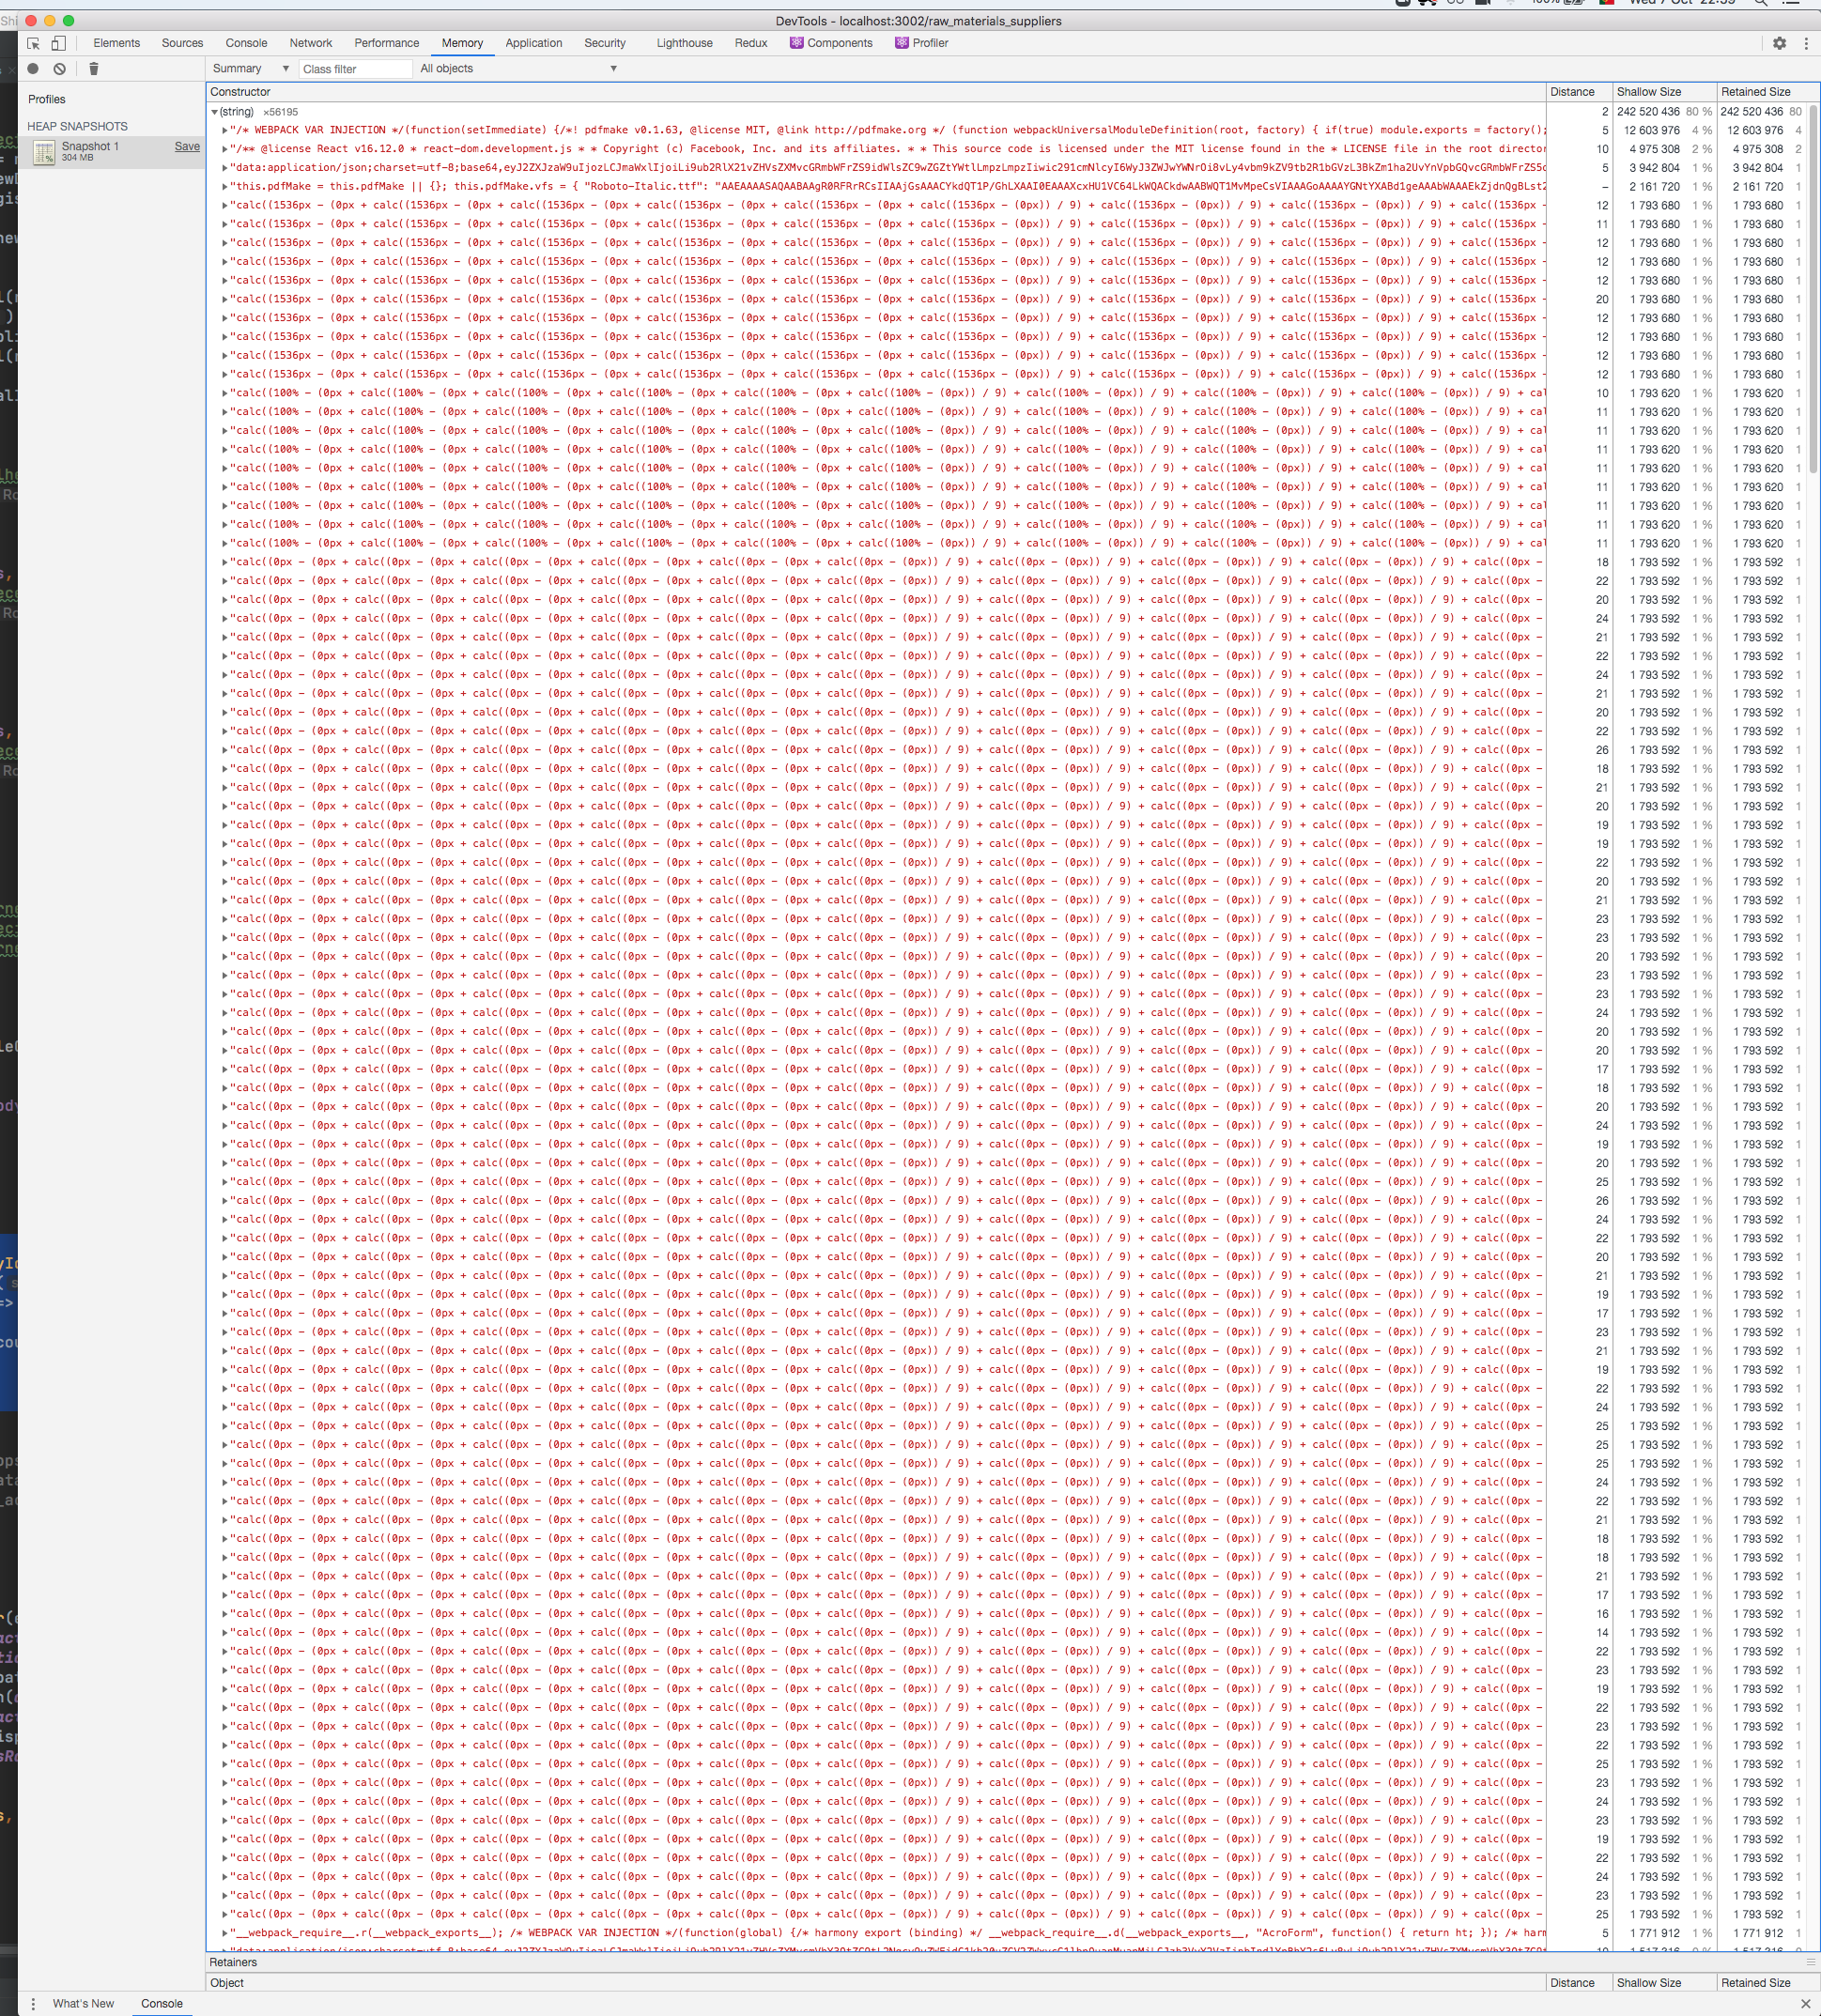
Still haven't fully isolated it but from what i have tested everything works well if i am using version 1.62.0 if i update to the latest version i have a serious memory leak on material-table appearing, from what i saw it as something to do with CSS calculation or something.
I haven't yet looked for the version where this behaviour starts happening nonetheless i can give you a glimpse of what appears in memory when it goes south, take a look at memory snapshot bellow, memory gets flooded with some CSS computation.
@mbrn if you think it is of any value i can try and see in which version it started happening. I can replicate the issue easily on my application, not sure if it is that easy in a simple code sandbox.
Could be my error but i think not, i have been chasing this for a few days.

 LuisPinaSoares
All 9 comments
Might be similar to #2514 but this is a temporary workaround until @mbrn or someone more familiar with the codebase is able to isolate the issue.
 SamerAlsayegh
on 8 Oct 2020
SamerAlsayegh
on 8 Oct 2020
Do you have any idea at which version started happening this issue, probably this would help to further isolate it.
Thanks for the tip!
LuisPinaSoares
on 8 Oct 2020
Might be solved in https://github.com/mbrn/material-table/pull/2510 and seems to be not be an issue 1.68.1, but also there were other issues mentioned with bulk editing at those versions, so may not solve your issue completely.
SamerAlsayegh
on 8 Oct 2020
Not sure if it solved... because i confirmed this behaviour in the latest which was 1.69.1
LuisPinaSoares
on 8 Oct 2020
I too have been trying to chase down this behavior the past few days, can confirm that I arrived at exactly the same conclusion of some CSS calculation hanging. In my application the string calc to be evaluated was ~26MB
I am able to reliable reproduce the issue within my app, and I'll start on a sandbox which will hopefully demonstrate the behavior clearly.
(Same version, 1.69.1)
EDIT: Here is a sandbox which demonstrates the issue:
https://codesandbox.io/s/intelligent-almeida-k05e0?file=/src/App.js
 minelminel
on 14 Oct 2020
minelminel
on 14 Oct 2020
Confirmed that the issue does not exist on 1.61.0
 manubamba
on 18 Oct 2020
manubamba
on 18 Oct 2020
I have a similar issue with 1.69.1 that is not present 1.62.0: When clicking on an action there's a huge spike on CPU load and my app freezes.
 thisismydesign
on 20 Oct 2020
thisismydesign
on 20 Oct 2020
From my brute force tests it seems that the bug was added on 1.69.0.
LuisPinaSoares
on 20 Oct 2020
Same issue, currently (1.69.1) only on a table I have external custom filters. Huge spike after switching quickly between filters. @SamerAlsayegh 's workaround helped for now. Any updates?
 TimBenn
on 12 Nov 2020
TimBenn
on 12 Nov 2020
Related issues
 behrouz-s
·
3Comments
behrouz-s
·
3Comments
 KKrisu
·
3Comments
KKrisu
·
3Comments
 balibou
·
3Comments
balibou
·
3Comments
 bohrsty
·
3Comments
bohrsty
·
3Comments
 timrchavez
·
3Comments
timrchavez
·
3Comments
Most helpful comment
Confirmed that the issue does not exist on 1.61.0