Hi,
since I have a mastodon tab constantly opened in my browser (firefox), my computer (4 CPU) is regularly abnormally loaded (process "web content" 100-150% and load avg 2-3).
It seems that hiding the local timeline or the federated timeline decrease CPU usage.
Regards,
Faust
 fauust
All 15 comments
Same problem here.
Memory Tab Usage shows more than 150 MB usage before Firefox slows down, and I need to restart it.
 nd-
on 19 Apr 2017
nd-
on 19 Apr 2017
FWIW, if I repeatedly click Federated Timeline then Back in Vivaldi, my memory usage according to it's task manager goes up about 8MB each time. When I stop and wait a bit, the last 8MB seems to get flushed after a few seconds .. and then after a few minutes, most of the rest gets flushed (i was at 188MB now i'm back down to 159MB, and when I started I was at 150MB). Most load I see is 4% when it's loading a tab. As an aside, I have Gmail taking up nearly 1GB, TweetDeck running at 500MB, and a whole host of other tabs taking up a whole lot more than the 150MB that Mastodon is running at.
 ericblade
on 19 Apr 2017
ericblade
on 19 Apr 2017
160M here, when compared to others (slack, soundcloud, etc) is not that much really but yeah is the most CPU intensive tab by a lot !

 maop
on 19 Apr 2017
maop
on 19 Apr 2017
after about 4 days, Tweetdeck is at 230M and Mastodon is at 160M. I think that's pretty reasonable for such an interface. The CPU problems, tho, are pretty worrying.

 wxcafe
on 20 Apr 2017
wxcafe
on 20 Apr 2017
I think it's linked to https://github.com/tootsuite/mastodon/issues/787
 Geobert
on 21 Apr 2017
Geobert
on 21 Apr 2017
I don't understand why you closed this issue. I don't see it as a duplicate since we're talking about a CPU consumption here.
CPU is high partly because mastodon renders too much, too often. I spent a couple of hours trying to figure out where this comes from, but without any good results.
One sure thing is that the timeline update action should probably not be dispatched on every status received by the streaming API, but should be buffered and debounced.
I also discovered that the reselect-based mnemoized status selector is recomputed too often, triggering a full render.
Unfortunately I do not have any improvement yet...
 mattjmattj
on 22 Apr 2017
mattjmattj
on 22 Apr 2017
Alright, I thought the two issues must be linked but if they're not both issues can definitely live their own lives.
wxcafe
on 22 Apr 2017
agree, I said they are linked, not duplicate :) To precise my thought, I think this issue make the other one worse: too much rendering = more allocated memory, and as this mem is leaking, the leak is even worse
Geobert
on 22 Apr 2017
It should fetch the feed less often when not in focus. That would at least solve some of the issue.
 ticki
on 16 Jun 2017
ticki
on 16 Jun 2017
@ticki Feeds are not fetched, it's websockets.
 Gargron
on 18 Jun 2017
Gargron
on 18 Jun 2017
@Gargron I see. The solution I suppose would then be to temporarily stop the socket by sending some message to the server.
ticki
on 18 Jun 2017
@ticki An open websocket takes up no memory nor CPU. Closing it and reopening it regularly would cost more I believe (no tests done, I might be wrong). Pings/pongs are just a matter of sending a few bytes through a socket.
 tleb
on 19 Jun 2017
tleb
on 19 Jun 2017
Many optimizations have been done since this issue was opened, so I am going to consider it resolved and close.
Gargron
on 30 Jun 2017
Hello,
Yeah it's much better now!
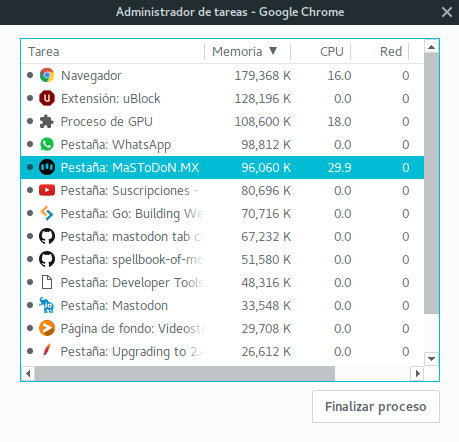
and just to keep the record, with 1.4.6 it reduced both CPU and Memory usage, this shot is after aprox 2hrs of usage, it started at 70M then ~130M, and when i went to preferences and back to the timelines, it dropped to 96M. CPU usage is at 0 most time :) (with some intervals at 10-15 for ~10s seconds)
Good work @Gargron :+1:
maop
on 30 Jun 2017
You should be thanking @nolanlawson and @sorin-davidoi 🤗
Gargron
on 30 Jun 2017
Related issues
 psychicteeth
·
3Comments
psychicteeth
·
3Comments
 marrus-sh
·
3Comments
marrus-sh
·
3Comments
 almafeta
·
3Comments
almafeta
·
3Comments
 KellerFuchs
·
3Comments
KellerFuchs
·
3Comments
 renatolond
·
3Comments
renatolond
·
3Comments
Most helpful comment
You should be thanking @nolanlawson and @sorin-davidoi 🤗