Masstransit: Bucket<CachedSendEndpoint<Type>> appears to be causing a memory leak
Is this a bug report?
Yes this is a bug report.
Can you also reproduce the problem with the latest version?
I have not attempted to do this yet.
Environment
- Operating system: microsoft/dotnet:2.1-aspnetcore-runtime on Kubernetes
- Visual Studio version: Proffessional 2019
- Dotnet version: .net core 2.2
Steps to Reproduce
I have a long running .net core console app which uses mass transit to consume from a queue. I've noticed that the Bucket
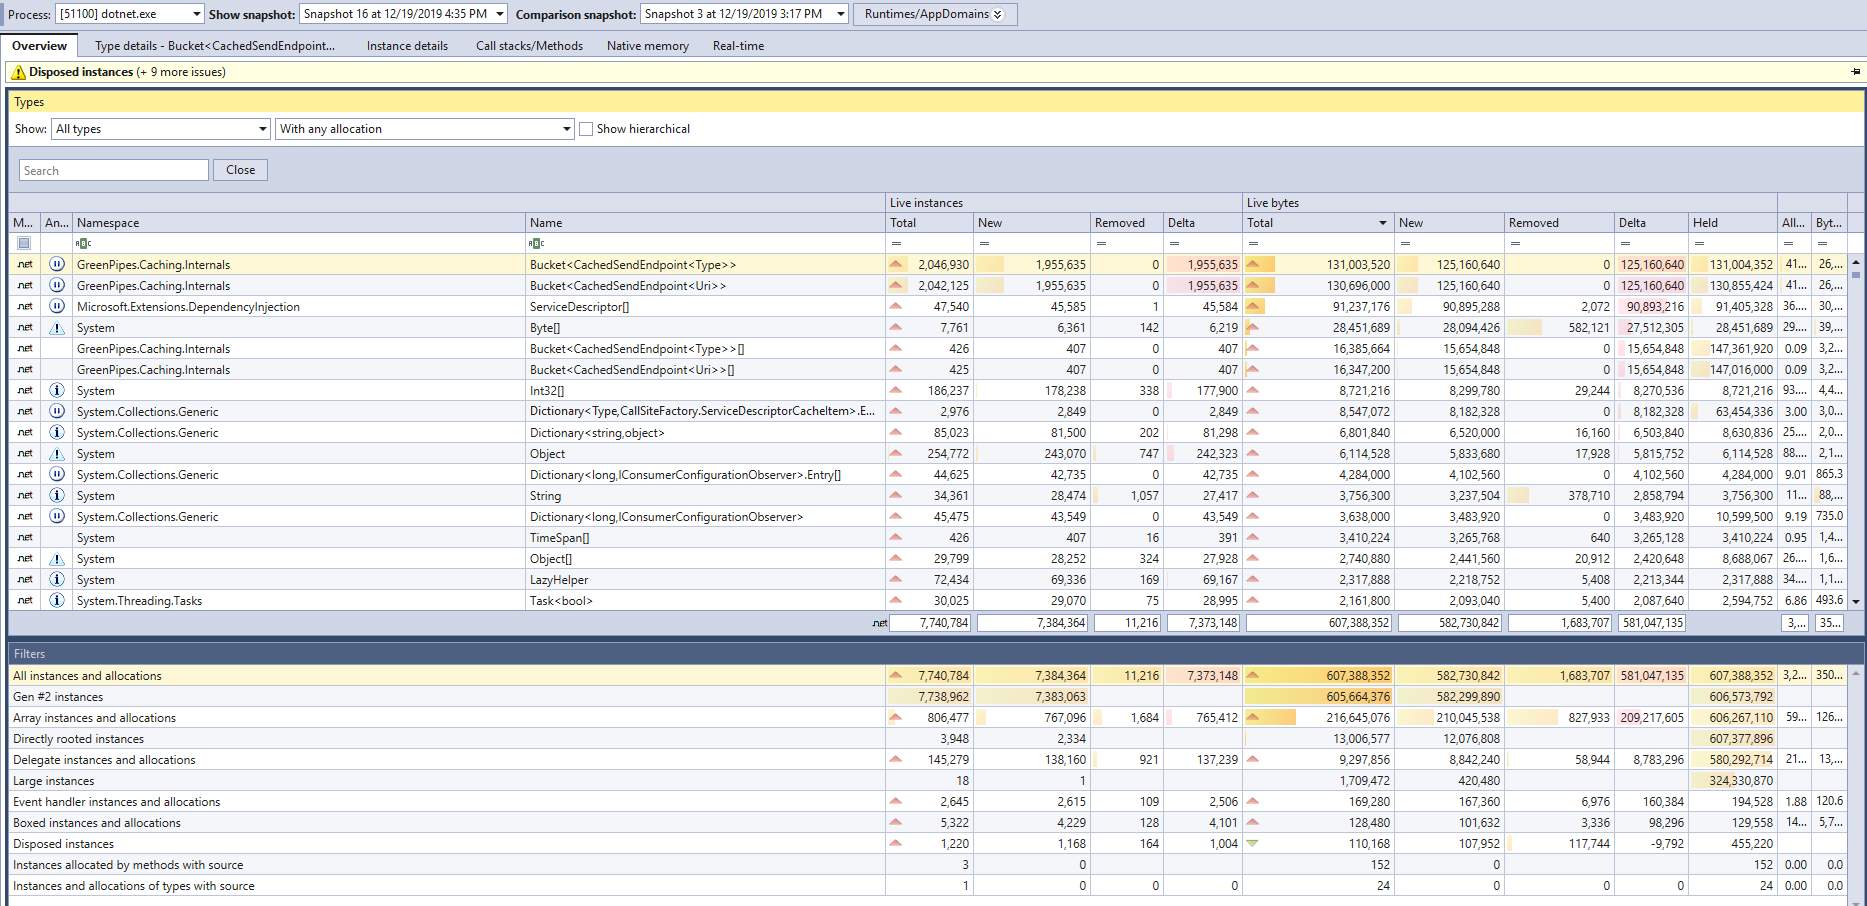
Also the instances graph

As you can see those two instances make roughly half the Gen 2 Heap. Also the two snapshots are roughly an hour apart and yet if you look at the live bytes and live instances it seems that the removed column shows 0 for both.
The code is proprietary and I'm not sure which parts of the code to show you could you let me know what might areas might help you diagnose?
Expected Behavior
Based on the documentation shown here: https://masstransit-project.com/MassTransit/architecture/green-cache.html#asynchronous-for-the-await-for-it-win
I thought that the cache had a capacity and age limit and these objects would get cleaned up. What is this and can it be configured? I'm not an expert on this issue :)
 mia01
mia01
All 6 comments
It should be limited to 1000, but if you're creating thousands a minute that can cause it to retain more instances until the buckets are cleared. These are the default:
The minimum age is now 10 seconds, and in the past I've _never_ been able to reproduce this once it was fixed. I can look at it again though, it's possible that something is keeping a reference to the cached endpoint.
In the call graph you have linked, that's a publish endpoint - which honestly there shouldn't be more than a few of - one for each message type in your system that is published. If you're seeing significantly more, look for instances that were owned by the SendEndpointProvider, not the publish endpoint provider.
And if you're using a request client, and creating a new bus instance for each request, _STOP_ doing that and use the same bus instance for each request. It will be faster, and will reuse the same response bus endpoint which will prevent the creation of a bunch of send endpoints for the temporary endpoint addresses that disappear.
 phatboyg
on 20 Dec 2019
phatboyg
on 20 Dec 2019
You've clearly got something holding on to references of something larger. The fact there are 47,000 dictionaries keeping track of configuration observers is crazy. There is clearly something not being disposed.
phatboyg
on 20 Dec 2019
Did you figure this out? Can this issue be closed?
phatboyg
on 23 Dec 2019
Hello
Thanks very much for your help. I believe we did find the issue we were not disposing an object. I will put more detail shortly.
mia01
on 23 Dec 2019
Great. I'll close the issue in the meantime to get it off the open list.
phatboyg
on 26 Dec 2019
The issue which was causing this was that we were using ConnectSendObserver but we weren't disposing of it correctly. The solution was to simply wrap it in a using.
mia01
on 22 Jan 2020
Related issues
 slaneyrw
·
6Comments
slaneyrw
·
6Comments
 danielman111
·
4Comments
phatboyg
·
6Comments
danielman111
·
4Comments
phatboyg
·
6Comments
 akaFalsh
·
3Comments
akaFalsh
·
3Comments
 gschuager
·
7Comments
gschuager
·
7Comments