Maskrcnn-benchmark: Batched Inference using tools/test_net.py - how to display predictions
❓ Questions and Help
I am performing batch inference on multi-gpu by using the script tools/test_net.py.
The outputs after successfully running inference through such file are: bbox.json, coco_results.pth, predictions.pth
My question is:
How can I use the predictions.pth (or bbox.json) file to load my predictions and display my predictions for a given image. I would like to create a notebook like demo/Mask_R-CNN_demo.ipynb but not calculate the predictions just load them and use the display (e.g. overlay_boxes) functions on the predictor file.
Thank you for your help!
 adrifloresm
All 17 comments
Hi,
You'll need to write a tiny bit of code for that.
Here are the steps:
- load the
predictions.pthfile intoall_predictions = torch.load(...) - load the dataset that you used to test on it
- the index in the dict correspond to the image id from the dataset, so you can load a particular image via
image, target, idx = dataset[idx] - get the predictions for the idx:
predictions = all_predictions[idx] - overlay the predictions on top of the image, by leveraging the
COCODemofor example https://github.com/facebookresearch/maskrcnn-benchmark/blob/f25c6cff92d32d92abe8965d68401004e90c8bee/demo/predictor.py#L172-L180
Let me know if you have further questions!
 fmassa
on 9 Jan 2019
fmassa
on 9 Jan 2019
@fmassa Thank you so much for the step by step explanation it is super helpful and straightforward. I will try it out and post if I have any issues. Thanks again!
adrifloresm
on 9 Jan 2019
Also let me know when you manage to do it. It would make a good contribution for a pull request :-)
fmassa
on 10 Jan 2019
Yes, I will be happy to share the code. I will get to it next week, I am finishing a deadline this week.
adrifloresm
on 10 Jan 2019
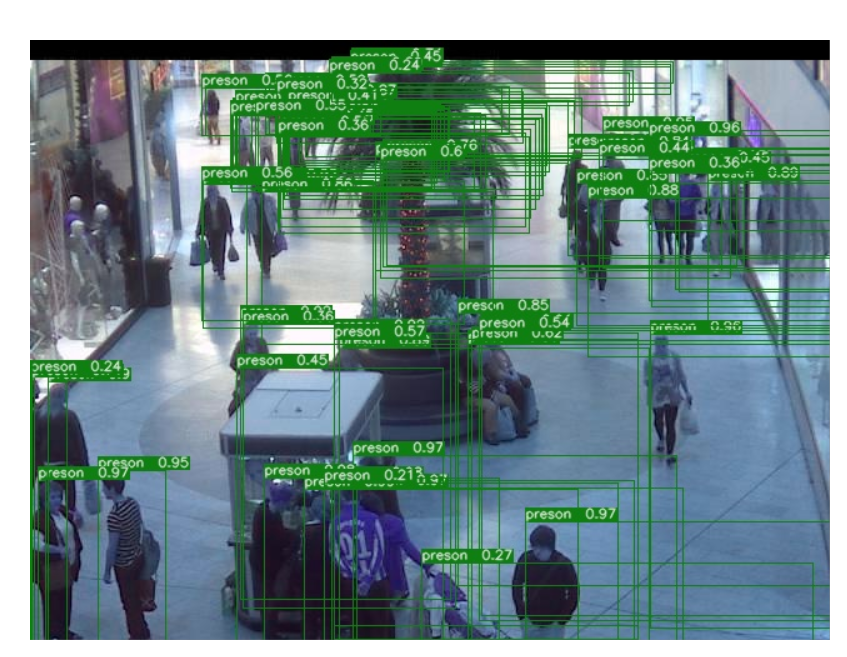
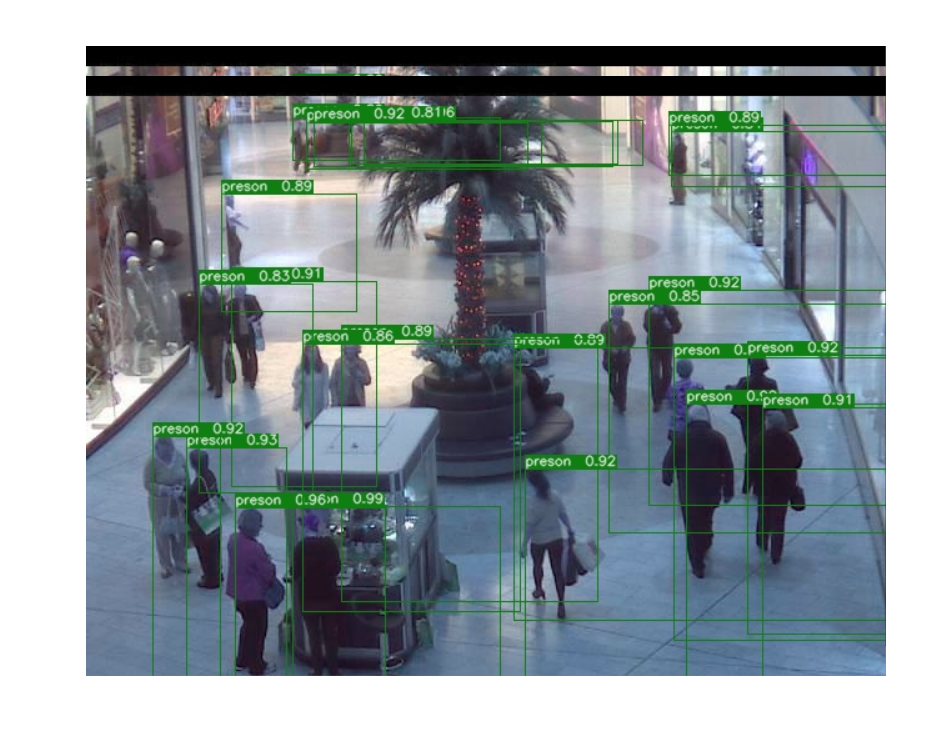
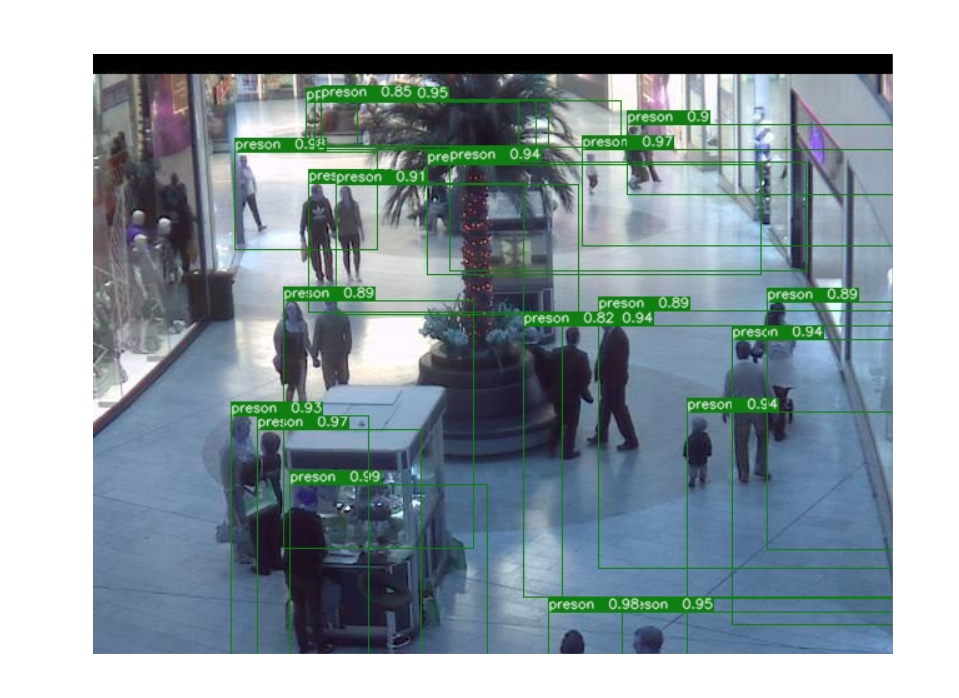
HI @fmassa can you explain in detail the differences between bbox.json, coco_results.pth, and predictions.pth? I used the bbox.json file and extractd bboxes, then I draw these boxes in my evaluate iamges,but the result is very poor. I don't know what happend.
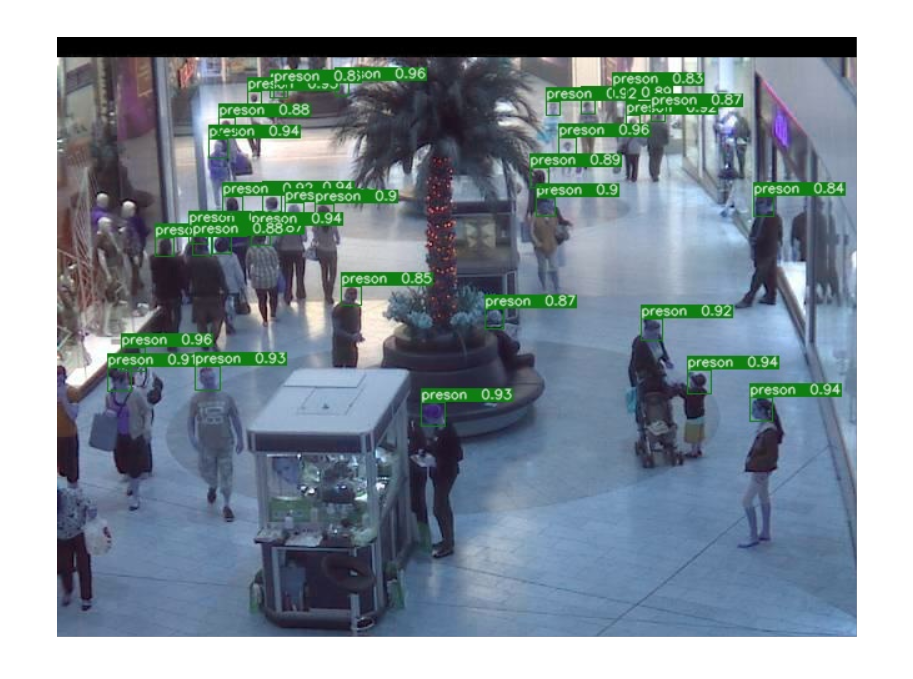
this is the eval result
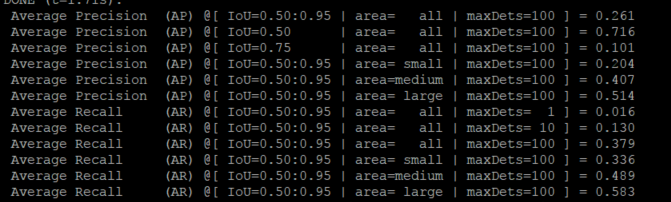
and the validate image
 chenxu93
on 15 Jan 2019
chenxu93
on 15 Jan 2019
my train info log as bellows:
speciall, the pre-trained model I used are download form Detectron
`, is any problem?
MODEL:
META_ARCHITECTURE: "GeneralizedRCNN"
WEIGHT: '/home/maskrcnn-benchmark/pretrained/e2e_faster_rcnn_X-101-32x8d-FPN/X-101-32x8d.pkl'
#WEIGHT: "catalog://ImageNetPretrained/FAIR/20171220/X-101-32x8d"
BACKBONE:
CONV_BODY: "R-101-FPN"
OUT_CHANNELS: 256
RPN:
USE_FPN: True
NMS_THRESH: 0.7
ANCHOR_STRIDE: (4, 8, 16, 32, 64)
PRE_NMS_TOP_N_TRAIN: 2000
PRE_NMS_TOP_N_TEST: 1000
POST_NMS_TOP_N_TEST: 1000
FPN_POST_NMS_TOP_N_TEST: 1000
ROI_HEADS:
DETECTIONS_PER_IMG: 500
USE_FPN: True
NMS: 0.6
ROI_BOX_HEAD:
NUM_CLASSES: 2
POOLER_RESOLUTION: 7
POOLER_SCALES: (0.25, 0.125, 0.0625, 0.03125)
POOLER_SAMPLING_RATIO: 2
FEATURE_EXTRACTOR: "FPN2MLPFeatureExtractor"
PREDICTOR: "FPNPredictor"
RESNETS:
STRIDE_IN_1X1: False
NUM_GROUPS: 32
WIDTH_PER_GROUP: 8
DATASETS:
TRAIN: ("coco_2014_train",)
TEST: ("coco_2014_val",)
DATALOADER:
SIZE_DIVISIBILITY: 32
SOLVER:
BASE_LR: 0.002
WEIGHT_DECAY: 0.0001
STEPS: (40000, 50000, 60000)
MAX_ITER: 70000
IMS_PER_BATCH: 2
GAMMA: 0.1
WARMUP_ITERS: 300
WARMUP_METHOD: "linear"
CHECKPOINT_PERIOD: 2500
TEST:
IMS_PER_BATCH: 2
INPUT:
MIN_SIZE_TRAIN: 800
MAX_SIZE_TRAIN: 1000
MIN_SIZE_TEST: 800
MAX_SIZE_TEST: 1333
OUTPUT_DIR: "./work_dir/0114/"
2019-01-14 14:12:55,182 maskrcnn_benchmark INFO: Running with config:
DATALOADER:
ASPECT_RATIO_GROUPING: True
NUM_WORKERS: 0
SIZE_DIVISIBILITY: 32
DATASETS:
TEST: ('coco_2014_val',)
TRAIN: ('coco_2014_train',)
INPUT:
MAX_SIZE_TEST: 1333
MAX_SIZE_TRAIN: 1000
MIN_SIZE_TEST: 800
MIN_SIZE_TRAIN: 800
PIXEL_MEAN: [102.9801, 115.9465, 122.7717]
PIXEL_STD: [1.0, 1.0, 1.0]
TO_BGR255: True
MODEL:
BACKBONE:
CONV_BODY: R-101-FPN
FREEZE_CONV_BODY_AT: 2
OUT_CHANNELS: 256
DEVICE: cuda
MASK_ON: False
META_ARCHITECTURE: GeneralizedRCNN
RESNETS:
NUM_GROUPS: 32
RES2_OUT_CHANNELS: 256
RES5_DILATION: 1
STEM_FUNC: StemWithFixedBatchNorm
STEM_OUT_CHANNELS: 64
STRIDE_IN_1X1: False
TRANS_FUNC: BottleneckWithFixedBatchNorm
WIDTH_PER_GROUP: 8
ROI_BOX_HEAD:
FEATURE_EXTRACTOR: FPN2MLPFeatureExtractor
MLP_HEAD_DIM: 1024
NUM_CLASSES: 2
POOLER_RESOLUTION: 7
POOLER_SAMPLING_RATIO: 2
POOLER_SCALES: (0.25, 0.125, 0.0625, 0.03125)
PREDICTOR: FPNPredictor
ROI_HEADS:
BATCH_SIZE_PER_IMAGE: 512
BBOX_REG_WEIGHTS: (10.0, 10.0, 5.0, 5.0)
BG_IOU_THRESHOLD: 0.5
DETECTIONS_PER_IMG: 500
FG_IOU_THRESHOLD: 0.5
NMS: 0.6
POSITIVE_FRACTION: 0.25
SCORE_THRESH: 0.05
USE_FPN: True
ROI_MASK_HEAD:
CONV_LAYERS: (256, 256, 256, 256)
FEATURE_EXTRACTOR: ResNet50Conv5ROIFeatureExtractor
MLP_HEAD_DIM: 1024
POOLER_RESOLUTION: 14
POOLER_SAMPLING_RATIO: 0
POOLER_SCALES: (0.0625,)
POSTPROCESS_MASKS: False
POSTPROCESS_MASKS_THRESHOLD: 0.5
PREDICTOR: MaskRCNNC4Predictor
RESOLUTION: 14
SHARE_BOX_FEATURE_EXTRACTOR: True
RPN:
ANCHOR_SIZES: (32, 64, 128, 256, 512)
ANCHOR_STRIDE: (4, 8, 16, 32, 64)
ASPECT_RATIOS: (0.5, 1.0, 2.0)
BATCH_SIZE_PER_IMAGE: 256
BG_IOU_THRESHOLD: 0.3
FG_IOU_THRESHOLD: 0.7
FPN_POST_NMS_TOP_N_TEST: 1000
FPN_POST_NMS_TOP_N_TRAIN: 2000
MIN_SIZE: 0
NMS_THRESH: 0.7
POSITIVE_FRACTION: 0.5
POST_NMS_TOP_N_TEST: 1000
POST_NMS_TOP_N_TRAIN: 2000
PRE_NMS_TOP_N_TEST: 1000
PRE_NMS_TOP_N_TRAIN: 2000
RPN_HEAD: SingleConvRPNHead
STRADDLE_THRESH: 0
USE_FPN: True
RPN_ONLY: False
WEIGHT: /home/maskrcnn-benchmark/pretrained/e2e_faster_rcnn_X-101-32x8d-FPN/X-101-32x8d.pkl
OUTPUT_DIR: ./work_dir/0114/
PATHS_CATALOG: /home/maskrcnn-benchmark/maskrcnn_benchmark/config/paths_catalog.py
SOLVER:
BASE_LR: 0.002
BIAS_LR_FACTOR: 2
CHECKPOINT_PERIOD: 2500
GAMMA: 0.1
IMS_PER_BATCH: 2
MAX_ITER: 70000
MOMENTUM: 0.9
STEPS: (40000, 50000, 60000)
WARMUP_FACTOR: 0.333333333333
WARMUP_ITERS: 300
WARMUP_METHOD: linear
WEIGHT_DECAY: 0.0001
WEIGHT_DECAY_BIAS: 0
TEST:
EXPECTED_RESULTS: []
EXPECTED_RESULTS_SIGMA_TOL: 4
IMS_PER_BATCH: 2
chenxu93
on 15 Jan 2019
Hi,
bbox.json contain all the predictions. If you want to display them, you might want to apply some threshold to remove low-scoring boxes. See how we do it in here https://github.com/facebookresearch/maskrcnn-benchmark/blob/f25c6cff92d32d92abe8965d68401004e90c8bee/demo/predictor.py#L221-L240
fmassa
on 15 Jan 2019
Thanks for your early reply, actually I set the score thresh=0.8 to filter out some boxes, but it seems that the model is very poor. I don't know is any problem with my trained model.
chenxu93
on 15 Jan 2019
Note that the format in box.json is [x, y, w, h], so make sure that you are using the right conventions while displaying it.
Also make sure that your image is not rescaled, and is in the original size (the boxes are of the original size).
fmassa
on 15 Jan 2019
HI @fmassa thank you very much, as you explation I use [x,y,w,h] format the result is good.
chenxu93
on 15 Jan 2019
Hi, I found it works just by editing on demo/Mask_R-CNN_demo.ipynb to visualize predictions.
change 1:
config_file = "../configs/e2e_mask_rcnn_R_50_FPN_1x.yaml"  #this is replaced by my yaml file
cfg.merge_from_file(config_file)                            # update the config options with the config file
cfg.MODEL.WEIGHT = '../output/model_final.pth'  #this is the output .pth file
cfg.merge_from_list(["MODEL.DEVICE", "cpu"]) # manual override some options
change 2:
 val_path='../datasets/coco/valminus/' #this is the validation image data
 imglistval = listdir(val_path)
 for name in imglistval:
    imgfile = val_path + name
    pil_image = Image.open(imgfile).convert("RGB")
    image = np.array(pil_image)[:, :, [2, 1, 0]]

    predictions = coco_demo.run_on_opencv_image(image) # forward predict
    plt.subplot(1, 2, 1)
    plt.imshow(image[:,:,::-1])
    plt.axis('off')

    plt.subplot(1, 2, 2)
    plt.imshow(predictions[:,:,::-1])
    plt.axis('off')
    plt.show()
 alexstar55
on 1 Feb 2019
alexstar55
on 1 Feb 2019
@fmassa hey just one question referring to:
bbox.jsoncontain all the predictions. If you want to display them, you might want to apply some threshold to remove low-scoring boxes. See how we do it in here
Since the mAP also includes False Positives, one could obtain higher performance results by changing the threshold to remove low-scoring boxes right. What threshold is used for the coco evaluation in the test_net.py? And where can the threshold be changed?
 madurner
on 14 Mar 2019
madurner
on 14 Mar 2019
@maedmaex you can see more detail in defaults.py, which locates in maskrcnn_benchmark/config.
And you can change the value of _C.MODEL.ROI_HEADS.SCORE_THRESH = 0.05 to remove some low score objects.
chenxu93
on 14 Mar 2019
@chenxu93 thx. But is this _C.MODEL.ROI_HEADS.SCORE_THRESH with such a low value (0.05) also used for the coco evaluation? With this value I assume to obtain a lot of False Positives... so the mAP = \frac{1}{\abs{classes}} \sum_{c \in classes}{\frac{TP(c)}{TP(c) + FP(c)}} drops since the FP is in the nominator
madurner
on 14 Mar 2019
I use the method from @alexstar55. It works well.
But I also want to draw ground truth mask to compare with my results.
How do I do that?
 andyhahaha
on 21 May 2019
andyhahaha
on 21 May 2019
HI @fmassa thank you very much, as you explation I use [x,y,w,h] format the result is good.
偶遇陈旭大佬,当时云从人头计数就是用的 e2e_faster_rcnn_X-101-32x8d-FPN 这个配置么 @chenxu93
 clw5180
on 5 Aug 2019
clw5180
on 5 Aug 2019
@adrifloresm
Would you like to share the display code here? I'm currently encounting the same problem.
Thank you for your help.
 ChongjianGE
on 13 Nov 2019
ChongjianGE
on 13 Nov 2019
Related issues
 krumo
·
3Comments
krumo
·
3Comments
 nanyoullm
·
3Comments
nanyoullm
·
3Comments
 qijiezhao
·
3Comments
qijiezhao
·
3Comments
 CF2220160244
·
3Comments
CF2220160244
·
3Comments
 hadim
·
4Comments
hadim
·
4Comments
Most helpful comment
Hi, I found it works just by editing on demo/Mask_R-CNN_demo.ipynb to visualize predictions.
change 1:
change 2: