Marlin: [FR]: show CPU usage on LCD / how to debug stutter at high speed
it would help to show CPU usage time % on the LCD,
to get a sense how much more speed, etc is still available
 Andrei-Pozolotin
All 13 comments
The MEGA 2560 is already under a lot of strain.
This may work for 32 bit processors, however I don't see this as being useful
 Grogyan
on 7 Jul 2017
Grogyan
on 7 Jul 2017
I'm afraid we cannot show "CPU load" on the screen.. Marlin runs on a micro-controller.
😆
 jbrazio
on 7 Jul 2017
jbrazio
on 7 Jul 2017
so when printer is stuttering at high speed, how can one tell apart:
a) is it planner queue overflow?
b) is it octoprint serial link underflow?
c) there is no more time left in CPU loop?
Regarding the way to measure the load:
1) MEGA 2560 has 2 timers, right?
2) then I presume it would require minimal extra CPU load to measure loop time?
3) finally there must be a way to differentiate "free vs busy" measured loop time, correct?
Andrei-Pozolotin
on 7 Jul 2017
Usually the speed is set too high.
Or the belt is looser than it should be.
Or too much weight on the hotend.
Or a worn out drive belt and / or drive pully.
 Tannoo
on 7 Jul 2017
Tannoo
on 7 Jul 2017
I have tons of things enabled on my system and stuttering is never an issue. (Although, it's not a delta) This 8-bit microcontroller is actually doing quite a bit...seemingly all at once.
Tannoo
on 7 Jul 2017
@Andrei-Pozolotin I understand the desire to see how much of the CPU is not being used. And there may be ways we can get that number. But there is probably a more useful number (or bar chart) to display. I think it would be valuable to see how many stepper motor buffers are queued up and waiting to be processed. As long as this is 4 or 5 deep, we are in no danger of running out of work to do (and stuttering).
I actually have some code that displays a nice bar chart on MAX7219 8x8 LED Matrix. http://www.ebay.com/itm/MAX7219-8x8-LED-Matrix-Modul-Dot-Matrix-Module-for-Arduino-Raspberry-Pi-MF-/182291658276?var=&hash=item2a716df624:m:mmRWGGyUDu52cCH26Q9wl2g
I've been using it as a debug tool to give me lots of status LED's I can toggle on and off. But It is kind of fun to watch as a print is going to see how full the stepper movement buffers are. I'll probably add the code soon to display that bar chart along with other status indicators for the printer. If you are willing to spend $1.83 and order one... I'll post the .SCAD files to print a nice bracket to hold it (along with debug and reset switches) on your printer.... It probably wouldn't be that hard to add a separate bar chart on it to indicate free CPU time. And temperature stability... And filament usage speed... etc. etc.
@Tannoo Let me twist your arm to order one (or two) of them too... For sure, you will have fun messing with it. But it is a very useful debug tool.
 Roxy-3D
on 7 Jul 2017
Roxy-3D
on 7 Jul 2017
@Roxy-3D thank you for the idea.
I am not sure: why bother with extra display device?
since there is already 22 x 5 LCD in the printer, would it be easy enough
to add a "debug screen" entry to the standard LCD menu,
which would display last X seconds averages for MIN/MAX values of these buffers?
?
Andrei-Pozolotin
on 7 Jul 2017
@Roxy-3D I've already got a few extra MAX7219's lying around. I'd love to do this!!! :P
 agaskins
on 8 Jul 2017
agaskins
on 8 Jul 2017
I am not sure: why bother with extra display device?
Well.... Remember who you are talking to... I wanted lots of extra debug LED's I could set or reset as the firmware did things to help me debug difficult problems. I wanted the LCD Panel unaffected by debug activity. So that is why it happened.
I am not sure: why bother with extra display device? since there is already 22 x 5 LCD in the printer, would it be easy enough to add a "debug screen" entry to the standard LCD menu,
Yes... In your case you have enough extra space you could do it without gooffing up the normal display. So, maybe the first thing to do is get the Stepper Motor Queue depth plotted on the MAX7219 displays. And... Once that is working for everybody we make a small change to do the same thing on 5x22 displays instead.
@agaskins Here is the .SCAD file for my Max-7219 on a FolgerTech i3-2020. Obviously your machine is different, but you can probably make use of it if you wanted to mount a Max-7219 on the printer.
translate([0,0,25])
rotate([180,0,0])
corner_reset_switch();

module corner_reset_switch()
{
    difference() {
        union() {
            cube([105,71,25]);
            translate([97,22,5]) rotate([0,20,0]) cube([15,49,25]);
        }

        translate([0,0,25]) cube([200,200,200]);        // shear off extra from rotated matrix mount

        translate([5,5,-.01]) aluminum_frame();
        translate([31,30,-2.5]) cube([36.5,39,24]);     // Cut off extra material under push switches

        translate([71,30,-2.5]) cube([30.0,39,24]);     // Cut off extra material under power switch
        translate([41,49,-.2]) switch_body();
        translate([58,40,-.2]) switch_body();
        translate([58,59,-.2]) switch_body();
        translate([63,25,-.01]) rotate([0,0,0]) cube([10,10,20]);   // for push button switch wires to get in

        translate([83,47,-.2]) cylinder(r=3.15, h=50, $fn=45);

        translate([90,58,14]) rotate([0,90,0]) cylinder(r=3.5, h=40, $fn=25);   // hole for power cord to come in
        translate([90,65,5.5]) rotate([0,90,0]) cylinder(r=3.5, h=40, $fn=25);  // hole for power cord to come out

        translate([106,28,18]) rotate([0,-45,0]) matrix();
        translate([95,20,-10]) rotate([0,0,0]) cube([5,15,25]);
    }
    mouse_ears();
}


module aluminum_frame()
{
    difference() {
        union() {
            cube([21,70,21]);
            cube([120,21,21]);
        }
        translate([7.5,-.1,15.01]) cube([6,55,6]);
        translate([22,7.5,15.01]) cube([72,6,6]);
    }
}

module switch_body() {
    difference() {
        cylinder(r=12.7/2, h=30, $fn=50);
        translate([6,-10,0]) cube([5,25,30]);
        translate([-6-5,-10,0]) cube([5,25,30]);
    }
}


module matrix() {
    translate([0,0,0]) cube([45,34,12.5]);
    translate([-15,8.0, -7]) cube([25,17,14]);
}

module mouse_ears() {
    difference() {
        union() {
            translate([0,0,25 -.55]) cylinder(r=15, h=.55);
            translate([107,0,25 -.55]) cylinder(r=15, h=.55);
            translate([122,23,25 -.55]) cylinder(r=15, h=.55);
            translate([122,70,25 -.55]) cylinder(r=15, h=.55);
            translate([0,70,25 -.55]) cylinder(r=15, h=.55);
        }
        for(i=[0:45:360]) translate([0,0,-.1]) rotate([0,0,i]) translate([6,0,24]) cube([5,1,5]);
        for(i=[0:45:360]) translate([107,0,-.1]) rotate([0,0,i]) translate([6,0,24]) cube([5,1,5]);
        for(i=[0:45:360]) translate([122,23,-.1]) rotate([0,0,i]) translate([6,0,24]) cube([5,1,5]);
        for(i=[0:45:360]) translate([122,70,-.1]) rotate([0,0,i]) translate([6,0,24]) cube([5,1,5]);
        for(i=[0:45:360]) translate([0,70,-.1]) rotate([0,0,i]) translate([6,0,24]) cube([5,1,5]);
    }
}
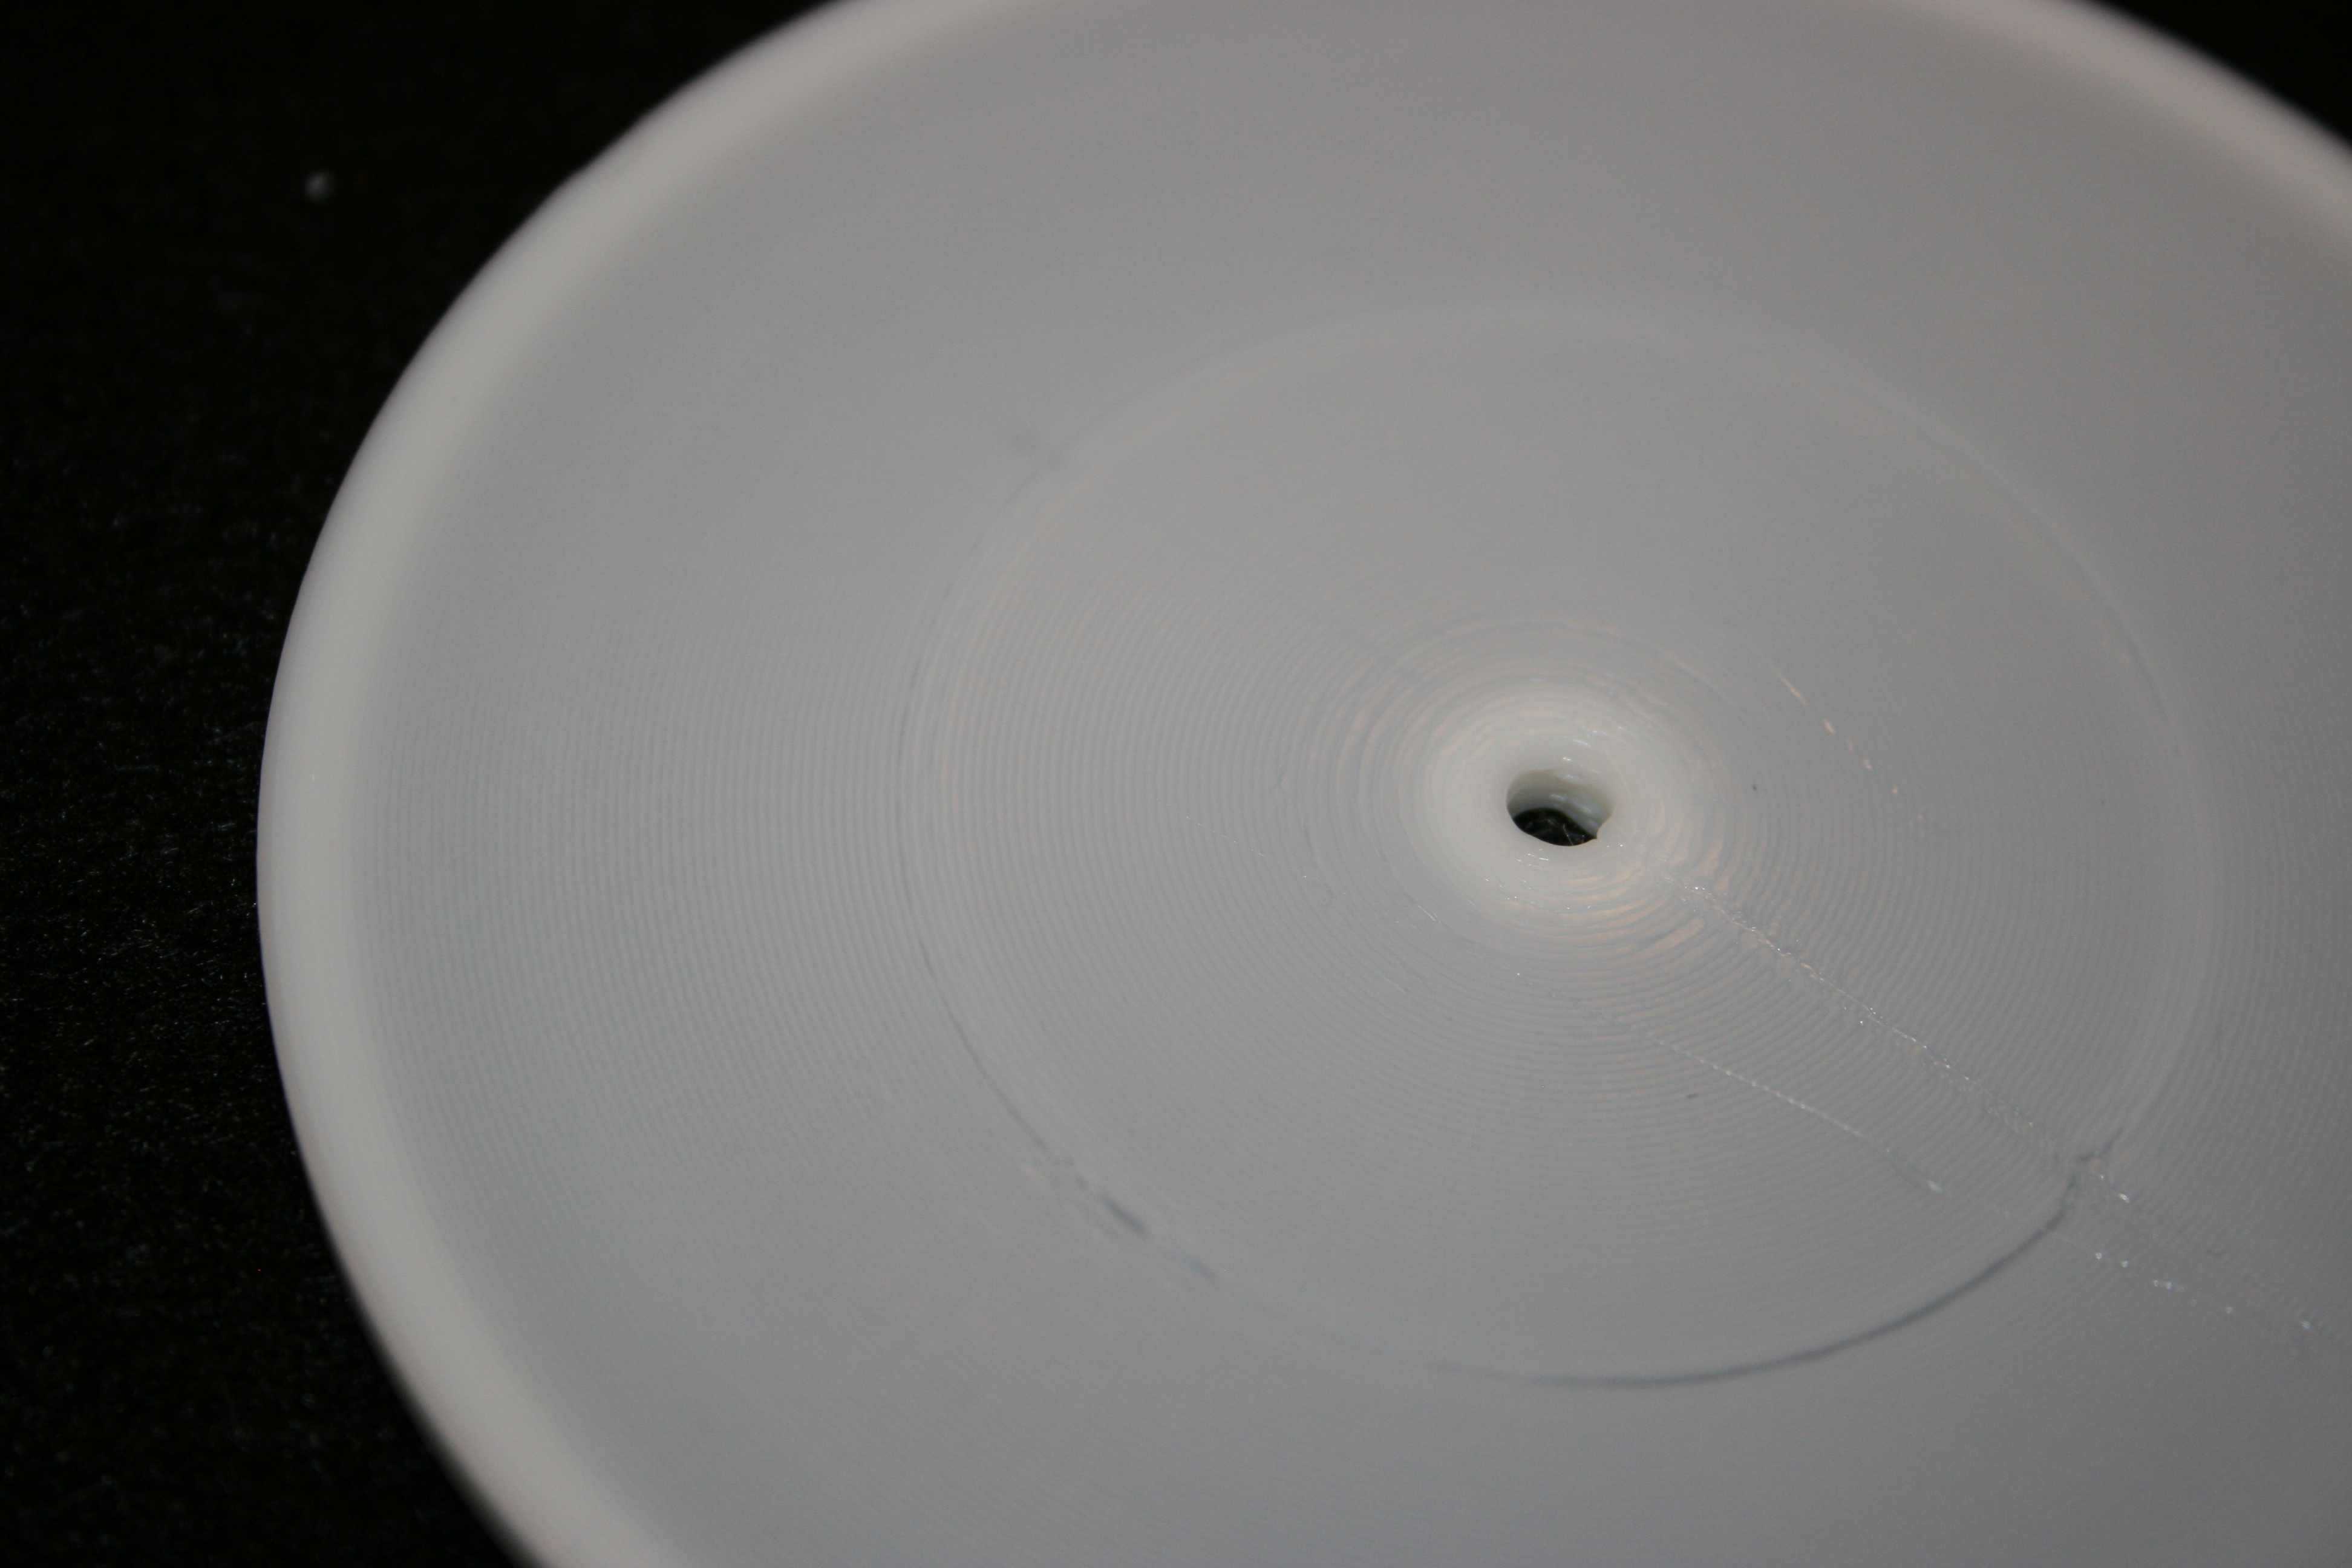
funny: disabling of FASTER_GCODE_PARSER removes much stutter (except at small radius)
before
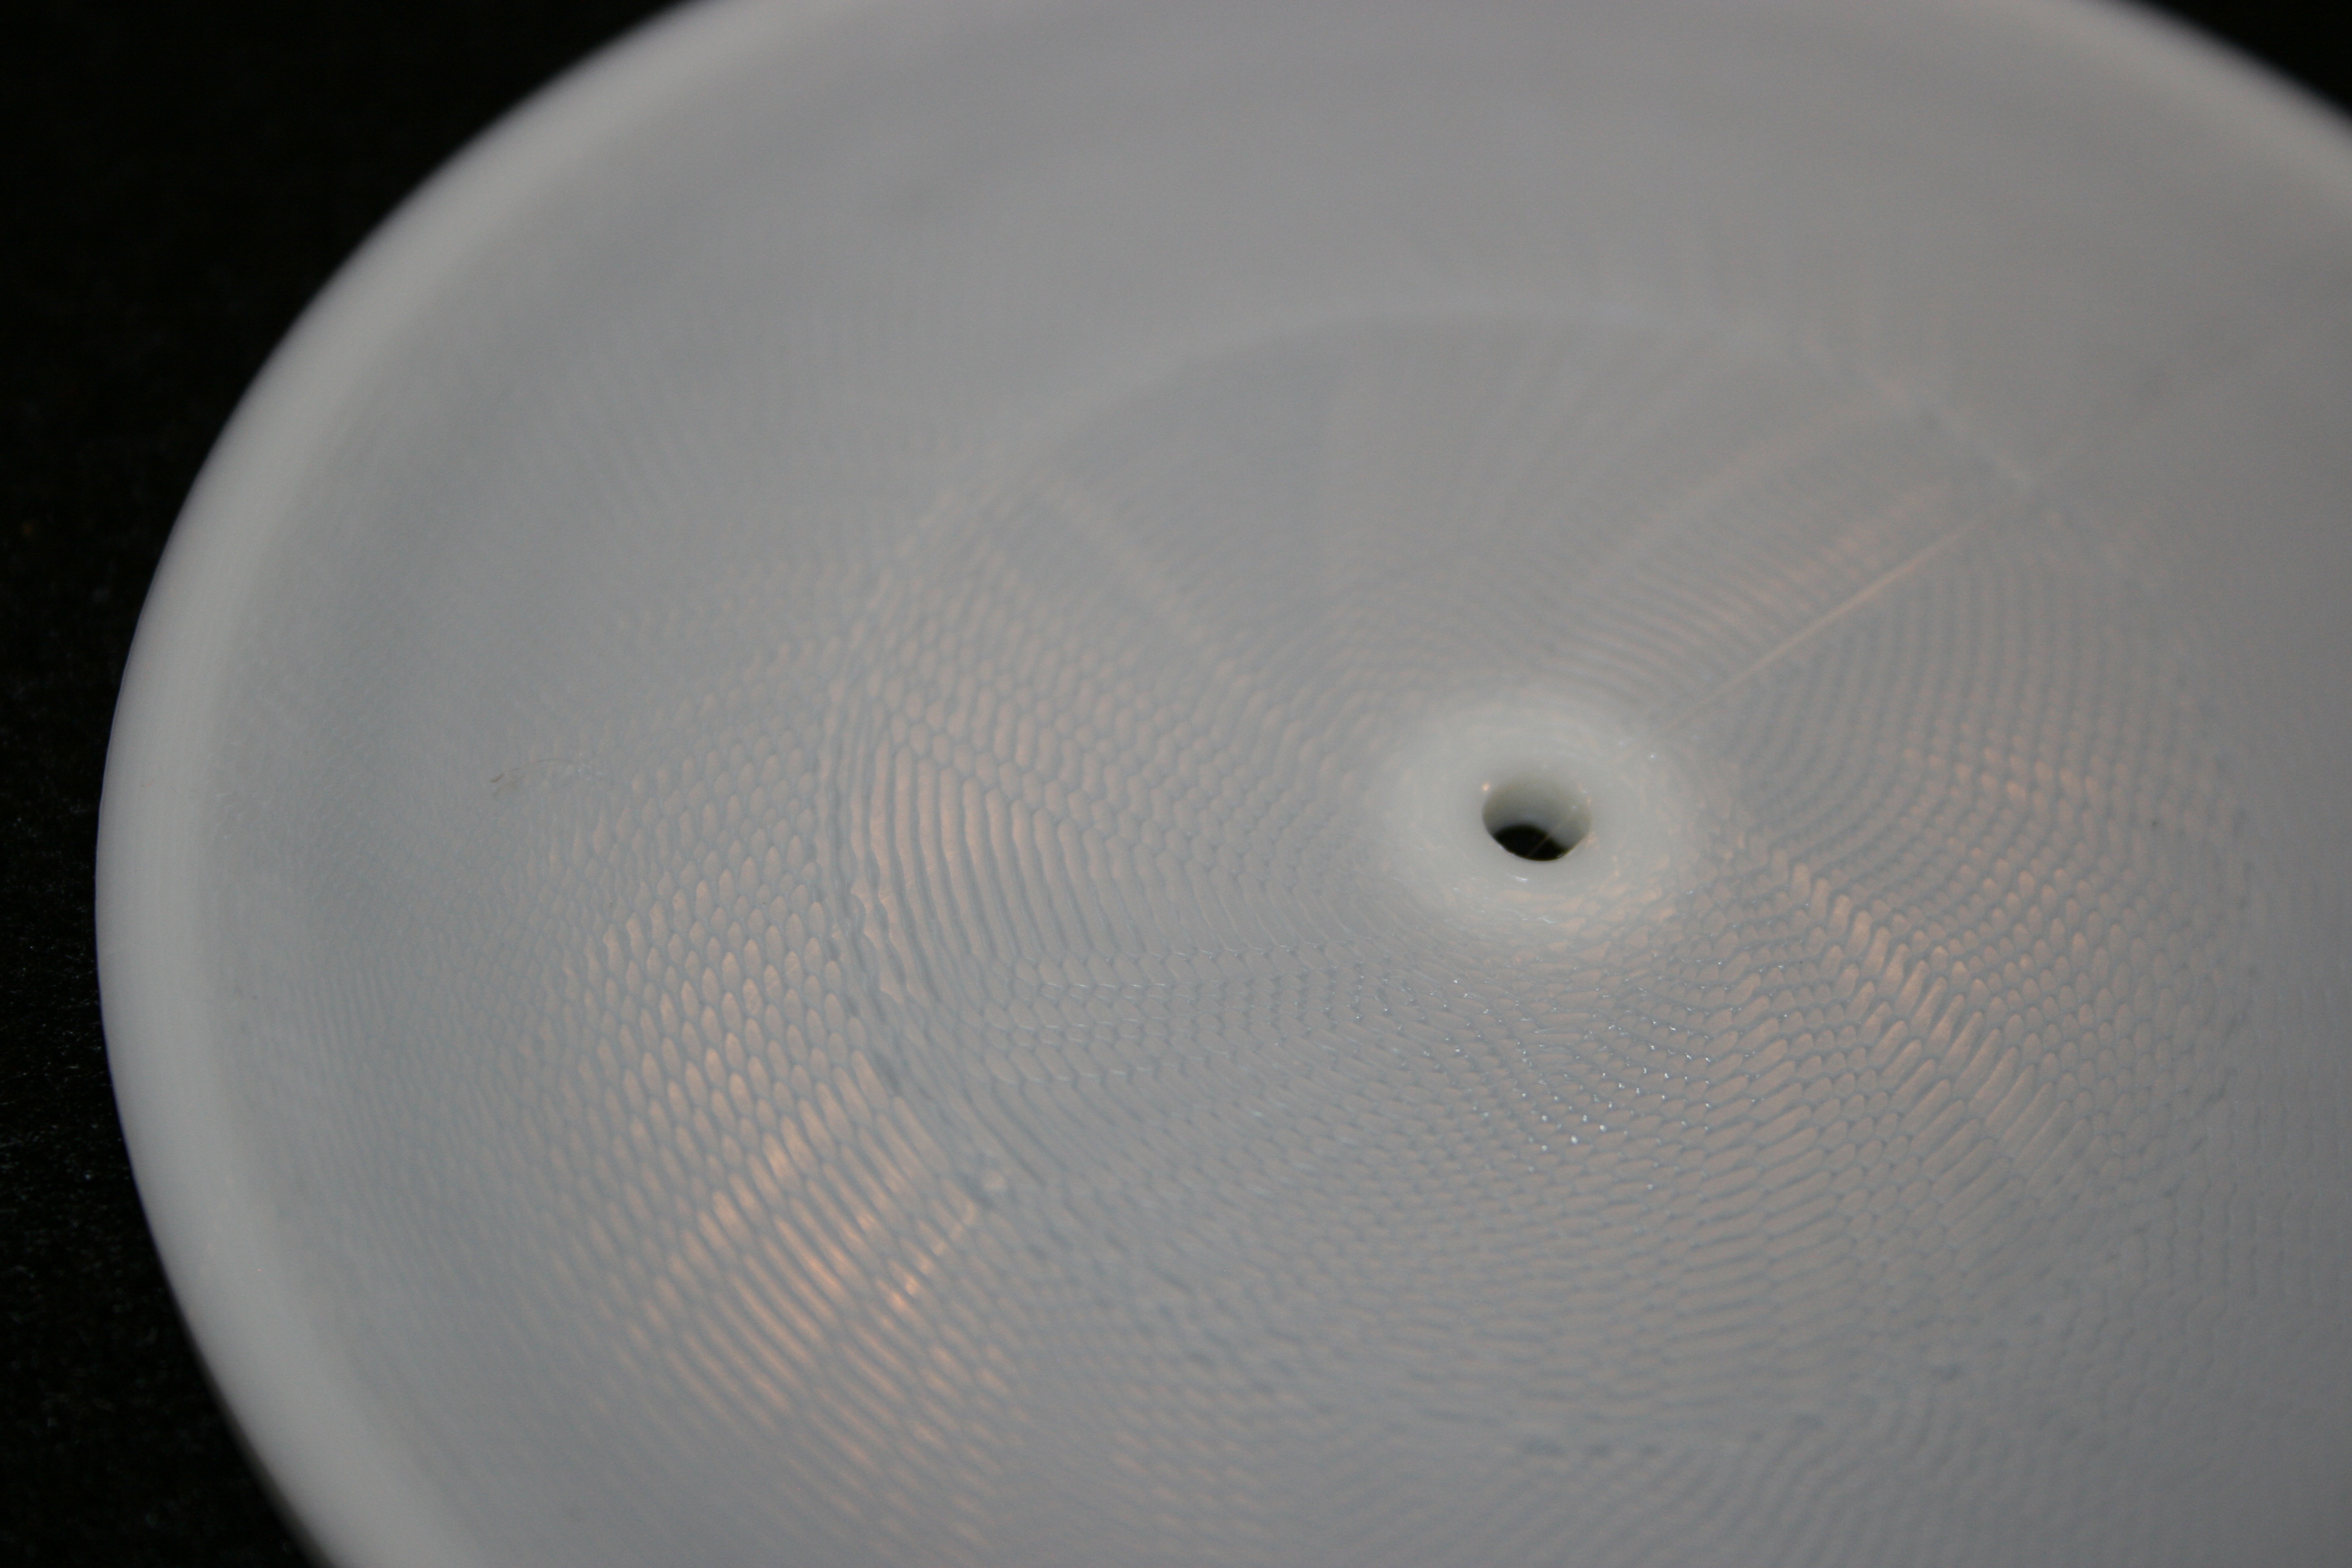
after
Andrei-Pozolotin
on 9 Jul 2017
That is surprising ! 😱
 fiveangle
on 11 Jul 2017
fiveangle
on 11 Jul 2017
@Andrei-Pozolotin
it would help to show CPU usage time % on the LCD, to get a sense how much more speed, etc is still available
I'm not sure where to put it but I was thinking of using the lower line of the X,Y,Z box as an optional bar chart to display how full the Stepper Motor command buffer is. It'll be a lot of work to clear more space, but just to see if the idea is useful... If you have a Graphical LCD, I'm thinking you will be able to try it out in a few days.
Roxy-3D
on 11 Jul 2017
For insight into internal performance, we recommend using the MAX7219_DEBUG option.
 thinkyhead
on 9 Feb 2018
thinkyhead
on 9 Feb 2018
Related issues
 manianac
·
4Comments
manianac
·
4Comments
 Ciev
·
3Comments
Ciev
·
3Comments
 spanner888
·
4Comments
spanner888
·
4Comments
 StefanBruens
·
4Comments
StefanBruens
·
4Comments
 jerryerry
·
4Comments
jerryerry
·
4Comments
Most helpful comment
@Andrei-Pozolotin I understand the desire to see how much of the CPU is not being used. And there may be ways we can get that number. But there is probably a more useful number (or bar chart) to display. I think it would be valuable to see how many stepper motor buffers are queued up and waiting to be processed. As long as this is 4 or 5 deep, we are in no danger of running out of work to do (and stuttering).
I actually have some code that displays a nice bar chart on MAX7219 8x8 LED Matrix. http://www.ebay.com/itm/MAX7219-8x8-LED-Matrix-Modul-Dot-Matrix-Module-for-Arduino-Raspberry-Pi-MF-/182291658276?var=&hash=item2a716df624:m:mmRWGGyUDu52cCH26Q9wl2g
I've been using it as a debug tool to give me lots of status LED's I can toggle on and off. But It is kind of fun to watch as a print is going to see how full the stepper movement buffers are. I'll probably add the code soon to display that bar chart along with other status indicators for the printer. If you are willing to spend $1.83 and order one... I'll post the .SCAD files to print a nice bracket to hold it (along with debug and reset switches) on your printer.... It probably wouldn't be that hard to add a separate bar chart on it to indicate free CPU time. And temperature stability... And filament usage speed... etc. etc.
@Tannoo Let me twist your arm to order one (or two) of them too... For sure, you will have fun messing with it. But it is a very useful debug tool.