Makie.jl: Feature request: contourf
I thought there was already an issue for this, but it seems not... So here it is:
It would be great to have filled contours in Makie.jl!
 briochemc
All 11 comments
There is already if you do:
using Makie
contour(rand(10,10),fillrange=true)
Or do you mean the "convenience" function contourf explicitly?
 aramirezreyes
on 20 Nov 2019
aramirezreyes
on 20 Nov 2019
Although fillrange = true behaves kind of weird:
Doing the example in here
using Makie
 N = 20
 x = LinRange(-0.3, 1, N)
 y = LinRange(-1, 0.5, N)
 z = x .* y'
contour(x, y, z, levels = 3, linewidth = 1, fillrange = true)
The result is :
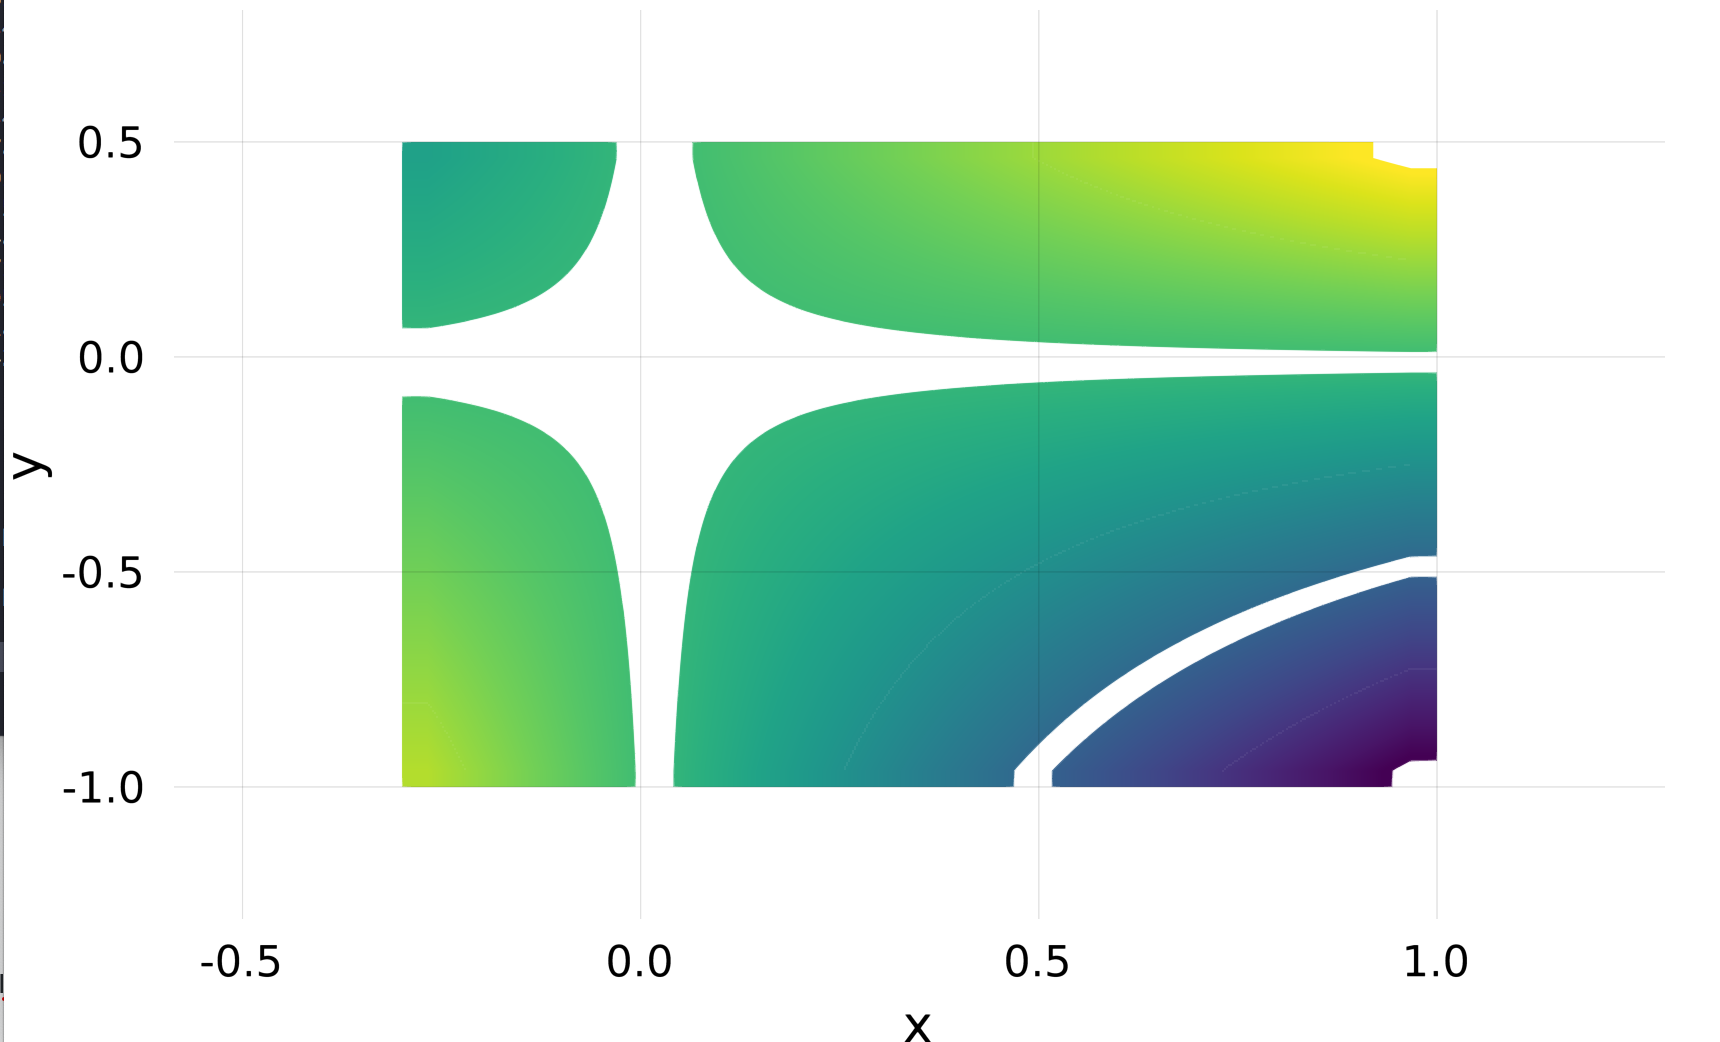
Which looks weird because there is a gradient in between contour lines, which is not the usual.
The example with Plots.jl (gr backend) looks like this:
using Plots
contourf(x, y, z', levels = 3, linewidth = 1, c = :viridis)
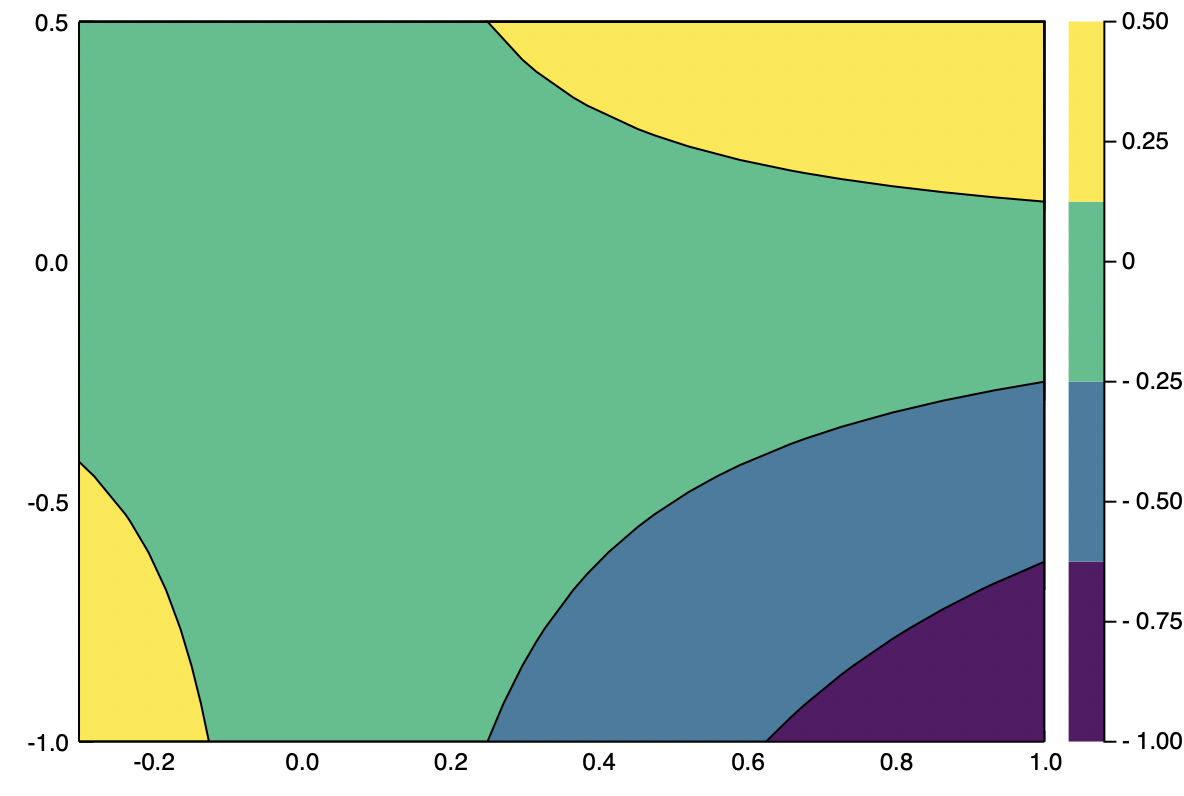
So I think @briochemc's request makes a lot of sense.
aramirezreyes
on 20 Nov 2019
FWIW I do think having an explicit contourf would be great, because it is common among plotting libraries/languages in my (little) experience.
Bonus would be an extend keyword for the colorbar as I suggested just hours ago for Plots.jl there.
briochemc
on 20 Nov 2019
contour(x, y, z, levels = 3, linewidth = 1, fillrange = true) does indeed act strange since it's computed on the gpu with a very simple shader... On the up side, it's super fast :D
You should be possible to create a simple recipe that recreates what Plots.jl contourf is doing, though...
 SimonDanisch
on 20 Nov 2019
SimonDanisch
on 20 Nov 2019
Well it's possible to fix the shader to do the right thing in the longer term but I haven't looked at the details. With evenly spaced levels it should be particularly easy because it's just a rescaling and a call to floor which can happen pixelwise. For arbitrary levels we'd probably need a 1D texture to look up the levels or some such thing. Depends on the detail of which data is copied over to the GPU...
 c42f
on 25 Nov 2019
c42f
on 25 Nov 2019
Has there been any update on this?
briochemc
on 11 Mar 2020
For the record, there is a workaround for contourf-like plots. It's to use
heatmap(..., colormap=cgrad(..., categorical=true), interpolate=true, ...)
(thanks @AlexisRenchon and @asinghvi17?)
MWE:
x = -3:0.01:3
y = -2.5:0.1:2.5
peaks(x,y) = 3*(1-x)^2 * exp(-(x^2) - (y+1)^2) - 10*(x/5 - x^3 - y^5) * exp(-x^2-y^2) - 1/3*exp(-(x+1)^2 - y^2)
z = [peaks(x,y) for x in x, y in y]

using AbstractPlotting
using AbstractPlotting.MakieLayout
using GLMakie
scene, layout = layoutscene()
display(scene)
ax1 = layout[1,1] = LAxis(scene)
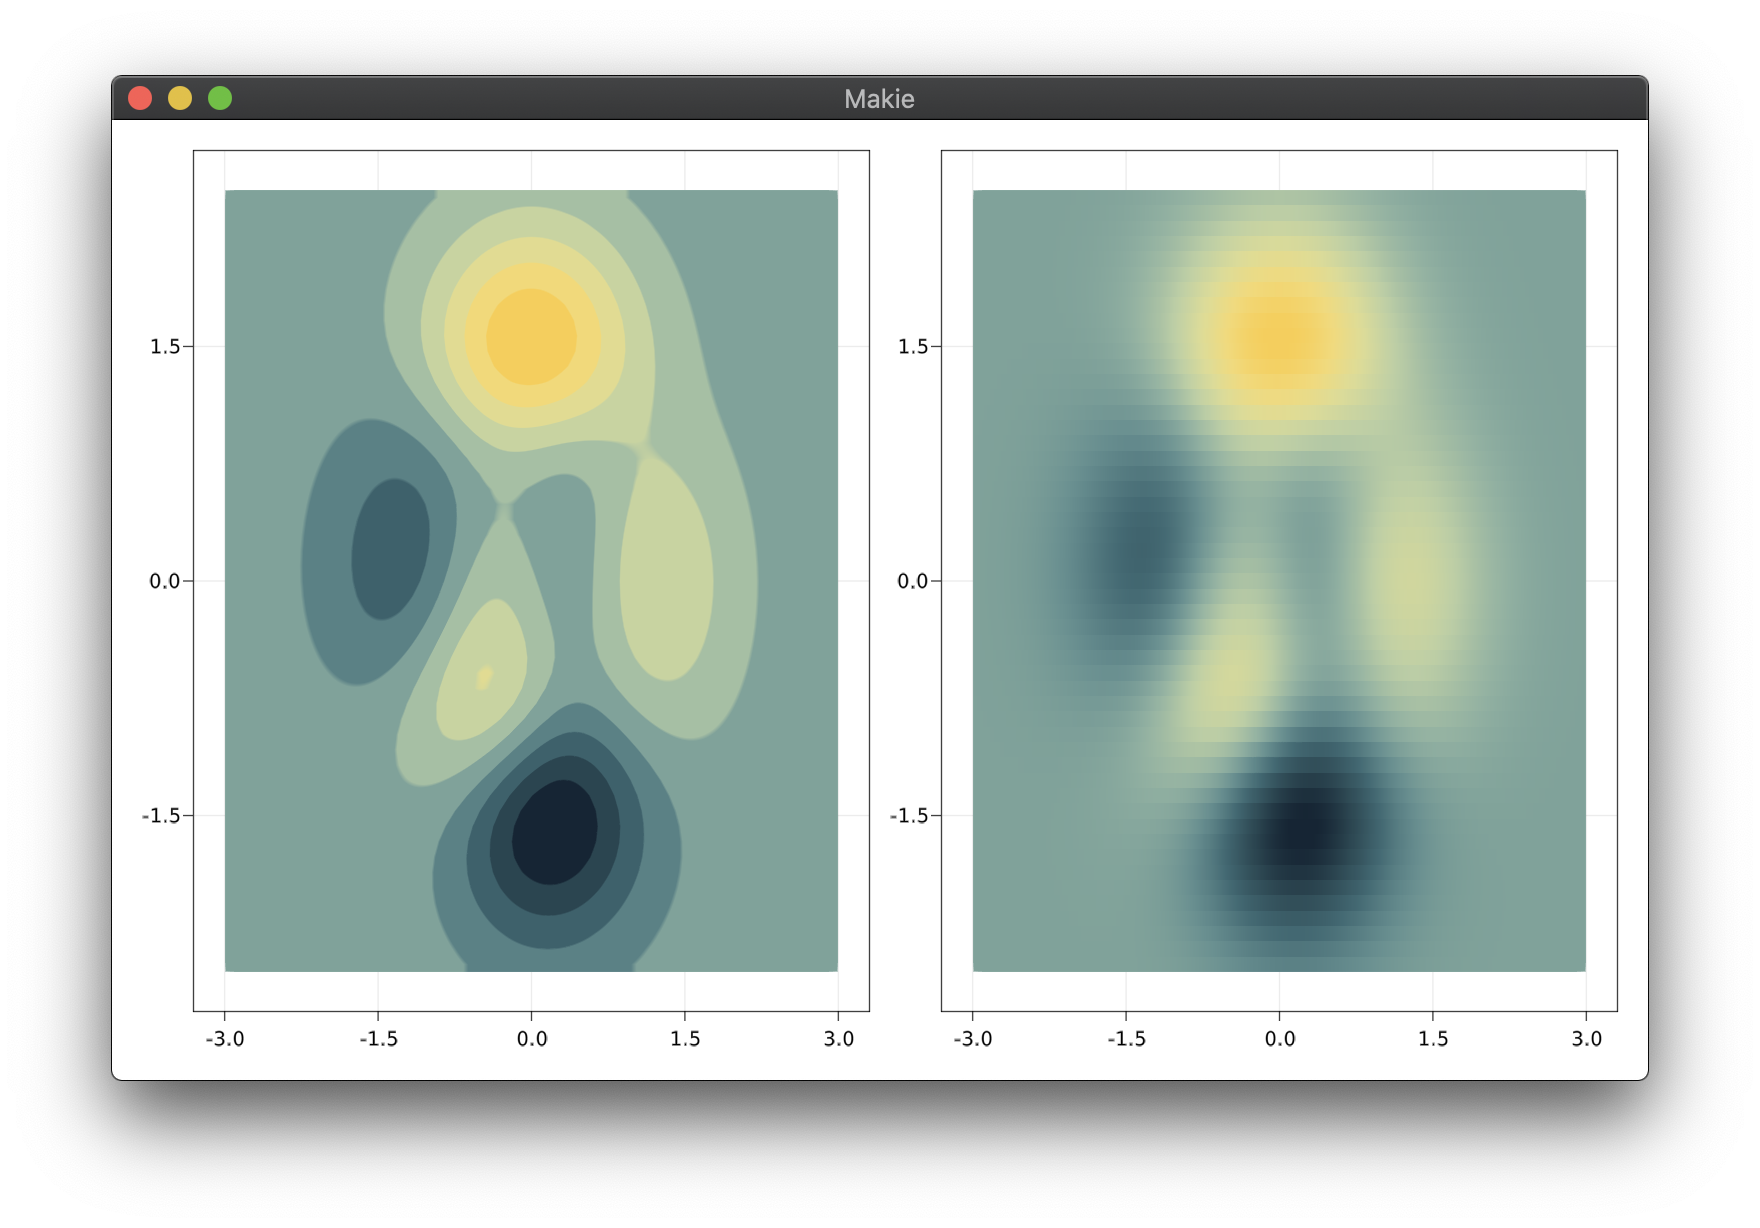
heatmap!(ax1, x, y, z, colormap=cgrad(:starrynight, 10, categorical=true), interpolate=true)
ax2 = layout[1,2] = LAxis(scene)
heatmap!(ax2, x, y, z, colormap=:starrynight)
gives (contourf look-alike on the left, default heatmap on the right):
briochemc
on 4 Aug 2020
This is great! Thanks.
Are there obvious reasons not to set contourf to be an alias of this? It is better than what we already have.
By the way, why is this different than a real contourf? Is it because of the ability of setting arbitrary levels?
Edit:
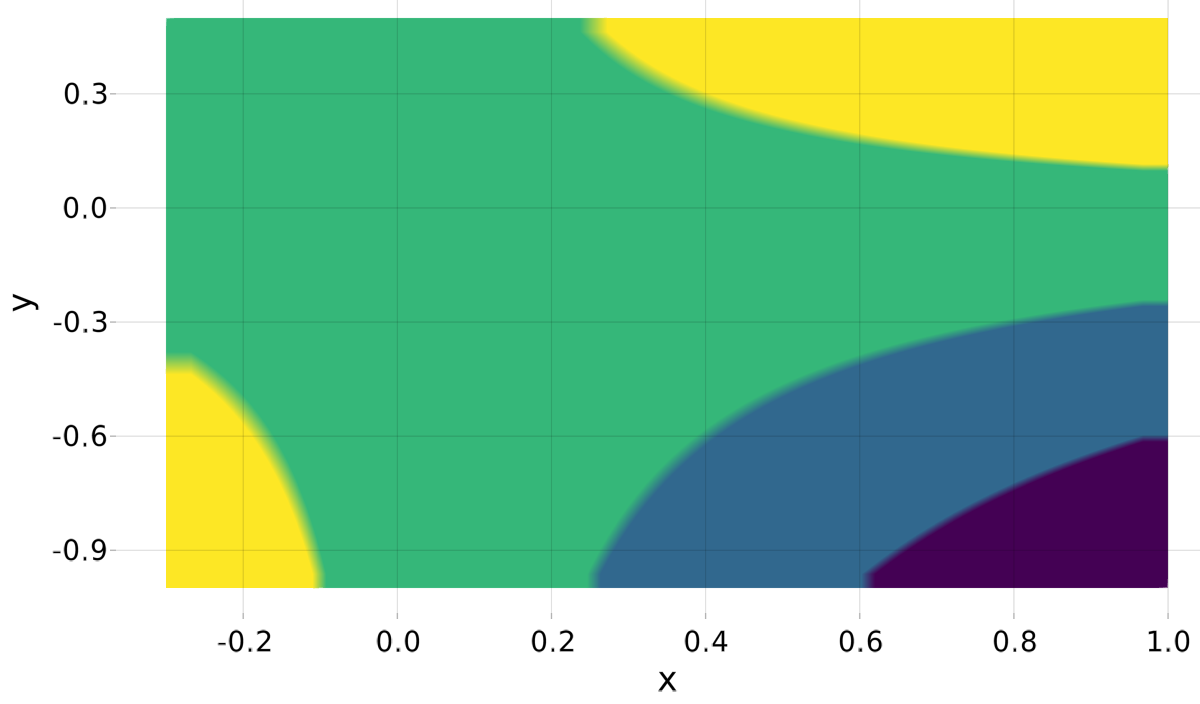
Ah! I see. This is how the original example looks like. It has some weird quirks on the borders. Still a better approximation to the previous one!
aramirezreyes
on 4 Aug 2020
I seem to recall that @jkrumbiegel created an actual filled contour function for Makie not so long ago (and showed it on Slack). Any chance it can make it into the package soon?
briochemc
on 9 Oct 2020
SimonDanisch
on 9 Oct 2020
there's even preview docs with it http://makie.juliaplots.org/previews/PR500/plotting_functions.html
although one thing I wasn't sure about yet, how are colors assigned in filled contour plots? it doesn't matter if the gaps are all equally wide, but if not?
 jkrumbiegel
on 9 Oct 2020
jkrumbiegel
on 9 Oct 2020
Related issues
 utotch
·
4Comments
utotch
·
4Comments
 Photonico
·
3Comments
Photonico
·
3Comments
 chriselrod
·
5Comments
chriselrod
·
5Comments
 EricForgy
·
5Comments
EricForgy
·
5Comments
 asinghvi17
·
5Comments
asinghvi17
·
5Comments
Most helpful comment
there's even preview docs with it http://makie.juliaplots.org/previews/PR500/plotting_functions.html
although one thing I wasn't sure about yet, how are colors assigned in filled contour plots? it doesn't matter if the gaps are all equally wide, but if not?