Hi,
Is it planned to add a streamplot function in Makie (like the matplotlib's/matlab one) ?
Maybe there is already an equivalent function...
Laurent
 LaurentPlagne
All 22 comments
I believe there is an implementation of streamlines on master, but I'm not sure what the inputs are supposed to be.
 asinghvi17
on 19 May 2019
asinghvi17
on 19 May 2019
Thank you very much for the hint. It gives me a direction to investigate.
LaurentPlagne
on 19 May 2019
Well no docstrings, nothing to be found in the doc with streamlines keyword, and when I try @less I found very abstract sources... Maybe the authors hide this function on purpose ;)
LaurentPlagne
on 20 May 2019
is the current implementation, not sure what it does though :P ...good luck!
asinghvi17
on 20 May 2019
Seems to be from #72
 ffreyer
on 23 May 2019
ffreyer
on 23 May 2019
yep it does not correspond to Matplotlib streamlines... Would be very useful for CFD visualization ;)
LaurentPlagne
on 21 Jun 2019
Can you post a foto of what you would expect?
 SimonDanisch
on 21 Jun 2019
SimonDanisch
on 21 Jun 2019
Typically I would like something similar to
https://matplotlib.org/3.1.0/gallery/images_contours_and_fields/plot_streamplot.html
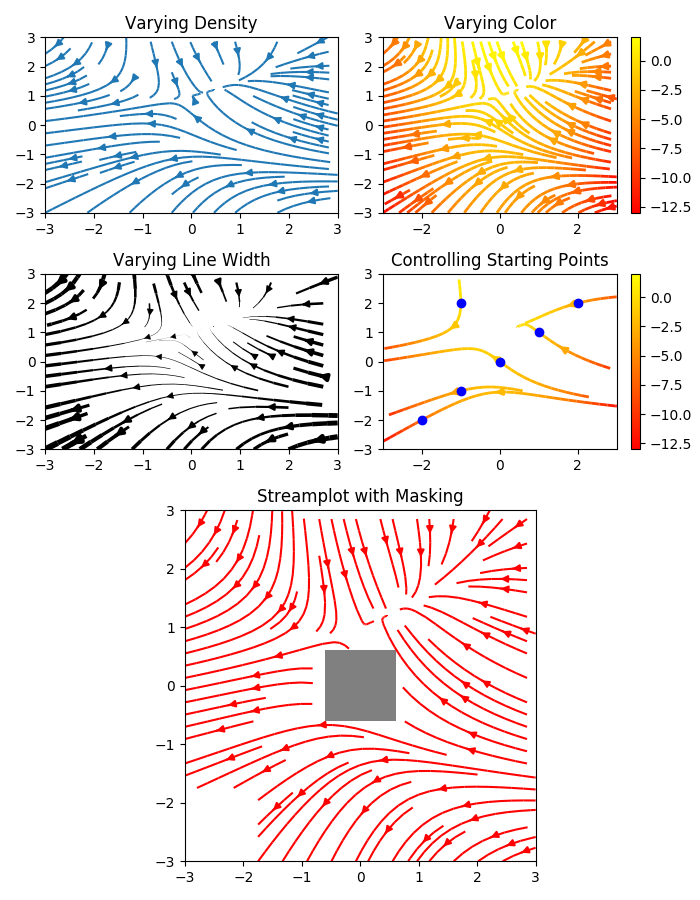
but at the Makie speed ;)
LaurentPlagne
on 21 Jun 2019
is that simply a contour plot with arrows?
SimonDanisch
on 21 Jun 2019
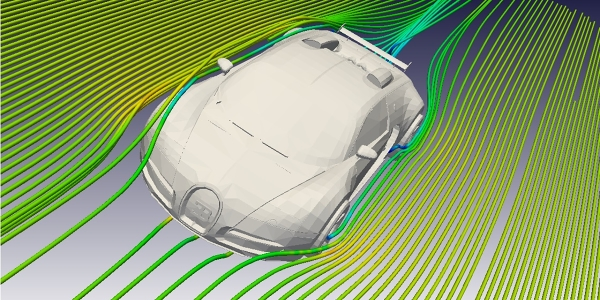
Not exactly, it plots 2D (3D) vector fields (e.g. velocities in fluid). It is more similar to quiver but not displayed on a regular grid. I did not investigate the python's (or matlab's which offers a similar function) algorithm. This kind of viz is quite extensively used in physics and especially CFD (e.g stream lines around a car for aerodynamic study).
LaurentPlagne
on 21 Jun 2019
In 3D (which I don't need now)
LaurentPlagne
on 21 Jun 2019
The underlying algorihm in python:
https://matplotlib.org/devdocs/_modules/matplotlib/streamplot.html
I should be able to translate this to Julia but my Makie skills are clearly not sufficient to make a PR ;)
LaurentPlagne
on 21 Jun 2019
The tricky part seems to be to keep the distance between streams within a range.
class StreamMask:
"""Mask to keep track of discrete regions crossed by streamlines.
The resolution of this grid determines the approximate spacing between
trajectories. Streamlines are only allowed to pass through zeroed cells:
When a streamline enters a cell, that cell is set to 1, and no new
streamlines are allowed to enter.
This suggest the following algorithm:
While there are empty boxes, pick a new box (preferably close to the boundary), draw a streamline starting from the center of the box, follow it until it hits a box already occupied by a streamline. Rinse and repeat.
 mschauer
on 21 Jun 2019
mschauer
on 21 Jun 2019
using Makie
using Random
struct FitzhughNagumo{T}
    ϵ::T
    s::T
    γ::T
    β::T
end
Random.seed!(10)
point(x) = Makie.Point2f0(x)
point(x, y) = Makie.Point2f0(x, y)
const Point = Makie.Point2f0

f(x, P::FitzhughNagumo) = Point((x[1]-x[2]-x[1]^3+P.s)/P.ϵ,
                                         P.γ*x[1]-x[2] + P.β)

f(x) = f(x, P)

P = FitzhughNagumo(0.1, 0.0, 1.5, 0.8)
R = 1.5
l = (32, 32)
limits = FRect(-R, -R, 2R, 2R)
r = (range(limits.origin[1], limits.origin[1] + limits.widths[1], length=l[1]+1),
 range(limits.origin[2], limits.origin[2] + limits.widths[2], length=l[2]+1)
)
p = Scene(resolution=(1600,1000), limits=limits)

mask = trues(l...)
arrows = Tuple{Point,Point}[]

for c in CartesianIndices(mask)

    i0, j0 = Tuple(c)
    x0 = Point(first(r[1]) + (i0 - 0.5)*step(r[1]),
              first(r[2]) + (j0 - 0.5)*step(r[1]))
    dt = 0.01

    if mask[c]
        push!(arrows, (x0, f(x0, P)/norm(f(x0, P))))

        mask[c] == false
        for d in (-1,1)
            x = x0
            xx = [x]
            i0, j0 = Tuple(c)
            while x in limits && length(xx) < 500
                x = x + d*dt*f(x, P)/norm(f(x, P))
                if !(x in limits)
                    break
                end
                i = searchsortedlast(r[1], x[1])
                j = searchsortedlast(r[2], x[2])
                if (i,j) != (i0, j0)
                    if !mask[i,j]
                        break
                    end
                    mask[i,j] = false
                    i0, j0 = i, j
                end
                push!(xx, x)
            end
            lines!(p, xx)
        end
    end

end
arrows!(p, first.(arrows), last.(arrows), lengthscale=0.0, arrowsize=0.05)
display(p)
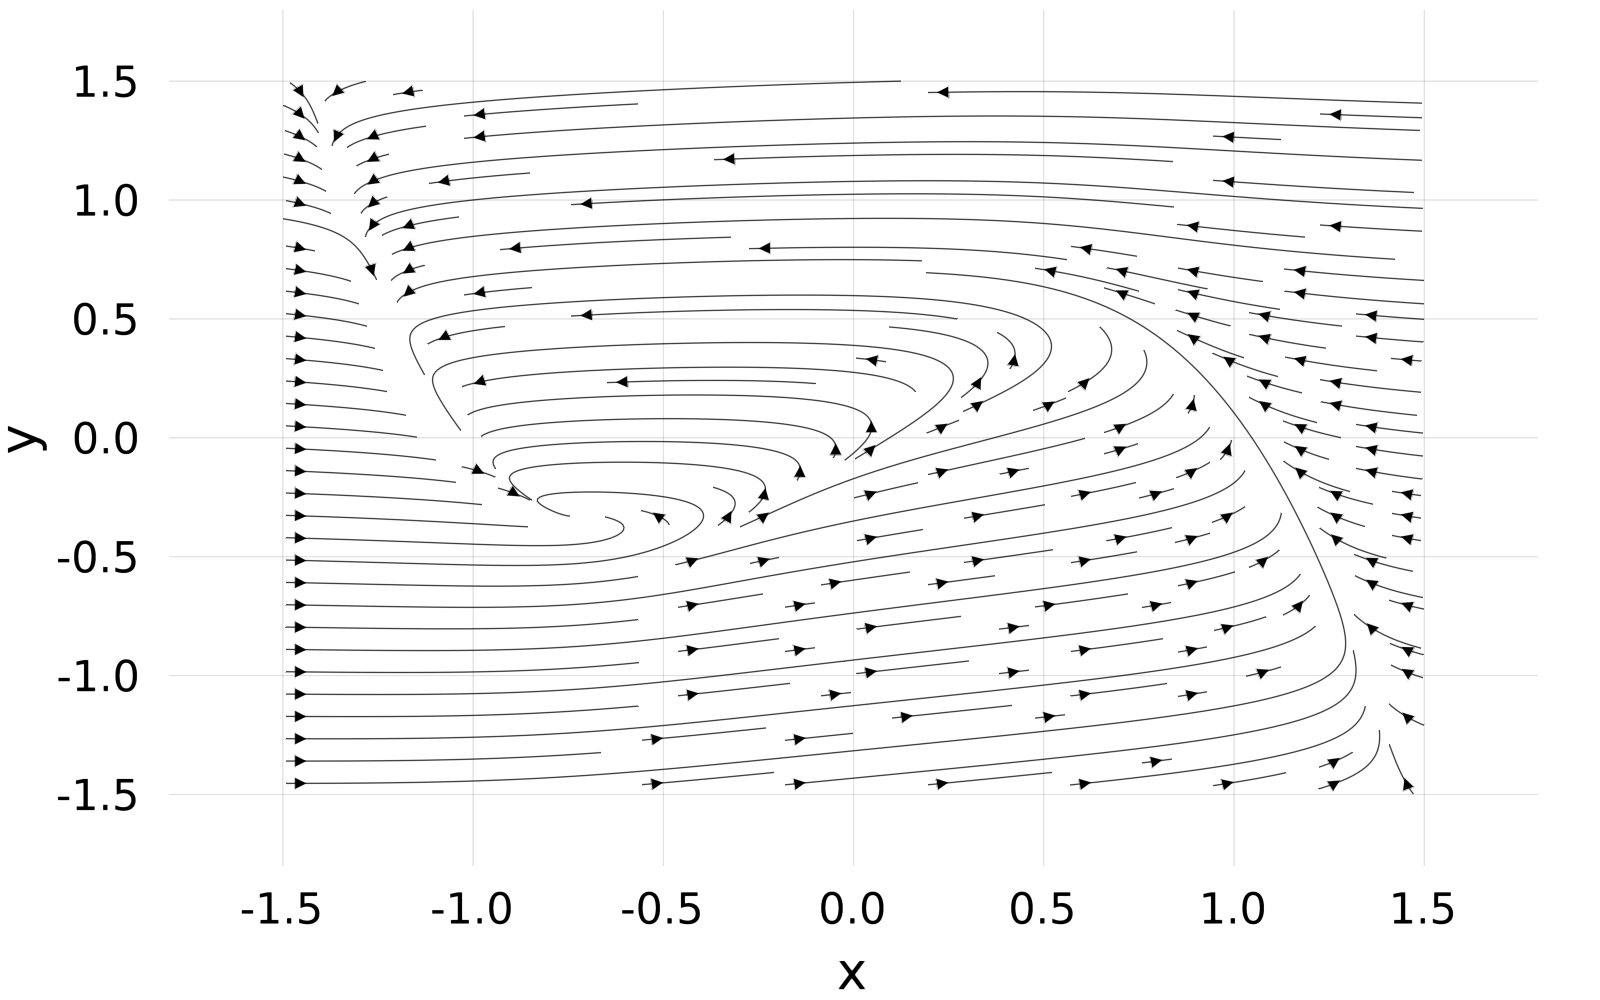
mschauer
on 21 Jun 2019
Super cool ! Thank you very much !
I have to figure how to add the mid arrows now.
LaurentPlagne
on 21 Jun 2019
Woah very cool! Lets turn this into a recipe!!
Would it generalize to 3d?
SimonDanisch
on 21 Jun 2019
Generalizing to 3D would be straight forward I think.
mschauer
on 21 Jun 2019
Arrows is easy (see above) but it is a bit tricky to find the centers as the trajectories evolve forward and backward.
mschauer
on 21 Jun 2019
Super super cool... thank you again !
I think that it is indeed of general interest and deserves to become a new recipe.
Actually people from my domain (PDE solvers for CFD and other kind of physics simulations) are a bit late to enter Julia programming (compared to math opt or data science) and this kind of visualization recipe participate to accelerate the move ;)
LaurentPlagne
on 21 Jun 2019
SimonDanisch
on 29 Jul 2019
We could keep this open for the 3D case
mschauer
on 2 Aug 2019
Already done :)
asinghvi17
on 3 Aug 2019
Related issues
 fa-bien
·
3Comments
asinghvi17
·
5Comments
fa-bien
·
3Comments
asinghvi17
·
5Comments
 grahamas
·
3Comments
grahamas
·
3Comments
 chriselrod
·
5Comments
chriselrod
·
5Comments
 mohamed82008
·
6Comments
mohamed82008
·
6Comments
Most helpful comment