Makie.jl: markersize should be specified in axis coordinates by default
To the best of my understanding markersize for scatter gives the size to data coordinates by default.
This is very confusing and makes it difficult to choose good marker sizes for different data.
I suggest the scale of this thing to be by default the axis scale e.g.
let's say from both x and y axis pick the biggest one and assume its size to be 1.0 .Then markersize corresponds to these units from 0 all the way to 1.0.
 Datseris
All 17 comments
The current convention is very helpful for some tasks (e.g. https://gist.github.com/mschauer/a58e5ccab971a617ec965253ac3407bf) it would be nice to leave it as an option. Whether markersize as a fraction of the axis length (as I understand you) is a good default, I cannot say. A different option would be to link the marker size to the size of text elements of the plot.
 mschauer
on 10 Nov 2018
mschauer
on 10 Nov 2018
I think marker size as a fraction of the axis length is the best default. It is also the only way you can guarantee a good default value for it. Otherwise the current default value, whatever it may be, it cannot be good for all data.
Datseris
on 10 Nov 2018
As I also said on discourse I think it makes sense to distinguish between dimensionless points that have no size but are shown by a marker which has a size in the display window; and spheres that have a size in the coordinate system. It would be possible to plot both with scatter, but the common convention (and my recommendation) is for scatter to have dimensionless points with markers by default (as also suggested by @Datseris ). If you want spheres like in @mschauer 's example you can pass a Sphere object to marker.
An alternative solution (which I think is clearer) is to have coordinate-system objects in meshscatter and always just points in scatter.
I don't think the markers should be in units of the axis length, I think they should be in Pt or whatever pixel implementation is used for font sizes and axis line widths.
 mkborregaard
on 11 Nov 2018
mkborregaard
on 11 Nov 2018
I don't think the markers should be in units of the axis length, I think they should be in Pt or whatever pixel implementation is used for font sizes and axis line widths.
Yeap this is fine and probably what I meant... I am not really familiar with how PyPlot does it, but it is a dimensionless number, independent of the data. I guess it is this "Point" which corresponds to some pixel points.
Datseris
on 11 Nov 2018
Somehow related: it seems that the radius is missing at HyperSphere Radius or is it on purpose?
 edljk
on 12 Nov 2018
edljk
on 12 Nov 2018
I don't think the markers should be in units of the axis length, I think they should be in
Ptor whatever pixel implementation is used for font sizes and axis line widths.
If we want a "pixel-like" measure we could follow android with the dip https://en.wikipedia.org/wiki/Device-independent_pixel so that things would work on HighDPI screens. This would seem to be the relatively non-breaking option.
Alternatively we could go with the typographic pt or similar which might be more well defined in the long run.
 c42f
on 1 Mar 2019
c42f
on 1 Mar 2019
If the idea is to be resolution-independent (which I think would be great) it seems like a real physical measurement that represents on-screen size (like pt or mm) would be better than that device-independent pixel thing. It seems like the DIP measurement is an awkward half-step where it's supposed to be resolution-independent but you still need to know the pixel conversion factor for it to have any meaning.
Just wanted to :+1: this in general though. I just spent some time trying to figure out why my scatter markers weren't showing up, and it turned out they were just really tiny because my data goes from 0-2000 and I was plotting them over an image, so they were difficult to see.
 ssfrr
on 21 Mar 2019
ssfrr
on 21 Mar 2019
I started this here:
https://github.com/JuliaPlots/AbstractPlotting.jl/pull/91
Hope I can find some time to merge it soon!
 SimonDanisch
on 21 Mar 2019
SimonDanisch
on 21 Mar 2019
it seems like a real physical measurement that represents on-screen size (like pt or mm) would be better than that device-independent pixel thing
The problem with distance units is that they do not (and cannot) go far enough: they don't consider the distance of the user to the screen. What really matters perceptually is the angular size of the features that the user sees on the screen.
Of course, you may make an assumption that the user is sitting a "normal distance" to a monitor, but this falls down in various situations:
- Presentations on large screens
- Posters
- Handheld vs desktop
Given these difficulties I'm not convinced that baking in a strict specification of distance is a good idea: it's not even measuring features in the right units!
I feel like the DIP might be a simple concession to these kind of concerns, in that it can be considered an angular unit and defined appropriately per device or per screen based on typical viewing distance.
c42f
on 22 Mar 2019
To expand on the argument for using an angular unit (or interpreting the DIP as one):
Imagine you're making a presentation for display on a projector, you might guess that people will be 5 m away from the screen, and the correct size in mm (eg, for line width) can then be calculated by knowing the viewing distance and also knowing the size of the projector screen.
But generically written recipes should never care about this kind of calculation because they should work equally well if the display is a handheld device or a normal desktop monitor!
So having thought about the above examples I feel confident that we should not encourage distance units for generic plotting purposes, especially not in generic recipes. We need something like the DIP or equivalent which people are familiar-enough with, but can be consistently interpreted as an angular unit.
Having done that, the size of the DIP on the real physical screen can be scaled as appropriate based on the ratio of the screen width to view distance, and this should be be handled in exactly on place: the screen configuration.
c42f
on 22 Mar 2019
Just specifying marker sizes and line widths in the same unit as the plot fonts is imho transparent and produces expected results. Taking extra steps on considering mean monitor resolution / size / viewing distance seems a bit overengineered to me.
mkborregaard
on 22 Mar 2019
well, what unit will you specify the font size? :D It's currently also in world units...
SimonDanisch
on 23 Mar 2019
Also, any non world unit is difficult for the plotting pipeline right now - but when we solve units, a unit like DIP is trivial ;)
SimonDanisch
on 23 Mar 2019
What units is marker size actually in? It doesn't seem to be data units:
julia> scatter([1, 2], [1, 2], [1, 2], markersize=100)
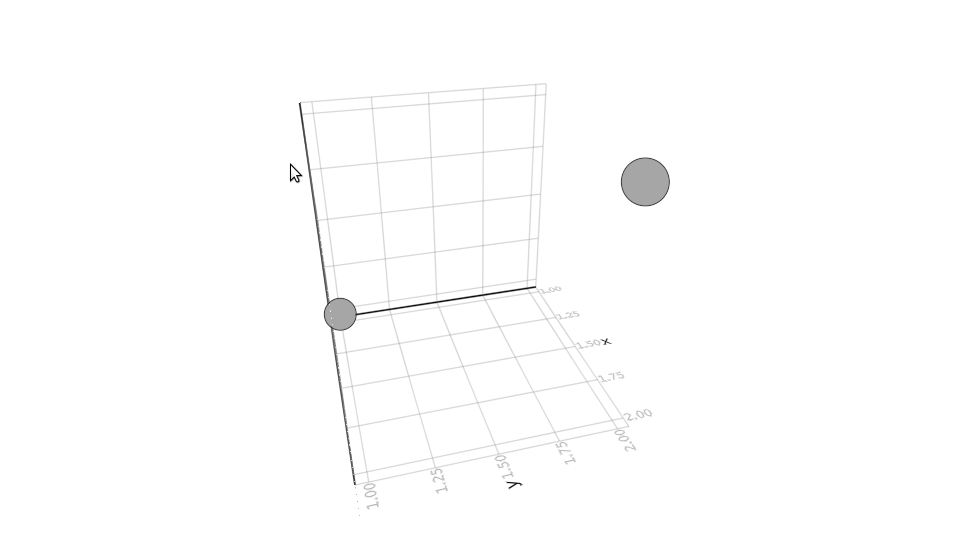
I would have expected that markersize=1 would have given spheres of radius 1 in data units (reaching nearly to the other point), but instead with markersize=1 they are so small you can barely see them. With markersize=100 (100%?) they are still smaller than I expected.
 timholy
on 2 Dec 2020
timholy
on 2 Dec 2020
It's actually in pixel at the moment! You can change it to data units, withmarkerspace=SceneSpace():
http://makie.juliaplots.org/dev/plotting_functions.html#scatter (almost documented 😅 )
SimonDanisch
on 2 Dec 2020
Thanks! But I get this:
julia> SceneSpace()
ERROR: MethodError: no method matching SceneSpace()
Closest candidates are:
  SceneSpace(::T) where T at /home/tim/.julia/packages/AbstractPlotting/Q2ju2/src/units.jl:38
Stacktrace:
 [1] top-level scope at REPL[19]:1
EDIT: seems to work if I leave out the parentheses, though!
timholy
on 2 Dec 2020
Oh woops :D This is a bit of a mess ...
SimonDanisch
on 2 Dec 2020
Related issues
 fa-bien
·
3Comments
fa-bien
·
3Comments
 SebastianM-C
·
3Comments
SebastianM-C
·
3Comments
 chriselrod
·
5Comments
Datseris
·
7Comments
chriselrod
·
5Comments
Datseris
·
7Comments
 grahamas
·
3Comments
grahamas
·
3Comments
Most helpful comment
Just specifying marker sizes and line widths in the same unit as the plot fonts is imho transparent and produces expected results. Taking extra steps on considering mean monitor resolution / size / viewing distance seems a bit overengineered to me.