Possible Inspirations:
matplotlib
@datseris likes:
https://matplotlib.org/api/_as_gen/matplotlib.pyplot.subplot2grid.html
which allows:
ax1 = subplot2grid((2,3), (0,0), colspan = 2, rowspan = 2);
ax2 = subplot2grid((2,3), (2, 0))
ax3 = subplot2grid((2,3), (1, 2))

I'm not a 100% what properties of this are important and considered as nice by @datseris.
Plots.jl
http://docs.juliaplots.org/latest/layouts/#advanced-layouts
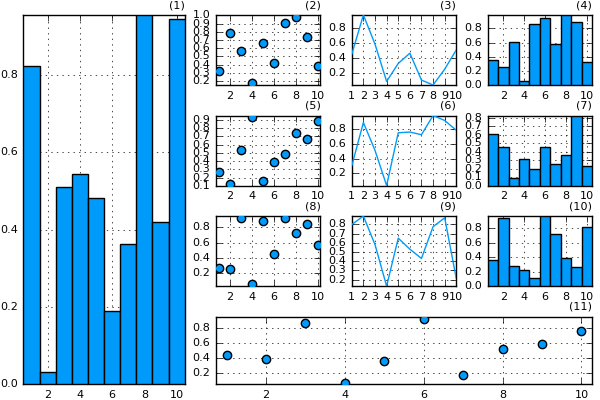
l = @layout [  a{0.3w} [grid(3,3)
                         b{0.2h} ]]
plot(
    rand(10,11),
    layout = l, legend = false, seriestype = [:bar :scatter :path],
    title = ["($i)" for j = 1:1, i=1:11], titleloc = :right, titlefont = font(8)
)
Pros:
- pretty concise syntax
- easy to have one command for multiple subplots for each series
- plots can be first created and then put together in a layout, which makes it possible to compose plots from different sources
Cons:
- i've never fully understood in all cases, how data maps to a series/subplot
- it seems really unnecessary to have this as a macro and I literally always need to look up the syntax
vbox/hbox
I learned to like this one (after an initial disliking by me). It's trivial to remember what it does, and you can compose plots after they got created in a pretty flexible way, especially when we add the ability to define widths for each subscene. I also started estimating sizes of a scene and using that to layout out the plot.
So on Makie master this works:
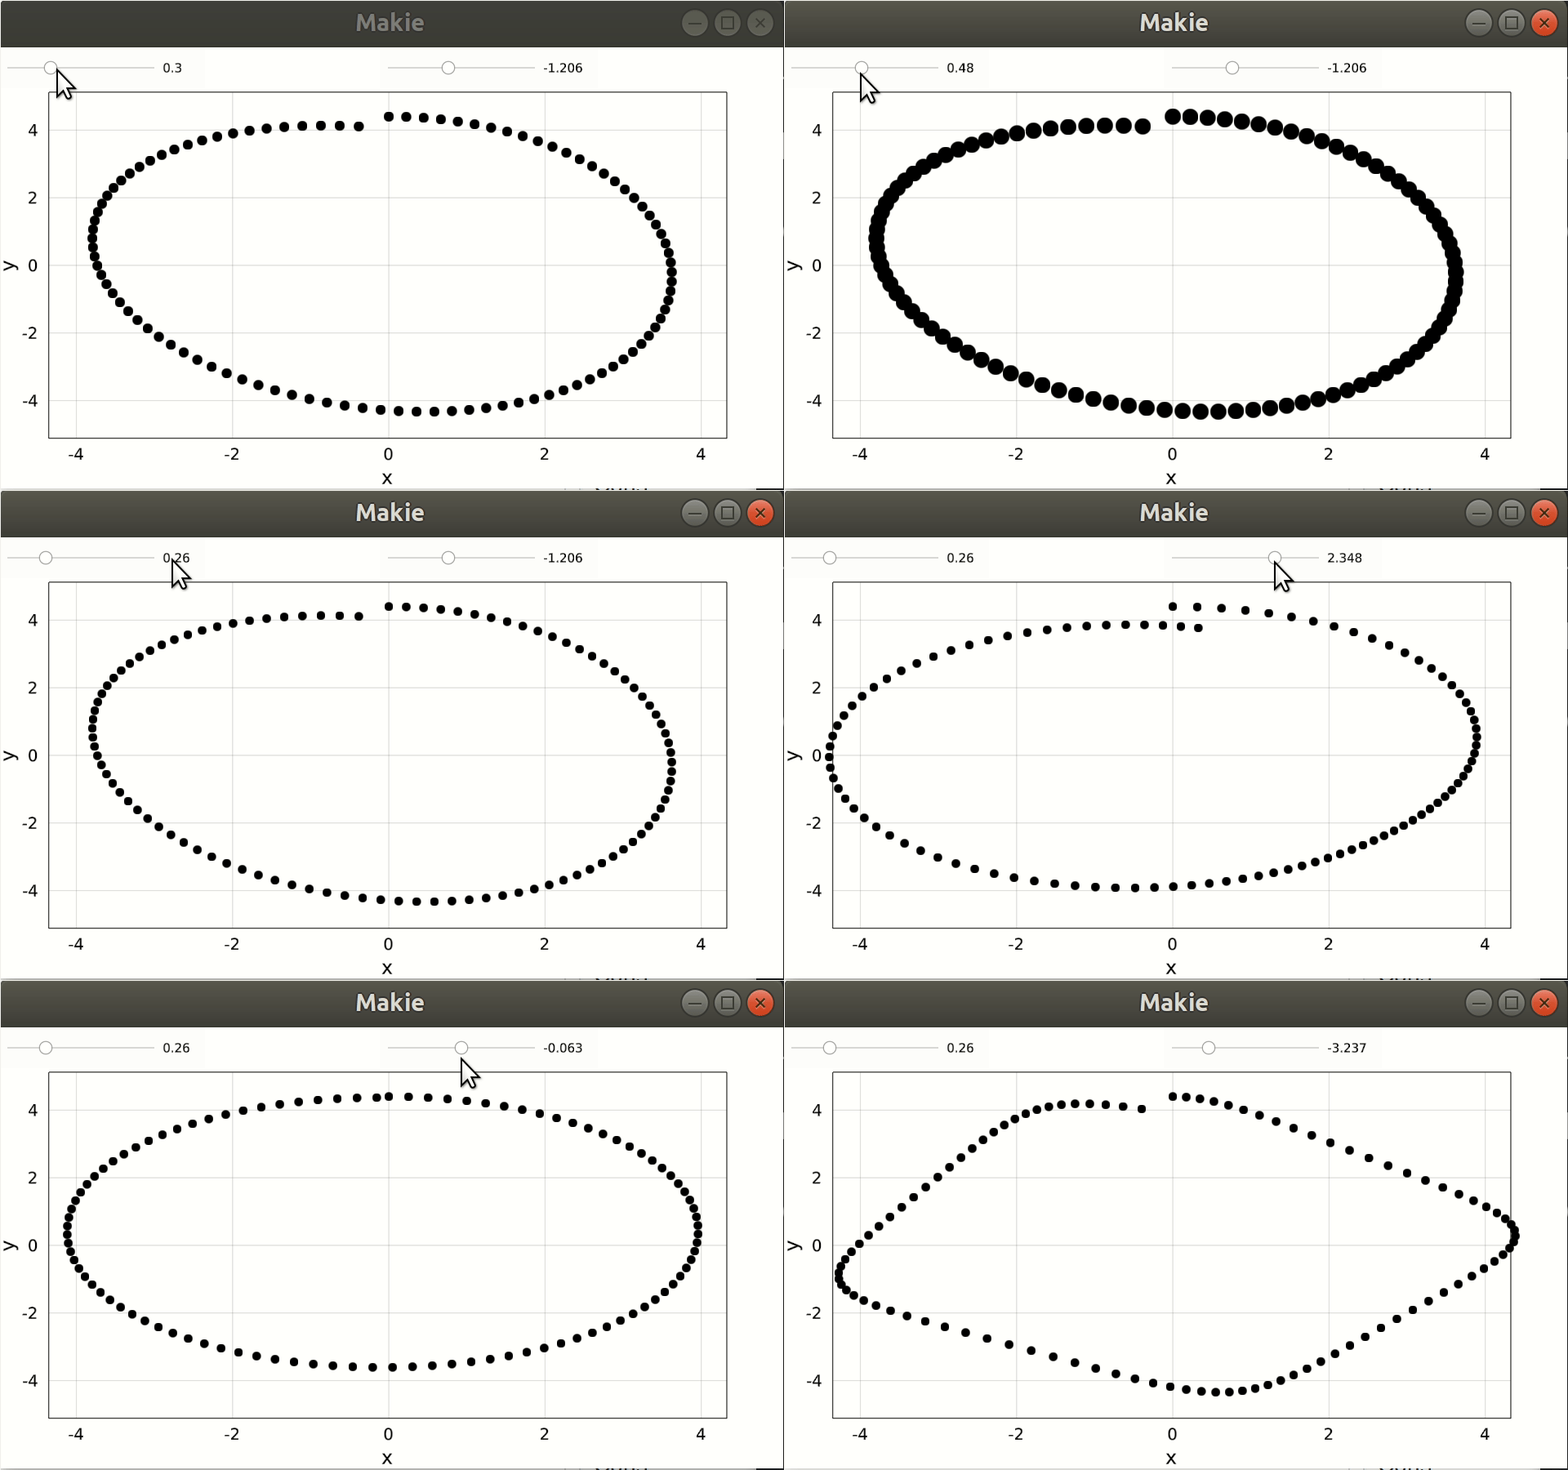
s1 = slider(LinRange(0.01, 1, 100), raw = true, camera = campixel!)
s2 = slider(LinRange(-2pi, 2pi, 100), raw = true, camera = campixel!)
data = lift(s2[end][:value]) do v
    map(LinRange(0, 2pi, 100)) do x
        4f0 .* Point2f0(sin(x) + (sin(x * v) .* 0.1), cos(x) + (cos(x * v) .* 0.1))
    end
end
p = scatter(data, markersize = s1[end][:value])
hbox(p, vbox(s1, s2))
What we can do in Makie
We have roughly 3 ways to layout a graphic in Makie:
- translate/scale/rotate a plot/scene directly to position it
- create a subscene with a static or dynamic size
- resize and position an existing scene
I'd say we use these tools to create more high level layouting functions & recipes, and extend the current vbox + hbox based capabilities
 SimonDanisch
All 34 comments
My "fancy axes" example:

 mschauer
on 23 Oct 2018
mschauer
on 23 Oct 2018
Hello,
so let me simply first try to stress how important this is. If Makie is to become the standard plotting package, in my eyes it should also be the standard _scientific_ plotting package. Most of scientific figures are composed of subplots, you will very rarely encounter a scientific figure to be a single plot of data.
edit: by scientific figures I mean figures used in papers, i.e. publications, not presentations.
Therefore this issue is super important!
The good parts about subplot2grid is that:
- It relies on the intuitive notion of an integer grid, that everyone understands.
- Because all axis are rectangular grids (and polar axis also fit inside rectangles) this allows one to define a very intuitive interface (which is what the function
subplot2gridachieves. - It allows one to plot on each created axis _sequentially_. This is extremely important as 99% percent of your time creating your figure is spent on the code and how you will plot each axis. Being able to see them as you plot them one by one is crucial. For the plots I prepare for e.g. my own publications, the plotting code is ~20 to 50 lines of code for each individual axis, so I really need this sequential plotting.
I am not familiar with the @layout approach, but it seems to have the same end result as subplot2grid. However, I do not know whether it allows you to plot axis sequentially. (Definitely not in the example you posted).
I still think combinations of hbox and vbox is not the way to go for the end-user. The complication and amount of times you would have to call each function is simply too much.
Let's take the following case: I want to create a big 2x2 axis in the center of my figure, and to the left and right of it 4 1x1 axis. In PyPlot (subplot2grid) this is:
figure(figsize = (10, 5))
axbig = subplot2grid((2,4), (0,1), colspan = 2, rowspan = 2)
ax1 = subplot2grid((2,4), (0,0))
ax2 = subplot2grid((2,4), (1,0))
ax3 = subplot2grid((2,4), (0,3))
ax4 = subplot2grid((2,4), (1,3))
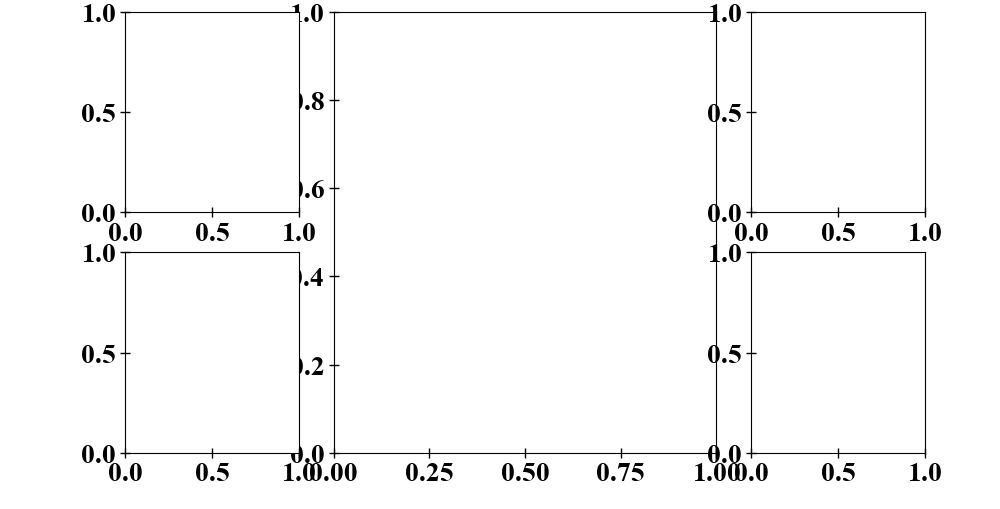
and I can plot to any of the ax variables in any sequence I want, and even go back and forth, e.g. add a line in axbig, then add a line in ax1 then add a line back into axbig. This interactiveness is crucial for a fast workflow.
Is the above possible with hbox+vbox combinations? If yes, how easy is it?
 Datseris
on 24 Oct 2018
Datseris
on 24 Oct 2018
In Plots you'd do
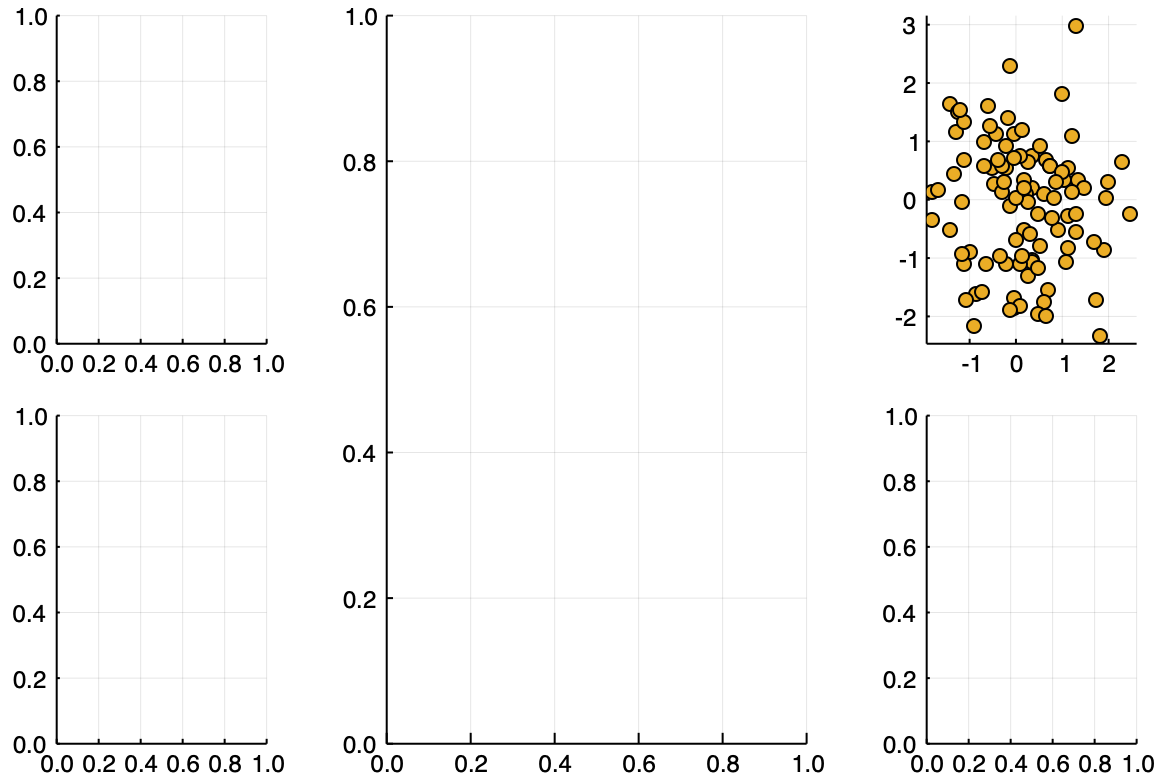
plot(layout = @layout [grid(2,1) a{0.5w} grid(2,1)])
to get that grid. And you can fill each of the subplots sequentially by specifying the subplot
scatter!(randn(100), randn(100), subplot = 4, legend = false)
 mkborregaard
on 24 Oct 2018
mkborregaard
on 24 Oct 2018
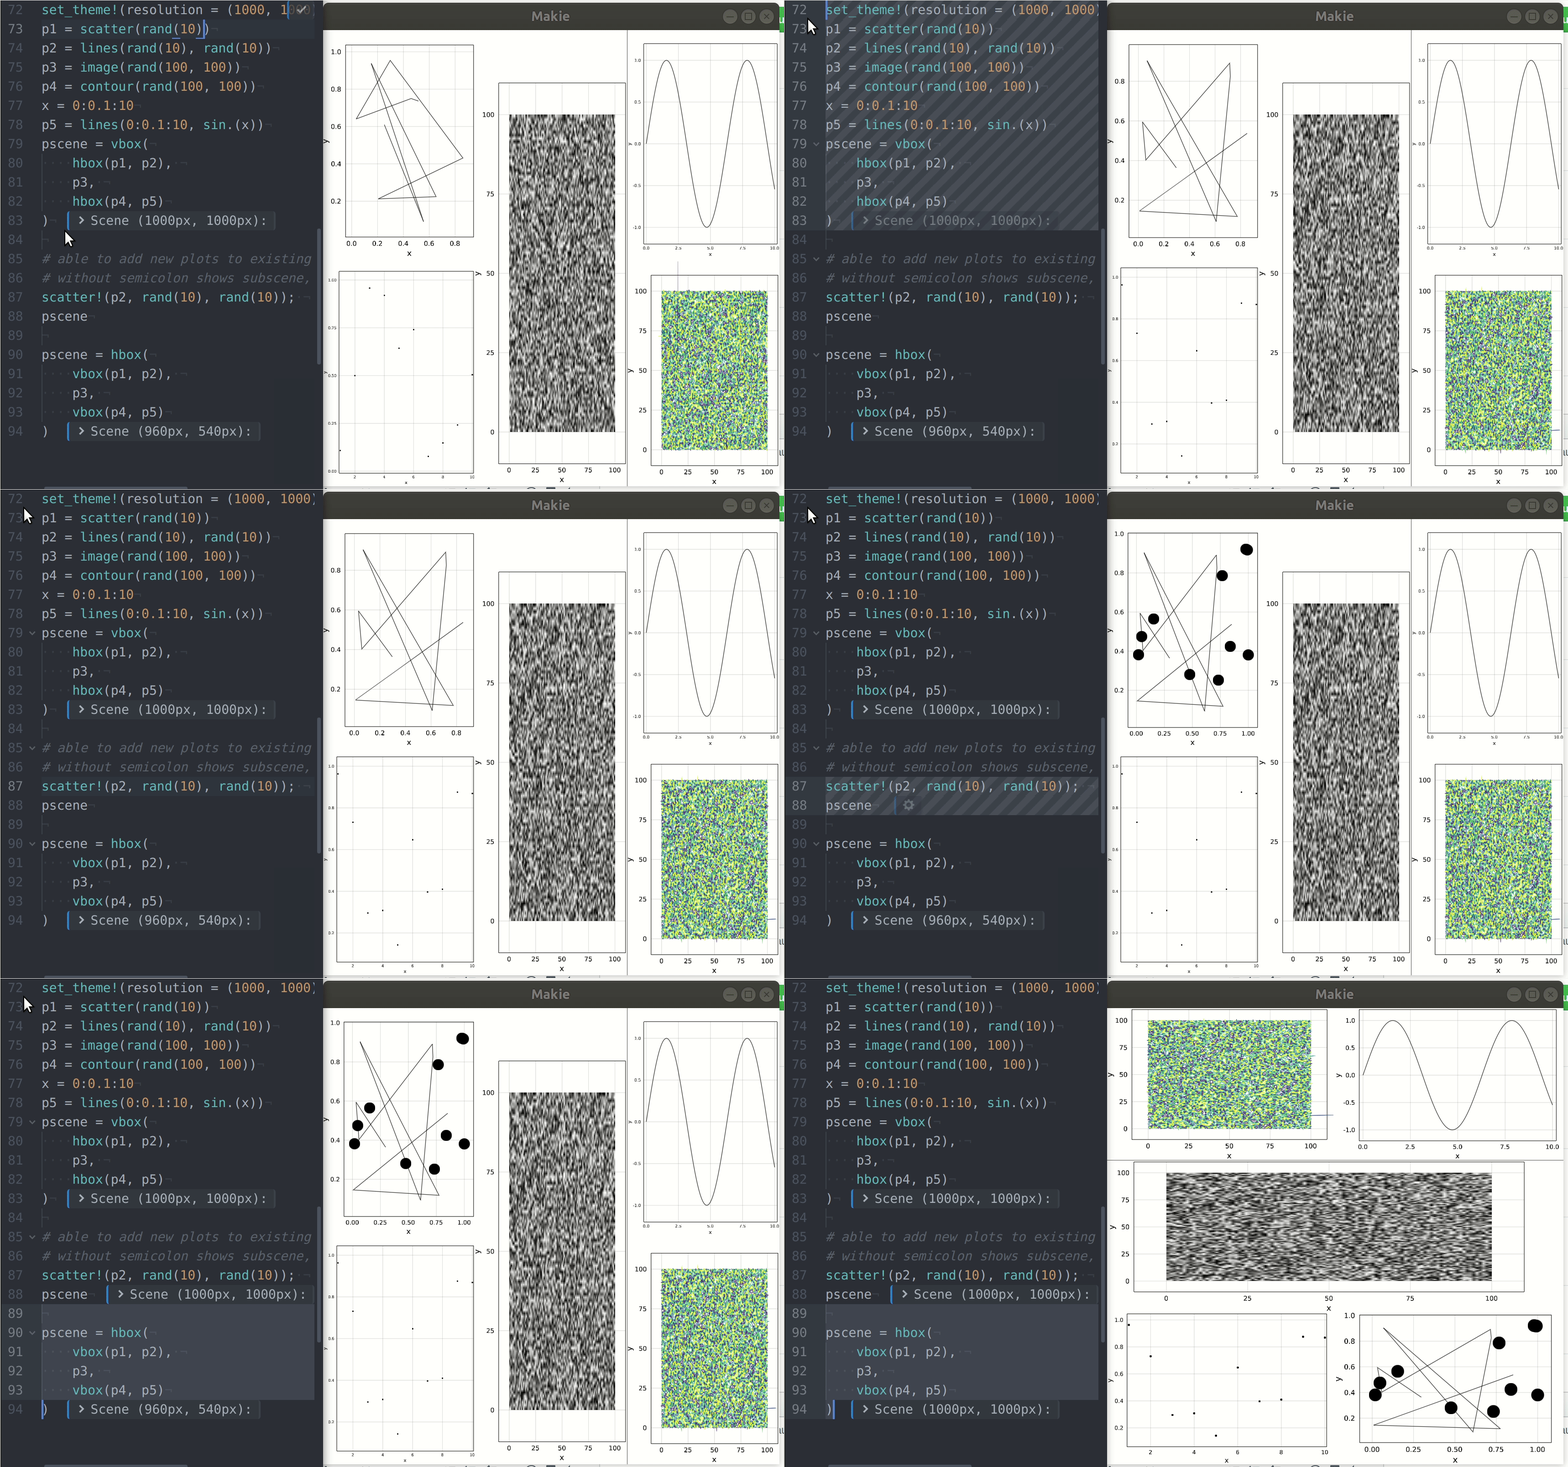
Here is the version with vbox/hbox:
p1 = scatter(rand(10))
p2 = lines(rand(10), rand(10))
p3 = image(rand(100, 100))
p4 = contour(rand(100, 100))
x = 0:0.1:10
p5 = lines(0:0.1:10, sin.(x))
pscene = vbox(
hbox(p1, p2),
p3,
hbox(p4, p5)
)
# able to add new plots to existing ones
# without semicolon shows subscene, which messes things up :D
scatter!(p2, rand(10), rand(10));
pscene
# You can also combine the subplots in new layouts:
pscene = hbox(
vbox(p1, p2),
p3,
vbox(p4, p5)
)
SimonDanisch
on 25 Oct 2018
Okay, _provided that_ vbox, hbox will be accepting width/height span keywords in the future, then this can also achieve the same results without additional verbosity. At the moment I don't see how you can make the middle plot have double width.
Another thing I noticed: the middle plot has incorrect axis spanning, i.e. it is shorter than the other 2 hboxes.
Datseris
on 25 Oct 2018
yeah, and the font sizes are messed up^^ needs some fixing here and there!
SimonDanisch
on 25 Oct 2018
That's nice too. Does it also support fancier layouts with overlays, different heights and widths etc?
I guess you can specify a layout in a recipe easily enough too?
mkborregaard
on 25 Oct 2018
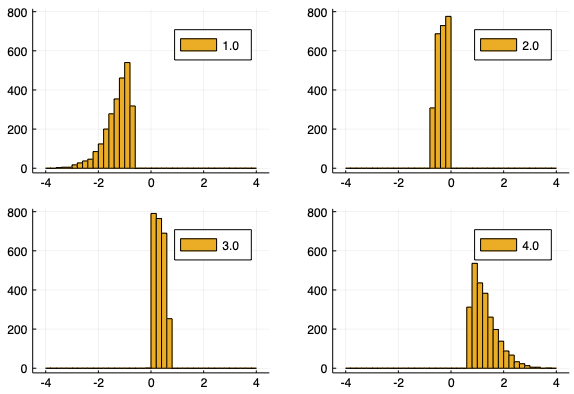
One thing that it is very useful for the layouting api to support is facets, e.g. automatically generating subplots based on grouping and layouting them, with the ability to share axis values, color scale etc. Example with Plots:
x = randn(10000);
histogram(x, group = SpatialEcology.asquantiles(x, 4), layout = 4, link = :all, bins = -4:0.2:4)
mkborregaard
on 25 Oct 2018
Does it also support fancier layouts with overlays, different heights and widths etc?
As I said you have total freedom in Makie:
- translate/scale/rotate a plot/scene directly to position it
- create a subscene with an arbitrary static or dynamic size
- resize and position an existing scene
Will be a bit of work to implement all the higher level features like linking axis etc ;)
SimonDanisch
on 25 Oct 2018
There is somewhat a difference between putting things side by side and putting things side by side and also aligning sizes and axes where applicable. Both are useful.
mschauer
on 25 Oct 2018
It would also be nice to have layouting align subplots axis lines within the bounding boxes, if that is possible.
mkborregaard
on 3 Dec 2018
I was wondering what the progress on this last comment it. I am trying to create a figure with 3 bar plots where their x-axis should be shared. Is there currently a way to do that?
 grero
on 20 Dec 2018
grero
on 20 Dec 2018
Alternatively, and more specifically, is there a way to get the bounding box of just the axis, i.e. without axis labels and tick labels? Then I could apply transformations to make sure those were the same size. At least in my usage, it is rarely the case that I want to have differently size texts for the different plots. Thus, it would be cool if transformations could be applied to, in a sense, everything except text. My apologies if this is already documented somewhere.
grero
on 20 Dec 2018
you could actually share the exact axis plot - would that help, or do they need different x-y ranges/ limits?
SimonDanisch
on 20 Dec 2018
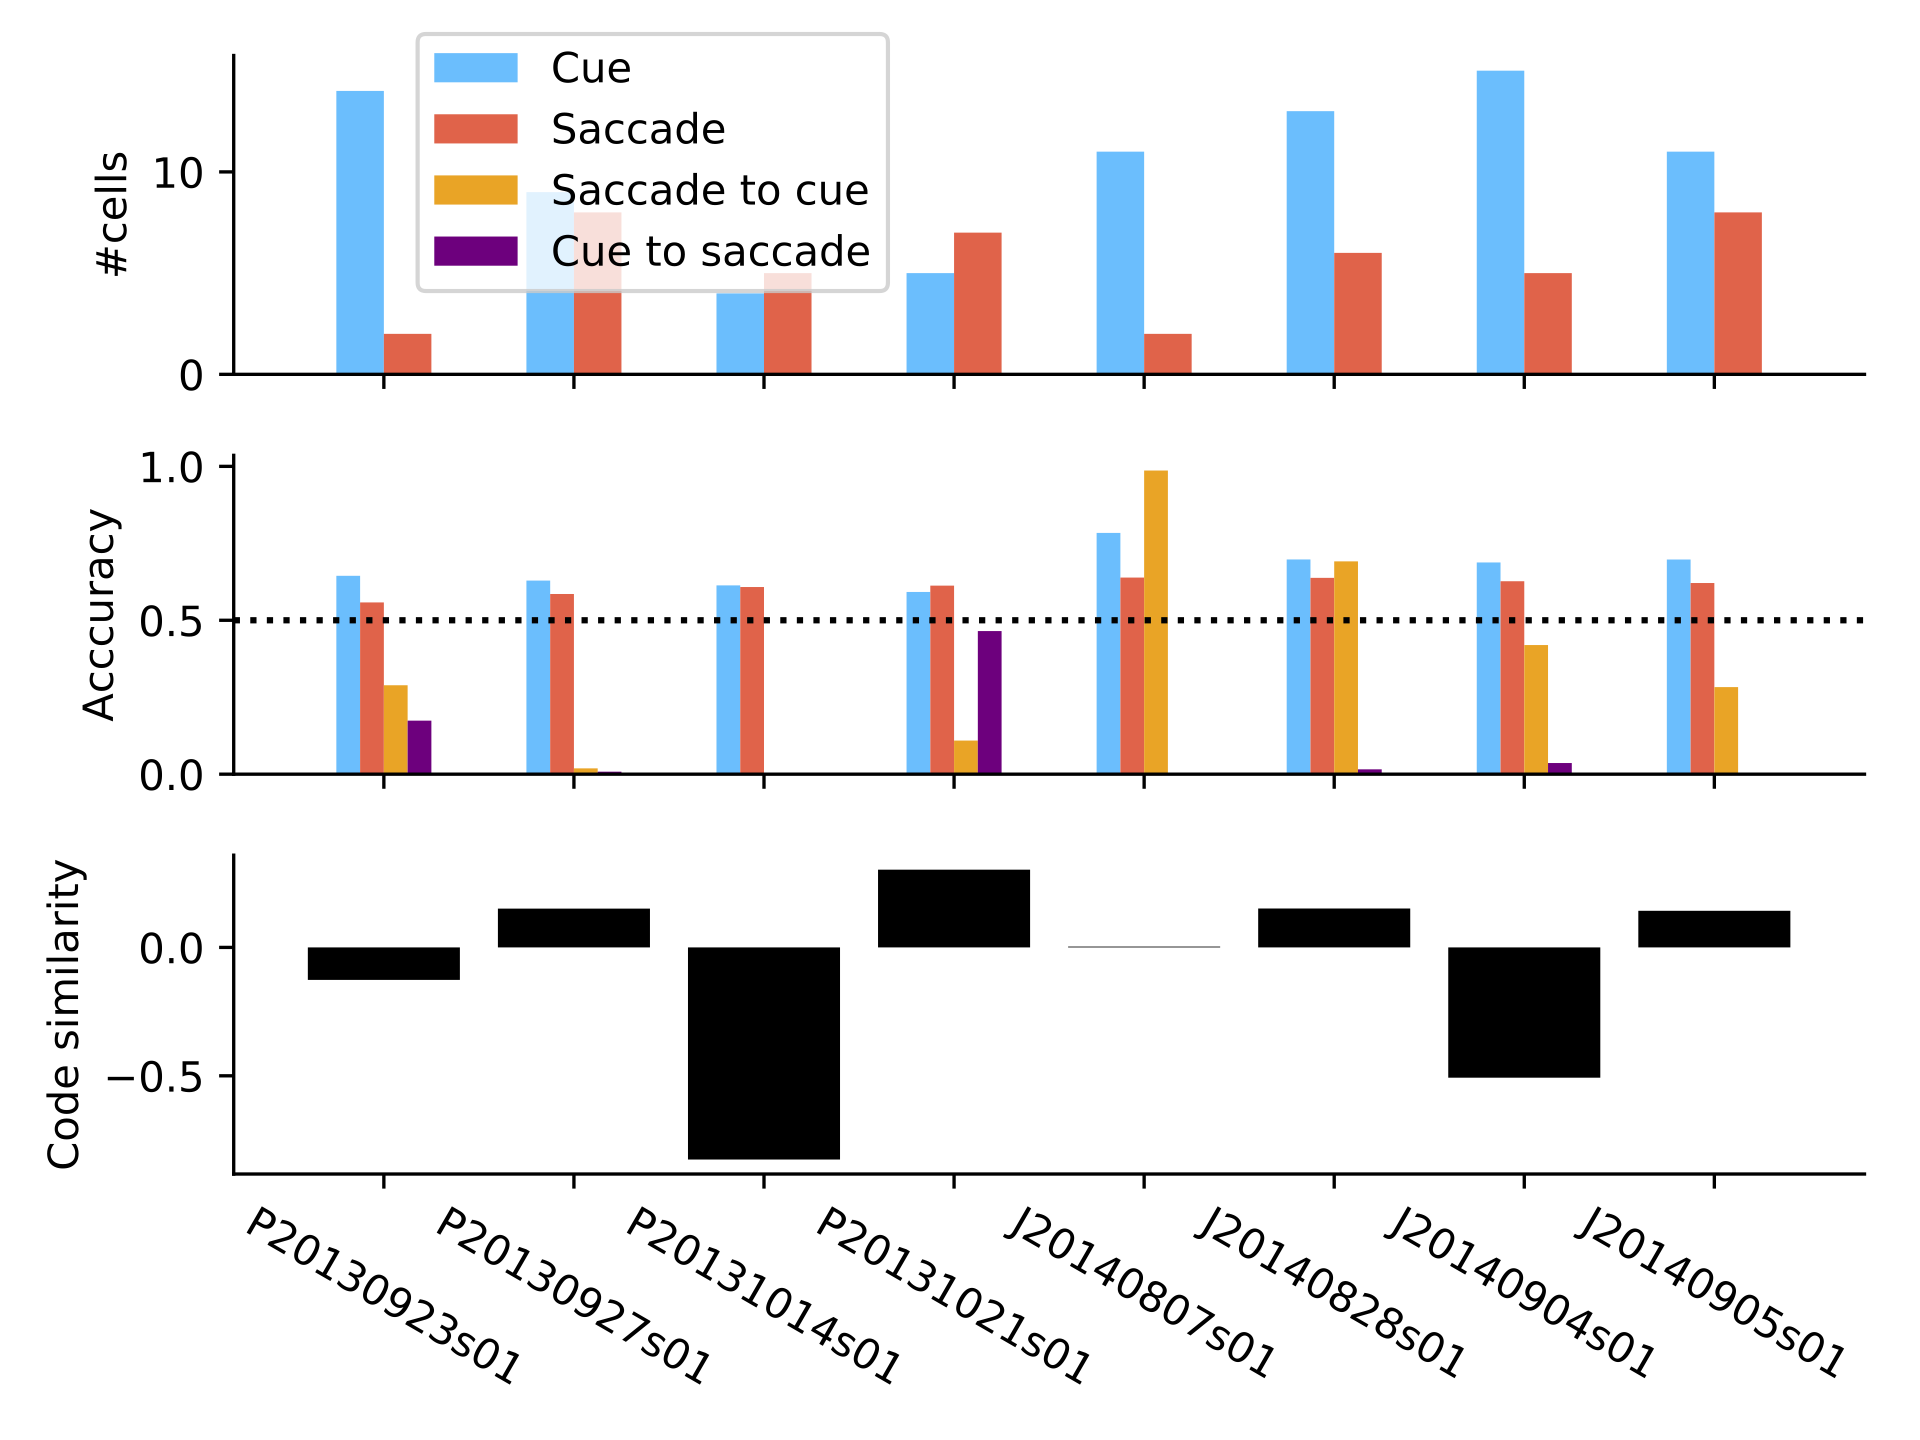
Hm, they could have different y-axis. For reference, this is the kind of plot I'm trying to make (I used PyPlot for this)
grero
on 20 Dec 2018
hm, I need to figure out what to do with textsize...maybe there is a simple fix we can do, to just improve the textsize issue ;)
SimonDanisch
on 20 Dec 2018
Ideally pyplot above should not move the axis text left on the bottom plot :-)
mkborregaard
on 20 Dec 2018
Hm, I would say that the axis texts on the top two plots should be move left to match with the text on the bottom plot. That's what I would do manually to this plot, anyway. That's a minor concern, though : ). Basically, if the axes themselves could be aligned, that would be an improvement. Tweaking the text could be left for later, at least as a first pass.
grero
on 21 Dec 2018
I'm poking around the code a bit to try and understand how the text is positioned, but I'm not having much luck. Is it possible to not transform (scale) the text at all? So if I specify text size as e.g. 10, that 10 means 10 pts, irrespective of any transformation applied to the data to make it fit in the window. I apologise for not having anything more constructive to offer here.
grero
on 31 Jan 2019
I am still playing around with this, trying to get things to align properly. I came up with this example to illustrate what I am hoping to achieve:
using AbstractPlotting, Makie
function plot_figure(scene=Scene())
margins = map(pixelarea(scene)) do hh
xmargin = 0.05*hh.widths[1]
ymargin = 0.05*hh.widths[2]
Point2f0(xmargin, ymargin)
end
area1 = map(pixelarea(scene)) do hh
xmargin = margins[][1]
ymargin = margins[][2]
height = (hh.widths[2]-2*ymargin)/2
width = (hh.widths[1]-2*xmargin)
IRect(xmargin, ymargin+height, width, height)
end
area2 = map(pixelarea(scene)) do hh
xmargin = margins[][1]
ymargin = margins[][2]
height = (hh.widths[2]-2*ymargin)/2
width = (hh.widths[1]-2*xmargin)/2
IRect(xmargin, ymargin, width, height)
end
area3 = map(pixelarea(scene)) do hh
xmargin = margins[][1]
ymargin = margins[][2]
height = (hh.widths[2]-2*ymargin)/2
width = (hh.widths[1]-2*xmargin)/2
IRect(xmargin+width, ymargin, width, height)
end
scene1 = Scene(scene, area1)
scene2 = Scene(scene, area2)
scene3 = Scene(scene, area3)
x = range(0.0, stop=4*pi,length=100)
y = sin.(x)
lines!(scene1, x, y)
lines!(scene2, x[1:50], y[1:50])
lines!(scene3, x[51:end], y[51:end])
scene
end
plot_figure()
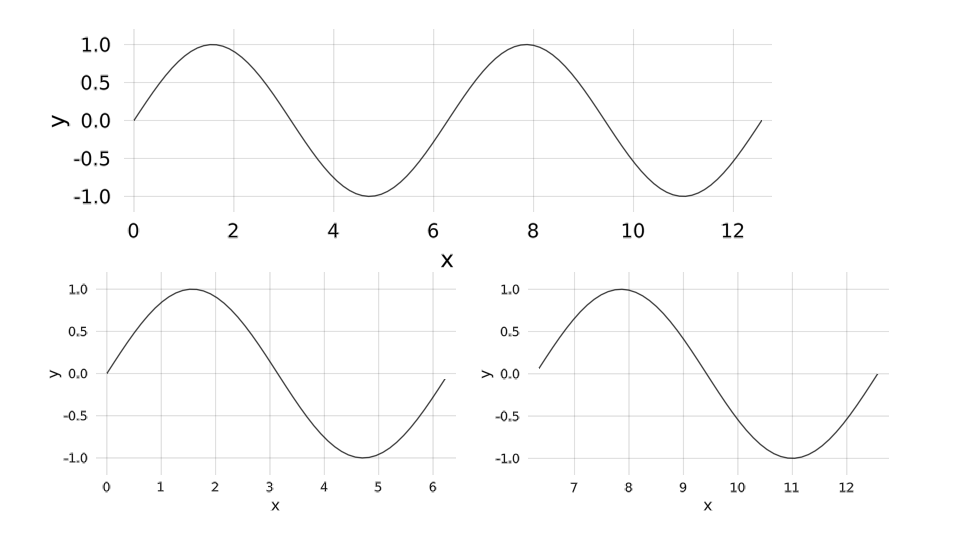
One question I have is why are the widths of the two rows not the same? My idea was to leave a 5% margin on all sides, and then have each plot fill out the rest according to it area specification. My suspicion is that the axis itself takes up some of that area, which is probably why the areas don't match. Is there anyway to amend this example to get a good alignment?
grero
on 24 May 2019
Yes it looks like the box aligns along the axis but the margins have different sizes. I think that's because the bottom two subplots don't know that they are subplots.
I guess an easy fix would be to have the fonts of all subplots inherit from the font settings of the total layout. That's the preferred default anyway - all fonts in the same layout should be the same by default - and would fix the axis problems in this case.
I guess something a little more explicit would be needed to make it possible to align axis ticks across x and y axes among the subplots.
A different issue is what to do for aligning axes when some of the subplots have legends outside the plot area, so that the plot area differs among subplots.
mkborregaard
on 24 May 2019
Aren't font sizes generally in data coordinates?
 asinghvi17
on 24 May 2019
asinghvi17
on 24 May 2019
I hope not?
mkborregaard
on 24 May 2019
I know that, as Simon has stated before, every element of a scene can be scaled, rotated and translated at will, so in principle it should be possible to align everything perfectly, albeit with some manual work. I don't mind doing this manual work for now. In fact, even with the excellent matplotlib package for Python, I frequently find myself manually tweaking things like axes.position, etc. I have, however, not been able to decipher how I can do something similar in Makie. Transforming a scene is fairly easy, of course, and can usually be achieved by something like scale!(scene, scale_factor), but how do I transform individual elements within a scene, e.g. just the left axis, or just the text? Thanks again!
grero
on 25 May 2019
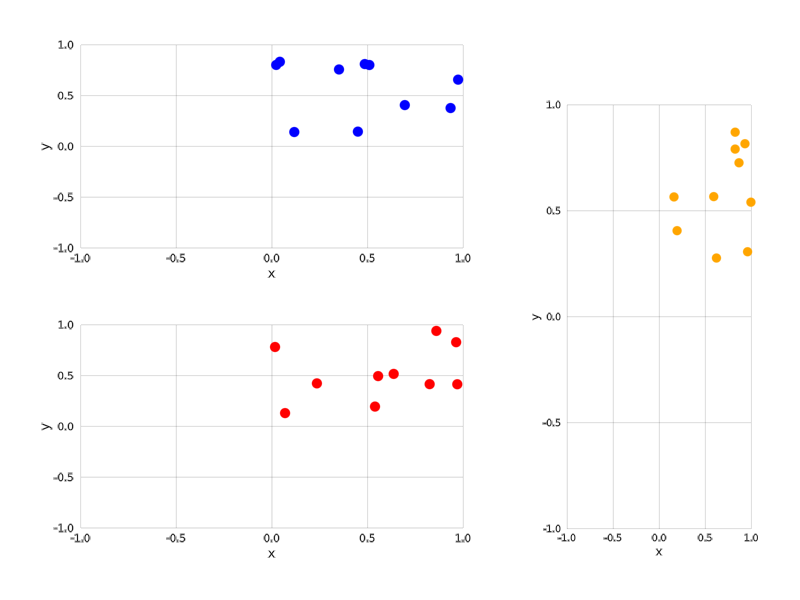
Not sure if this warrants a separate issue, so I'll just add it here for now. I was trying (yet again) to align some plots and I came across an apparent bug where scenes would not fill out the entire area allotted to them. The following example illustrates the point. Notice that the height in pixels of the scene in the second column is equal to the height of the two scenes in the first column, plus a padding value between them, but in the resulting plot, the scatter plot in the second column has a smaller height than the two scatter plots in the first column.
using Makie
import AbstractPlotting: pixelarea
using Test
main_scene = Scene(resolution=(800,600))
_padding = 0.05f0
padding = map(pixelarea(main_scene)) do hh
round(Int64, _padding*maximum(hh.widths))
end
area1 = map(pixelarea(main_scene)) do hh
pad = padding[]
w = 2*div(hh.widths[1]-3*pad,3)
h = div(hh.widths[2]-3*pad,2)
FRect(Point2f0(pad, pad), Point2f0(w,h))
end
area2 = map(pixelarea(main_scene)) do hh
pad = padding[]
w = 2*div(hh.widths[1]-3*pad,3)
h = div(hh.widths[2]-3*pad,2)
FRect(Point2f0(pad, h+2*pad), Point2f0(w,h))
end
area3 = map(pixelarea(main_scene)) do hh
pad = padding[]
w = div(hh.widths[1]-3*pad,3)
h = hh.widths[2] - 2*pad
FRect(Point2f0(2*w+2*pad, pad), Point2f0(w,h))
end
@test area1[].widths[2] + area2[].widths[2] + padding[] ≈ area3[].widths[2]
scene1 = Scene(main_scene, area1)
scene2 = Scene(main_scene, area2)
scene3 = Scene(main_scene, area3)
scatter!(scene1, rand(10), rand(10),color="red")[end]
scatter!(scene2, rand(10), rand(10), color="blue")[end]
scatter!(scene3, rand(10), rand(10), color="orange")[end]
for scene in [scene1, scene2, scene3]
AbstractPlotting.update_limits!(scene, FRect(Point2f0(-1.0, -1.0), Point2f0(2.0, 2.0)))
end
main_scene
grero
on 19 Aug 2019
@grero you could try to fix the areas of the Scenes through the resolution keyword?
asinghvi17
on 22 Aug 2019
About the transformation of individual things in the Axis - I don't think that level of granular control is possible because of how the axes are drawn - all text is linked to one "plot".
asinghvi17
on 22 Aug 2019
all text is linked to one "plot".
How?
SimonDanisch
on 22 Aug 2019
Axis text is linked to one textbuffer right?
asinghvi17
on 22 Aug 2019
Ah, but each axis has their own textbuffer!
SimonDanisch
on 22 Aug 2019
Right, but I can't translate the left label individually, for example - that would require a refactor.
asinghvi17
on 23 Aug 2019
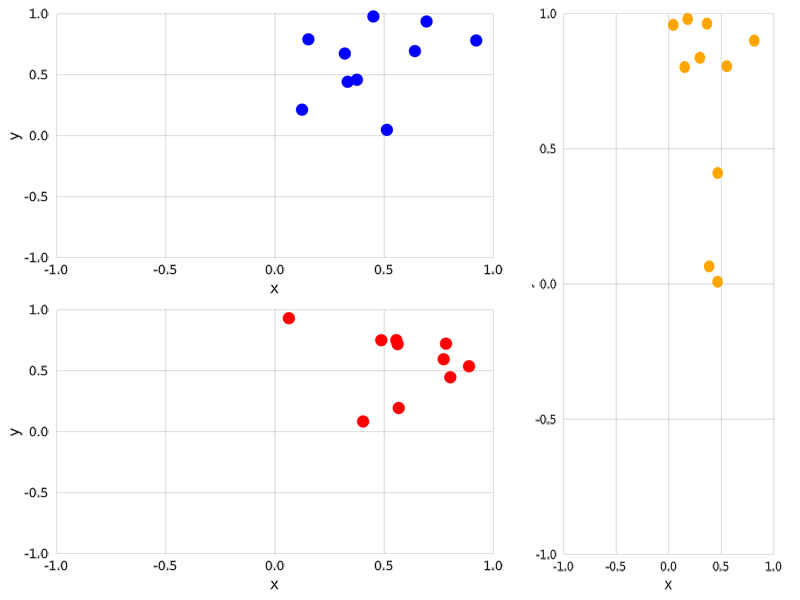
Just an update on my previous attempts. I did manage to scale the panels the way I wanted to, but I had to go down a pretty deep rabbit hole to get there. The code for the figure is here.
include("src/test1.jl")
scene = test2()
Is there a way to achieve the same thing using higher level functions? Specifically, I ended up manually adjusting the camera for the tall panel, using the ratio of the heights of the pixelarea for the tall and short panels. This still didn't quite get me there, which is why there is a fudge factor of 0.98 that I needed to include.
grero
on 29 Aug 2019
Not yet, we don't have quite that level of axis control. Part of the problem is that the axes are baked into dataspace. @SimonDanisch, could we explore the idea of the axis as a special subscene, which exists at the pixel level (i.e., is a "pixel child" of the parent Scene, and just draw to that canvas? It would allow precise bounding boxes and positions to be calculated so as to align axes, and we could link the tick optimization code to that, possibly leading up to an implementation of the link kwarg.
asinghvi17
on 9 Oct 2019
We have high level layouting working in https://github.com/jkrumbiegel/MakieLayout!
asinghvi17
on 4 Nov 2019
Related issues
 chriselrod
·
5Comments
chriselrod
·
5Comments
 DoktorMike
·
6Comments
DoktorMike
·
6Comments
 ashwani-rathee
·
6Comments
ashwani-rathee
·
6Comments
 daviehh
·
3Comments
Datseris
·
7Comments
daviehh
·
3Comments
Datseris
·
7Comments
Most helpful comment
Just an update on my previous attempts. I did manage to scale the panels the way I wanted to, but I had to go down a pretty deep rabbit hole to get there. The code for the figure is here.
Is there a way to achieve the same thing using higher level functions? Specifically, I ended up manually adjusting the camera for the tall panel, using the ratio of the heights of the pixelarea for the tall and short panels. This still didn't quite get me there, which is why there is a fudge factor of 0.98 that I needed to include.
