Machinelearning: Graphs/Plots of Evaluation Metrics
It would be beneficial to have some kind of plotting mechanism of sorts to display evaluation metrics after training.
- Confusion matrix
- ROC graph
- Precision-recall graph
It would also be neat to have a default ToString() method to output the metrics object to the console.
 aslotte
All 3 comments
@aslotte - Agree. We're currently working on Jupyter support for .NET and ML.NET.
Here you can see a few 'sneak-peak' screenshots.. :)
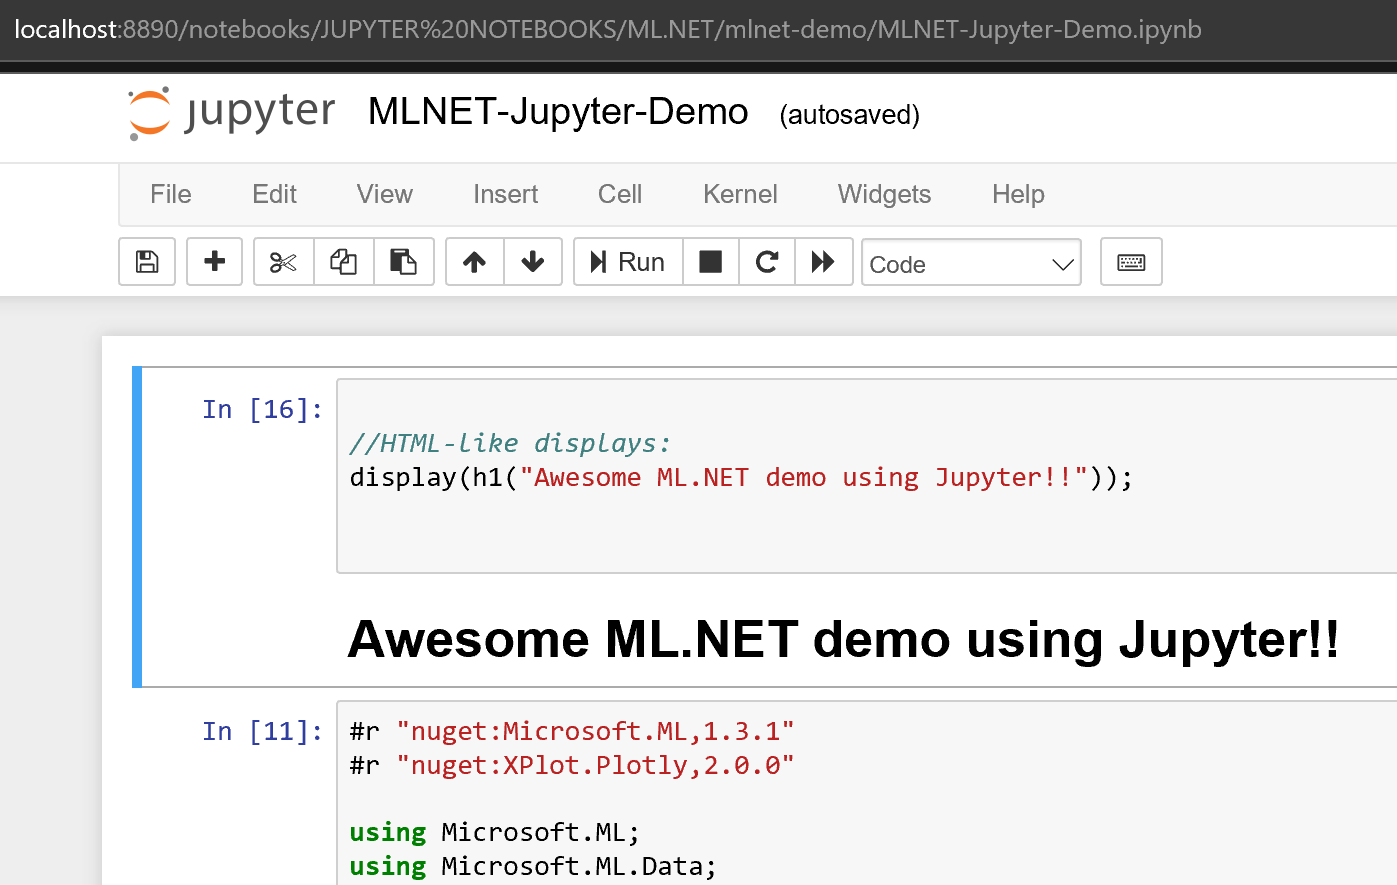
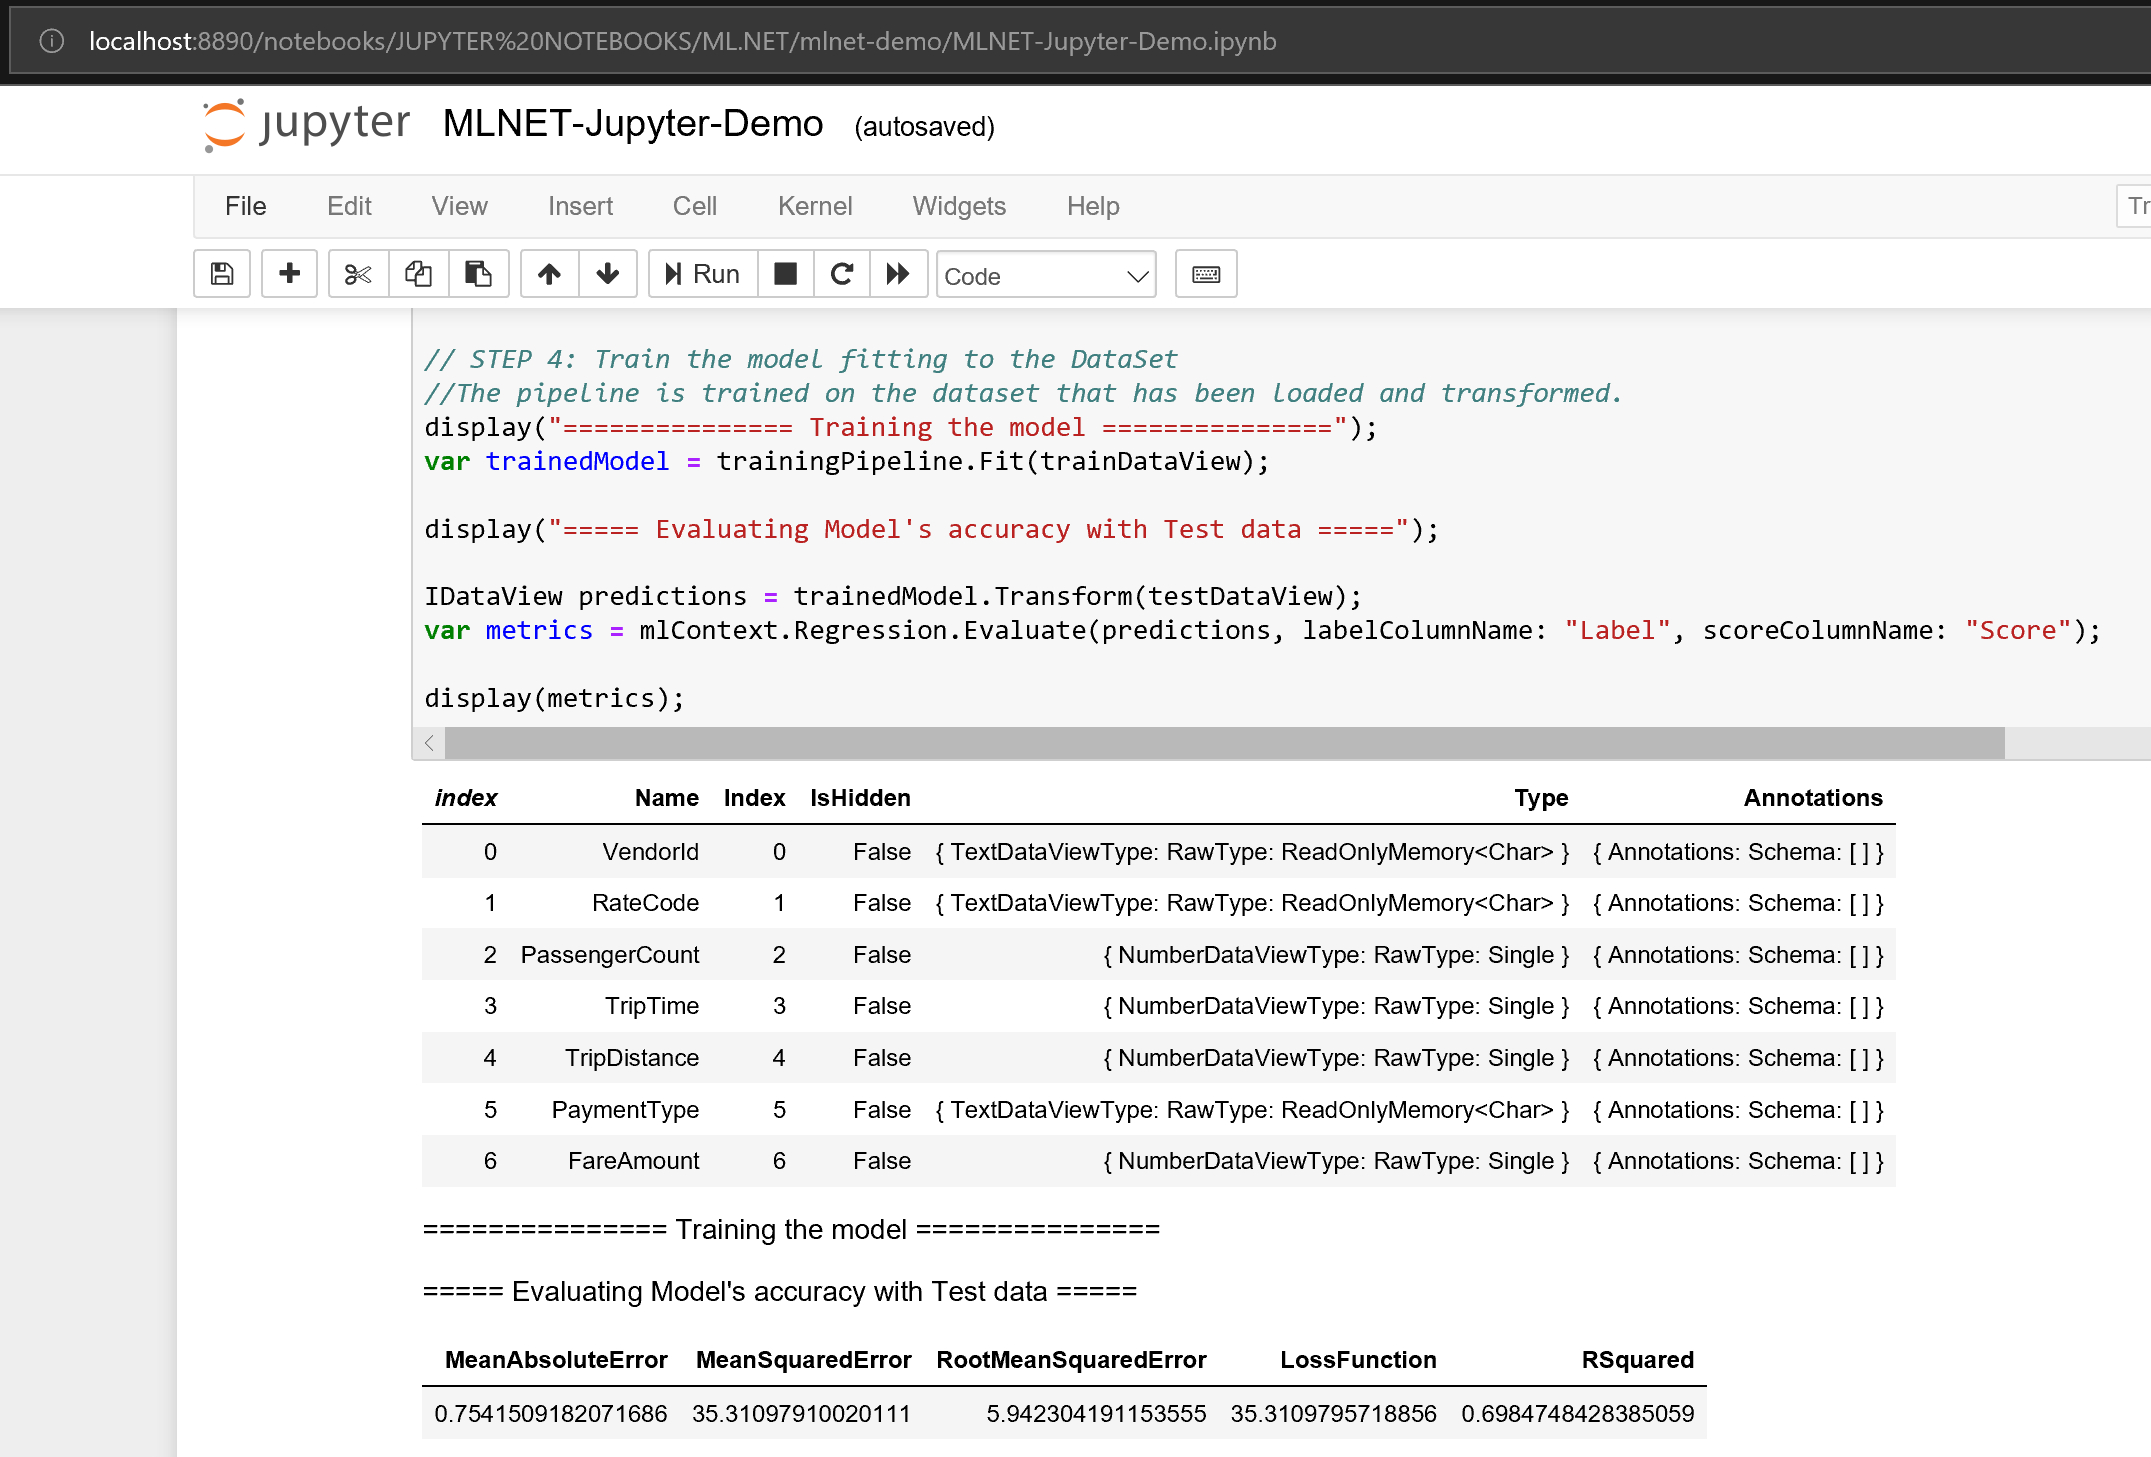
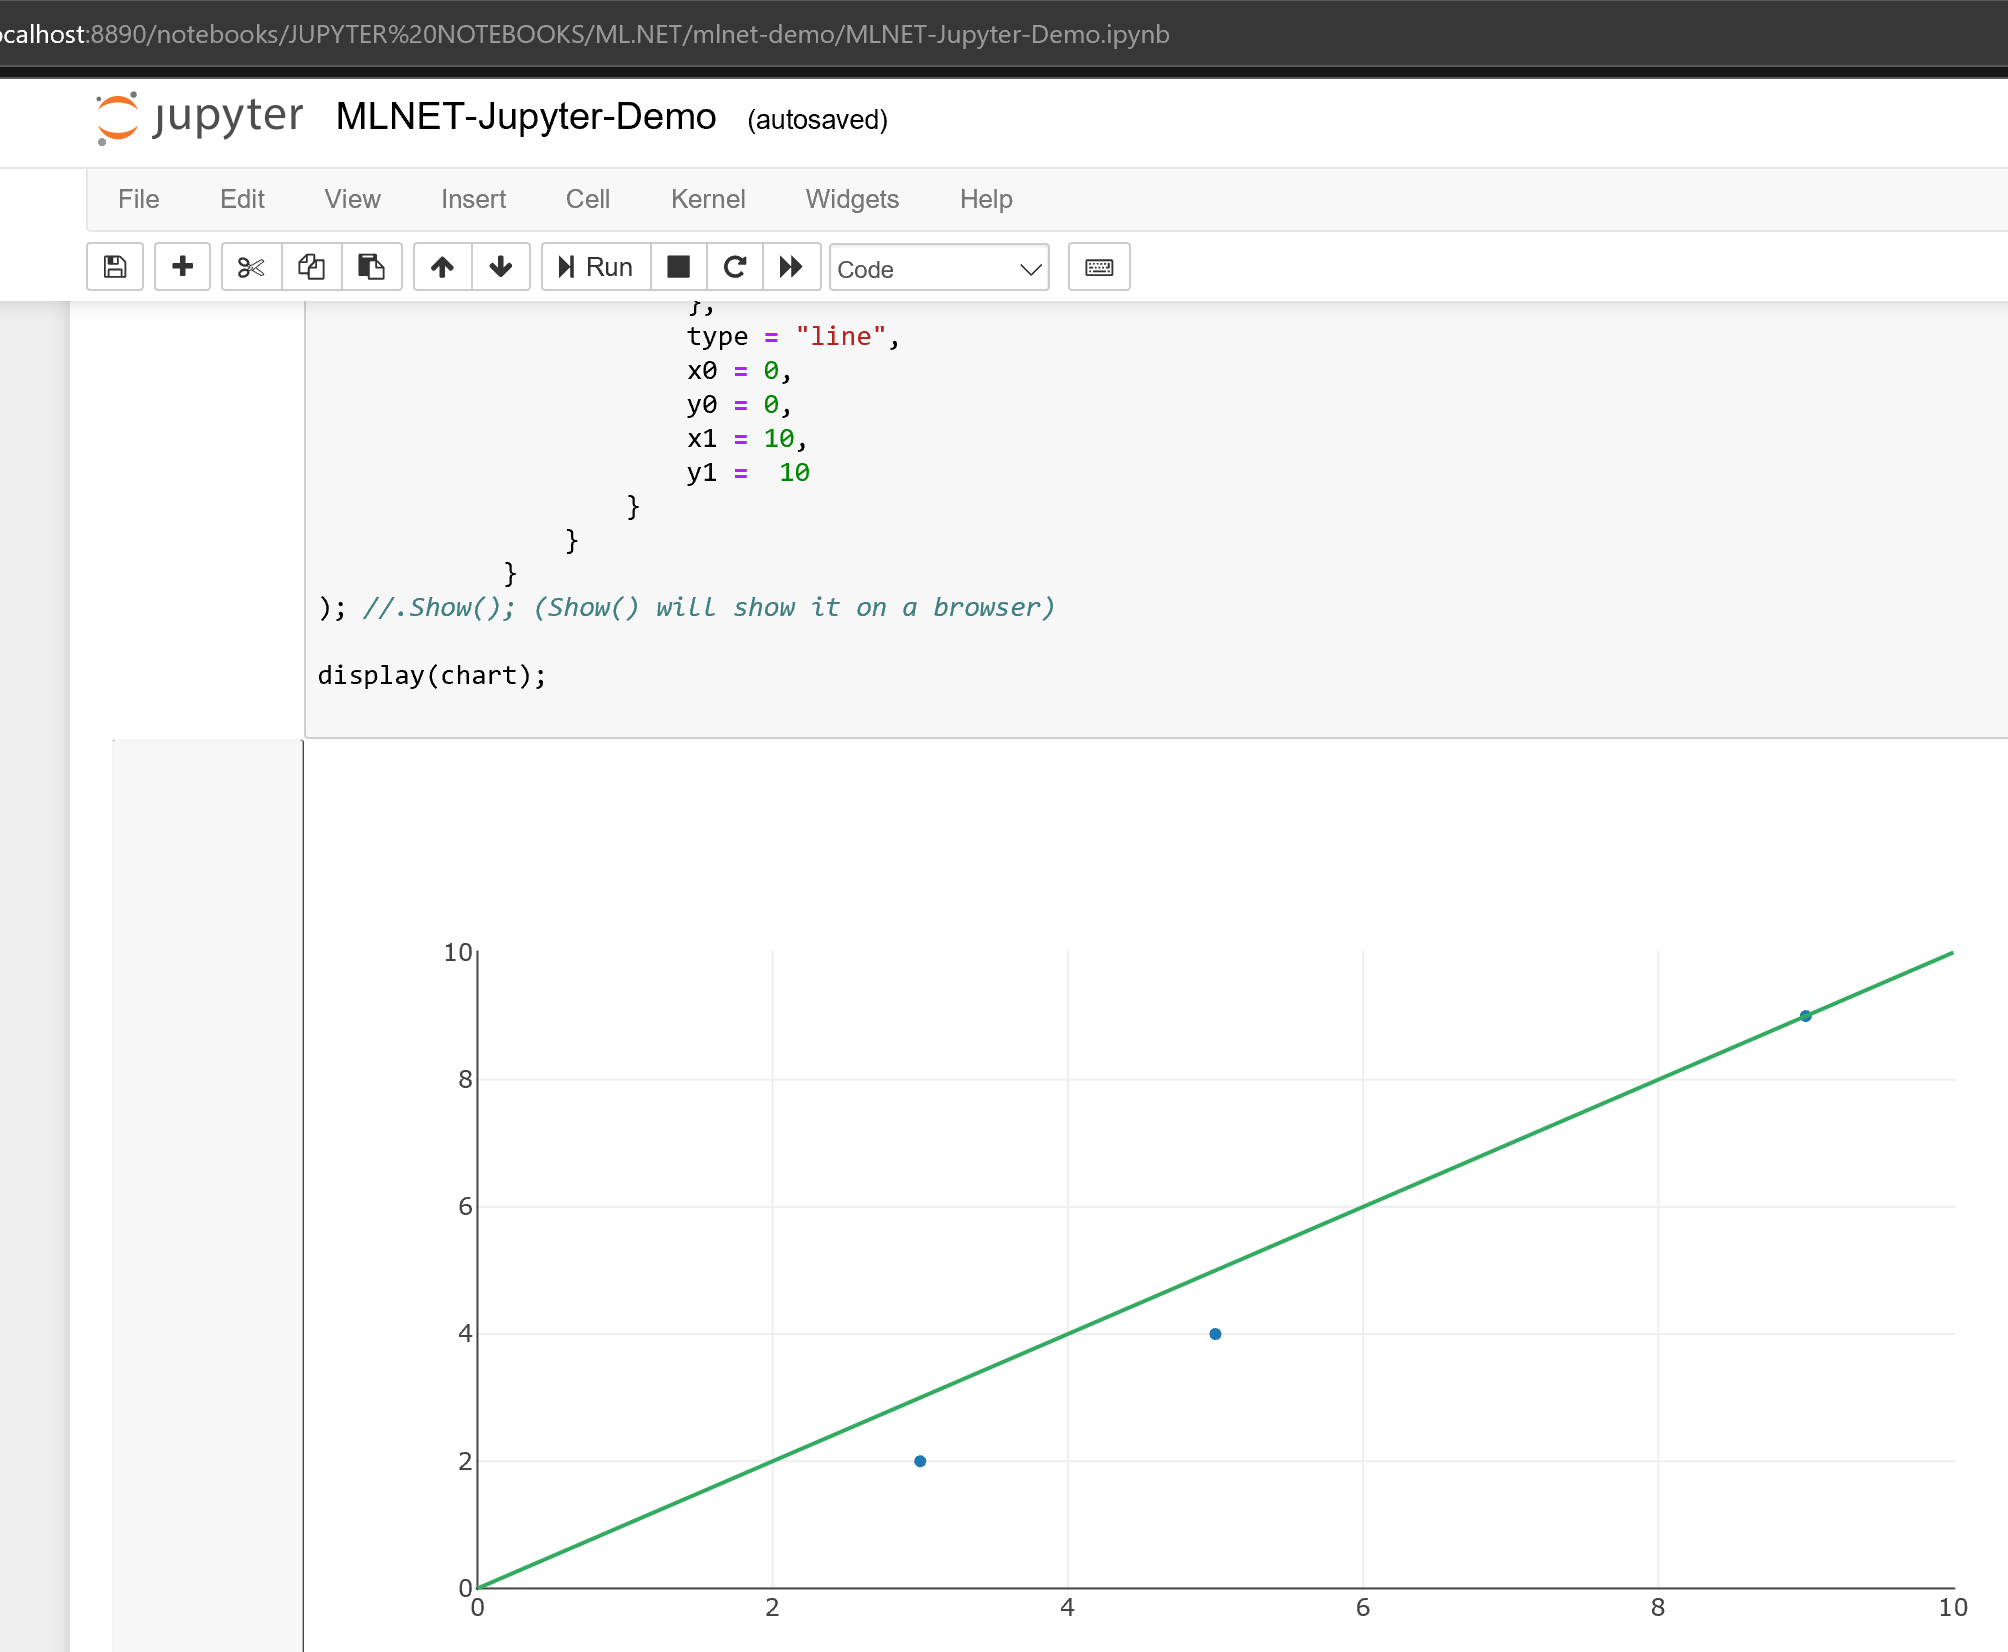
Also plotting with XPlot within the Jupyter notebook.
 CESARDELATORRE
on 12 Sep 2019
CESARDELATORRE
on 12 Sep 2019
❤2
🎉1
@CESARDELATORRE - this made my day, thank you for sharing! :)
aslotte
on 13 Sep 2019
@aslotte I am hoping your question has been answered. I am closing the issue. Please reopen if you need more investigation from our end.
 harishsk
on 9 Jan 2020
harishsk
on 9 Jan 2020
Was this page helpful?
0 / 5 - 0 ratings
Related issues
 lionelquirynen
·
3Comments
lionelquirynen
·
3Comments
 neven10
·
3Comments
neven10
·
3Comments
 maxt3r
·
3Comments
maxt3r
·
3Comments
 rebecca-burwei
·
3Comments
rebecca-burwei
·
3Comments
 JakeRadMSFT
·
3Comments
JakeRadMSFT
·
3Comments
Most helpful comment
@aslotte - Agree. We're currently working on Jupyter support for .NET and ML.NET.
Here you can see a few 'sneak-peak' screenshots.. :)
Also plotting with XPlot within the Jupyter notebook.