Required information
- Distribution: ubuntu
- Distribution version: 16.04.2 server amd64
- The output of "lxc info"
root@wrn-mon2:~# lxc info
config: {}
api_extensions:
- id_map
api_status: stable
api_version: "1.0"
auth: trusted
public: false
environment:
  addresses: []
  architectures:
  - x86_64
  - i686
  certificate: <snip>
  certificate_fingerprint: <snip>
  driver: lxc
  driver_version: 2.0.8
  kernel: Linux
  kernel_architecture: x86_64
  kernel_version: 4.4.0-83-generic
  server: lxd
  server_pid: 27601
  server_version: 2.0.10
  storage: btrfs
  storage_version: "4.4"
Issue description
This seems similar to #2964 - possibly the exact same, if fix isn't in lxd 2.0.10.
lxd is periodically using 100% of one CPU (running on an i3-3220, 2 core / 4 thread)
~~~
root@wrn-mon2:~# top
top - 09:48:00 up 23:02, 1 user, load average: 2.20, 2.67, 2.49
Tasks: 232 total, 1 running, 231 sleeping, 0 stopped, 0 zombie
%Cpu(s): 13.4 us, 3.6 sy, 0.6 ni, 82.2 id, 0.2 wa, 0.0 hi, 0.0 si, 0.0 st
KiB Mem : 4015280 total, 967904 free, 280432 used, 2766944 buff/cache
KiB Swap: 1949692 total, 1948784 free, 908 used. 3305580 avail Mem
PID USER PR NI VIRT RES SHR S %CPU %MEM TIME+ COMMAND
27601 root 20 0 974176 32140 15344 S 106.7 0.8 874:15.64 lxd
1 root 20 0 37868 5952 4072 S 0.0 0.1 0:12.02 systemd
2 root 20 0 0 0 0 S 0.0 0.0 0:00.00 kthreadd
3 root 20 0 0 0 0 S 0.0 0.0 0:03.75 ksoftirqd/0
5 root 0 -20 0 0 0 S 0.0 0.0 0:00.00 kworker/0:0H
~~~
strace doesn't show anything much happening:
~
root@wrn-mon2:~# strace -p 27601
strace: Process 27601 attached
futex(0x110b2c8, FUTEX_WAIT, 0, NULL) = 0
select(0, NULL, NULL, NULL, {0, 100}) = 0 (Timeout)
futex(0x110a700, FUTEX_WAKE, 1) = 0
futex(0x110a650, FUTEX_WAKE, 1) = 1
sched_yield() = 0
futex(0x110a650, FUTEX_WAKE, 1) = 0
futex(0x110b2c8, FUTEX_WAIT, 0, NULL^Cstrace: Process 27601 detached
lxc monitor --type=logging shows only one event then nothing more:
~~~
root@wrn-mon2:~# lxc monitor --type=logging
metadata:
context: {}
level: dbug
message: 'New events listener: e1650ac4-b03d-40ce-b924-9254f89e7264'
timestamp: 2017-06-30T09:48:31.37972554+01:00
type: logging
^C
~~~
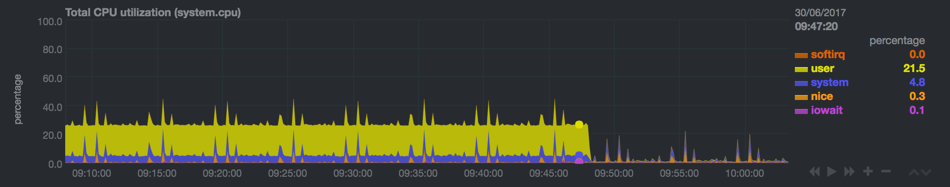
However after doing those tests (and maybe the odd lxc list), CPU load has dropped down to zero again. I wasn't expecting that to happen, so I couldn't say exactly what triggered it, or if it was coincidence.
I wasn't imagining it - here is netdata graph showing CPU before and after.
Steps to reproduce
Not sure. System was freshly installed yesterday; it has only two ubuntu 16.04 containers, both running nagios3.
In fact, it was nagios alerts about high local load average which alerted me to the problem.
Information to attach
[ ] any relevant kernel output (dmesg)
Only this:
[35107.129198] perf interrupt took too long (2506 > 2500), lowering kernel.perf_event_max_sample_rate to 50000[ ] container log (lxc info NAME --show-log)
Problem is not with a specific container
[ ] main daemon log (/var/log/lxd.log)
/var/log/lxd/lxd.logis empty[ ] output of the client with --debug
N/A
[ ] output of the daemon with --debug
I am leaving it running like this now in a
screensession, but CPU load is still back to normal.
 candlerb
All 9 comments
The fix isn't yet in 2.0.10. It will be in 2.0.11. assuming that I'm not mistaken and we've backported a whole bunch of my exec code.
 brauner
on 30 Jun 2017
brauner
on 30 Jun 2017
Thank you.
2964 / #3427 don't appear to have been backported to stable-2.0 yet - last commit to stable-2.0 was on May 24.
candlerb
on 30 Jun 2017
Yeah, I'm quite a bit behind on stable-2.0 backports, it'll get done before 2.0.11 for sure.
 stgraber
on 30 Jun 2017
stgraber
on 30 Jun 2017
FYI: it happened again, and now I can confirm with strace -f -p <pid> that it's the POLLNVAL problem.
~
[pid 10863] <... poll resumed> ) = 1 ([{fd=20, revents=POLLNVAL}])
[pid 10594] <... poll resumed> ) = 1 ([{fd=26, revents=POLLNVAL}])
[pid 10863] poll([{fd=20, events=POLLIN|POLLPRI|POLLERR|POLLHUP|0x2000}], 1, -1
[pid 10594] <... poll resumed> ) = 1 ([{fd=26, revents=POLLNVAL}])
[pid 10863] poll([{fd=20, events=POLLIN|POLLPRI|POLLERR|POLLHUP|0x2000}], 1, -1
~
I did an lxc exec <container> true on each of the containers, and after that the CPU load went back down.
Looking forward to the fix making it to 2.0.x :-)
candlerb
on 6 Jul 2017
Ok, good to know. That patch is in our queue for stable-2.0, so it's going to be in 2.0.11.
stgraber
on 6 Jul 2017
Yeah, quite happy that I caught that one.
brauner
on 6 Jul 2017
When we can expect 2.0.11 to be released?
 stamster
on 26 Jul 2017
stamster
on 26 Jul 2017
Hopefully about two weeks from now, but I still have hundreds of commits to go through and cherry-pick, so that may delay things a bit...
stgraber
on 26 Jul 2017
Finally - 2.0.11 released.
https://github.com/lxc/lxd/issues/2964#issuecomment-349710371
stamster
on 6 Dec 2017
Related issues
 mlaradji
·
4Comments
mlaradji
·
4Comments
 spacekookie
·
3Comments
spacekookie
·
3Comments
 jsnjack
·
3Comments
jsnjack
·
3Comments
 fwaggle
·
4Comments
fwaggle
·
4Comments
 tebanep
·
5Comments
tebanep
·
5Comments