Describe the bug
Grafana doesn't show labels in dropdown menu in Explore tab.
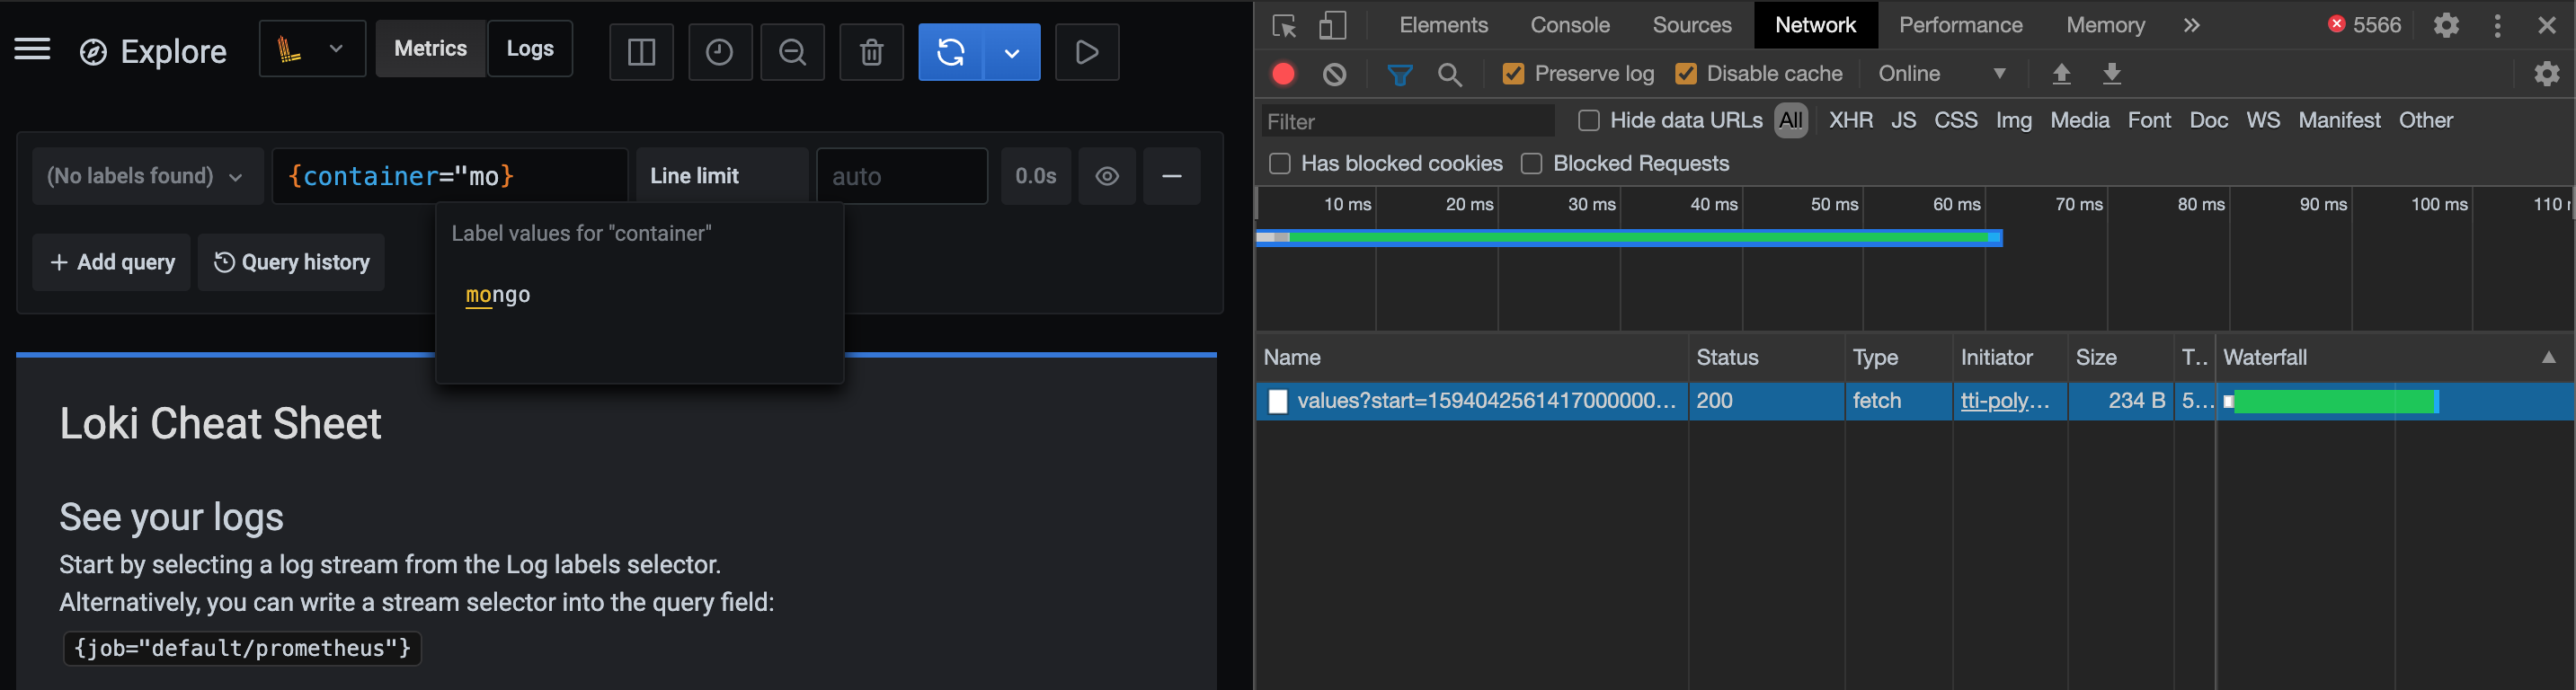
But I can query logs for example {container="mongo"} and get the results. So there are definitely existing labels.
Environment:
- Infrastructure: [Kubernetes]
- Deployment tool: [helm]
Screenshots, Promtail config, or terminal output

 nomatterz
All 12 comments
A few things to try:
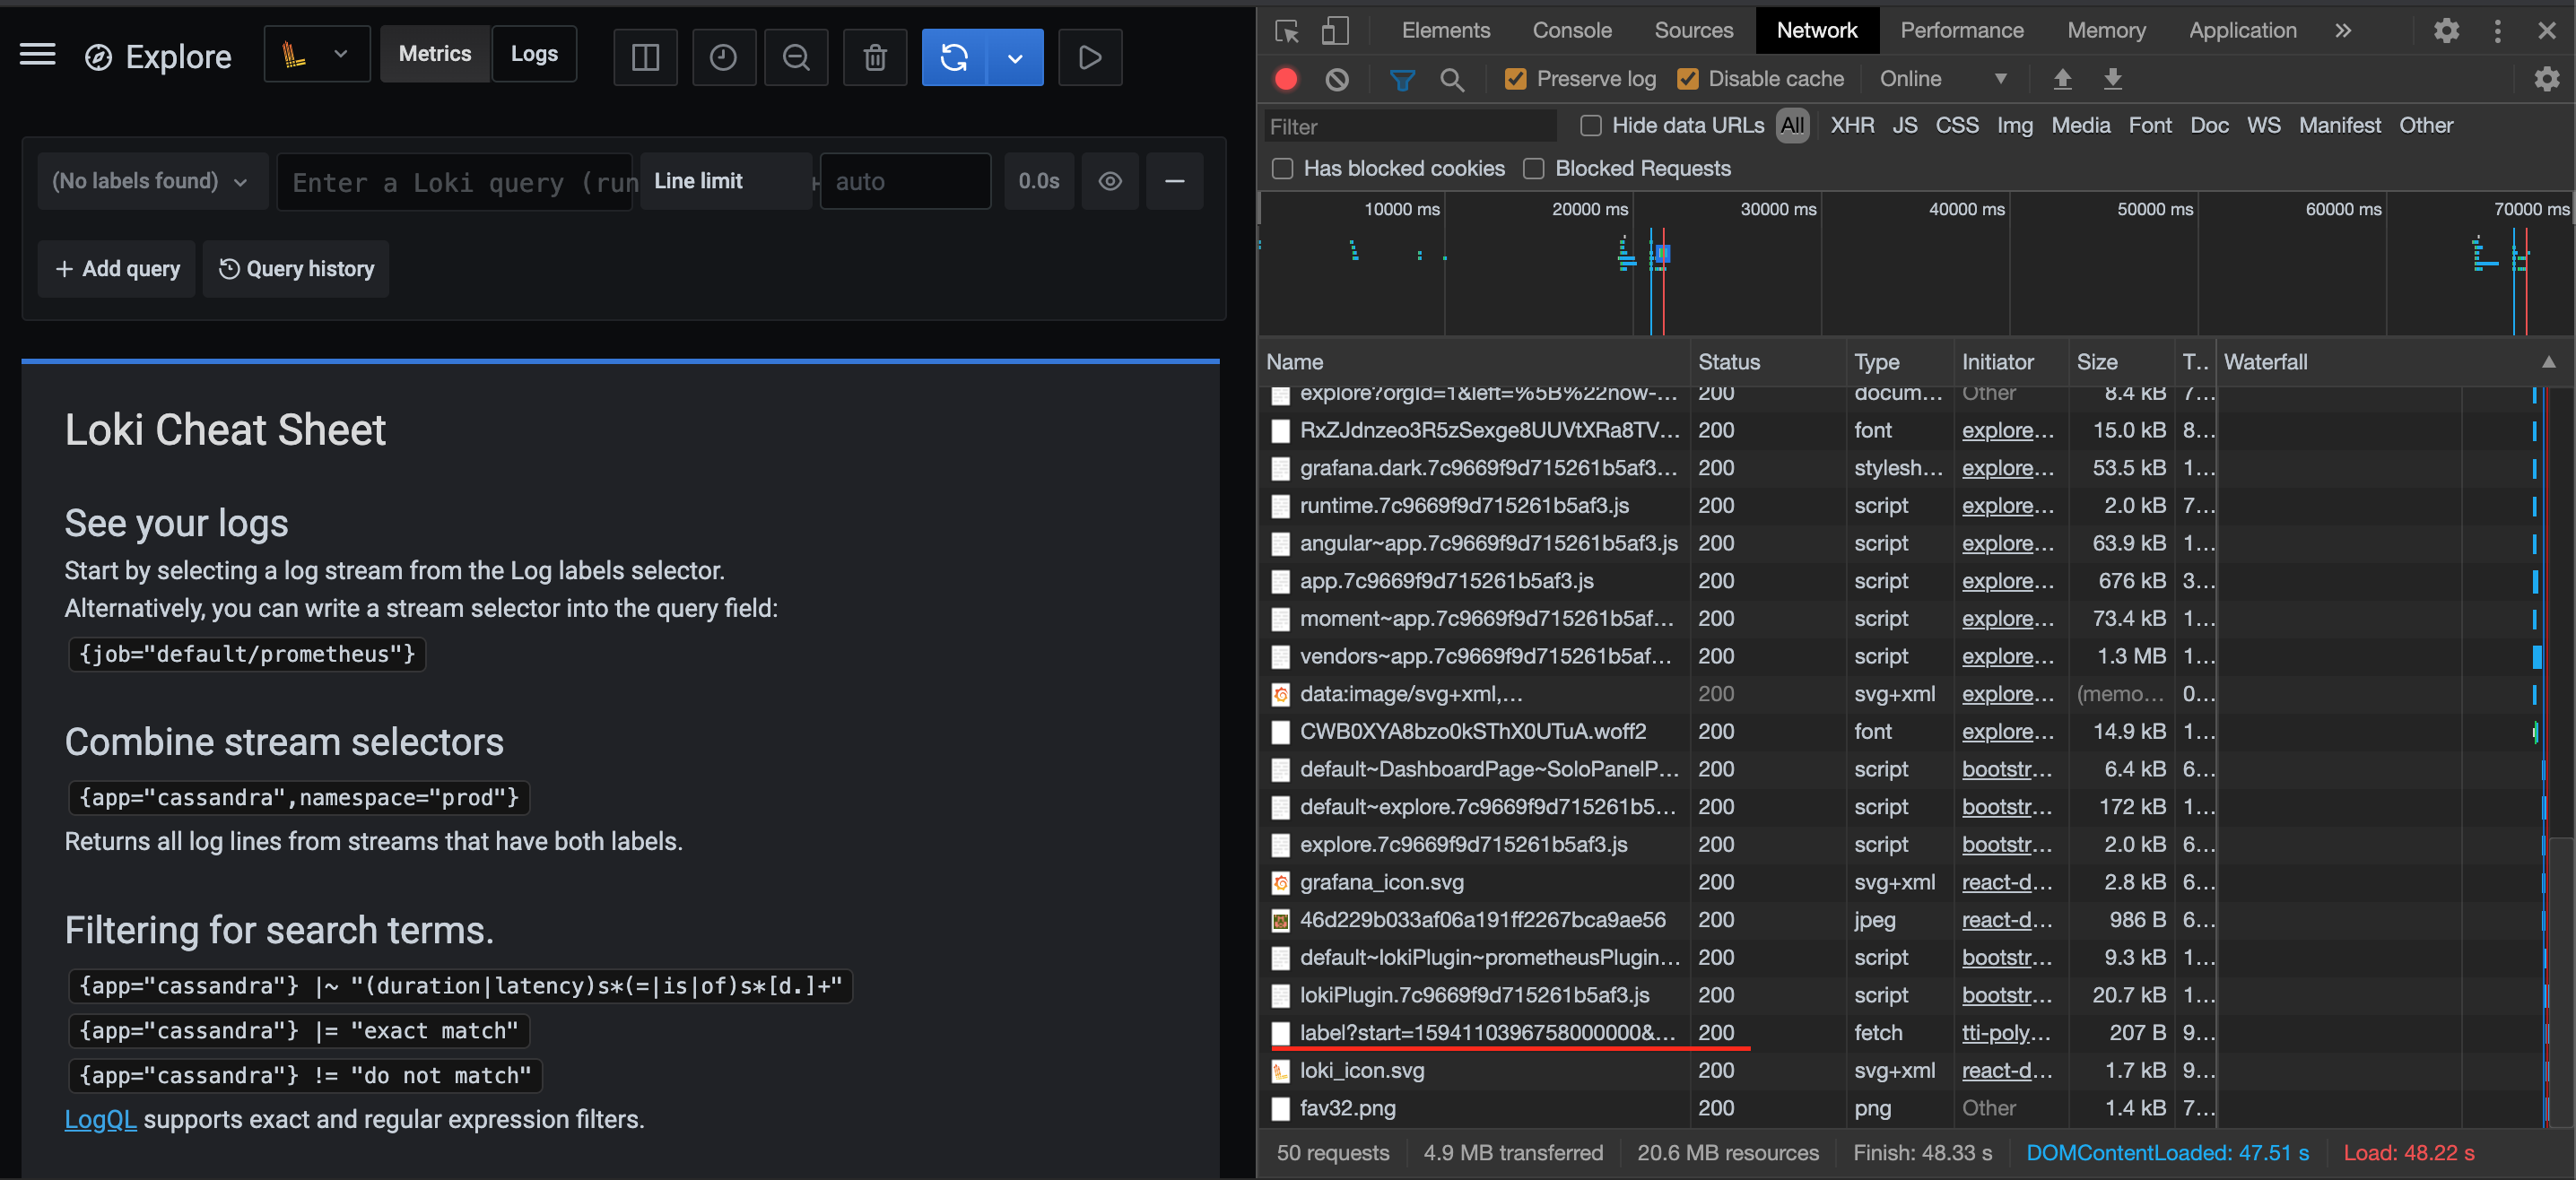
- Open the network tab and see if data is being returned but not displayed.
- Give the labels API endpoint a try and see if it returns any data (this will help determine if the problem is at the Grafana server layer). This can be done manually or via logcli.
 owen-d
on 6 Jul 2020
owen-d
on 6 Jul 2020
Hi @owen-d
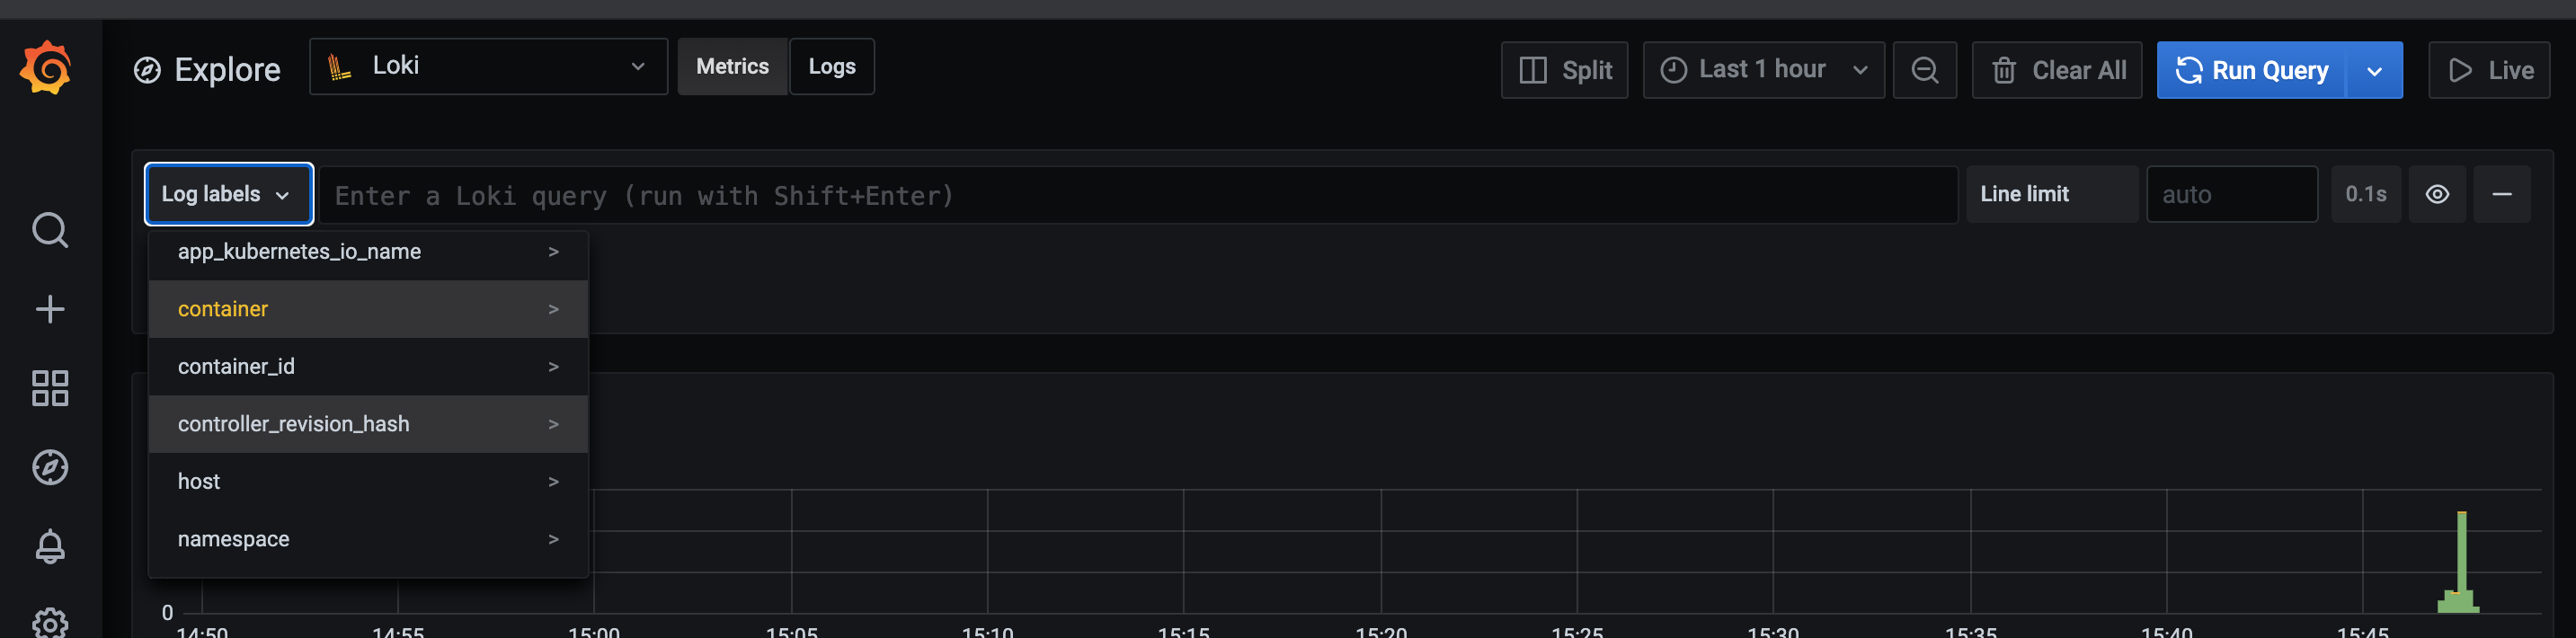
Those 2 checks confirmed there are labels in Loki
/ # ./logcli labels
http://loki.logging:3100/loki/api/v1/labels
__name__
app_kubernetes_io_instance
app_kubernetes_io_name
container
container_id
controller_revision_hash
host
namespace
pod
pod_id
pod_template_hash
statefulset_kubernetes_io_pod_name
nomatterz
on 6 Jul 2020
This looks like it may be an issue between Loki & Grafana. What versions are you running?
/cc @davkal
owen-d
on 6 Jul 2020
Definitely interesting 🧐 can you check for the /labels http call when you load the page or switch from one data source to another. The screenshot you have is for label values this one usually works fine.
What’s the time range when that happens 1h or 3h or 6h ? Can you set 1h and refresh the page ? What store schema are you using ? V9, v10 or v11 ?
 cyriltovena
on 7 Jul 2020
cyriltovena
on 7 Jul 2020
@owen-d
Grafana - Grafana v7.0.1 (ef5b586d7d)
Loki - v1.5.0
@cyriltovena
schema_config:
  configs:
  - from: "2018-04-15"
    index:
      period: 168h
      prefix: index_
    object_store: filesystem
    schema: v9
    store: boltdb
This happens no matter what time range is.
Regarding call to /labels - if i get you correctly here is the result:
nomatterz
on 7 Jul 2020
I think Owen first intuition was right seem like a Grafana bug, have you tried to clear cache or incognito window ?
/cc @ivanahuckova @aocenas
cyriltovena
on 7 Jul 2020
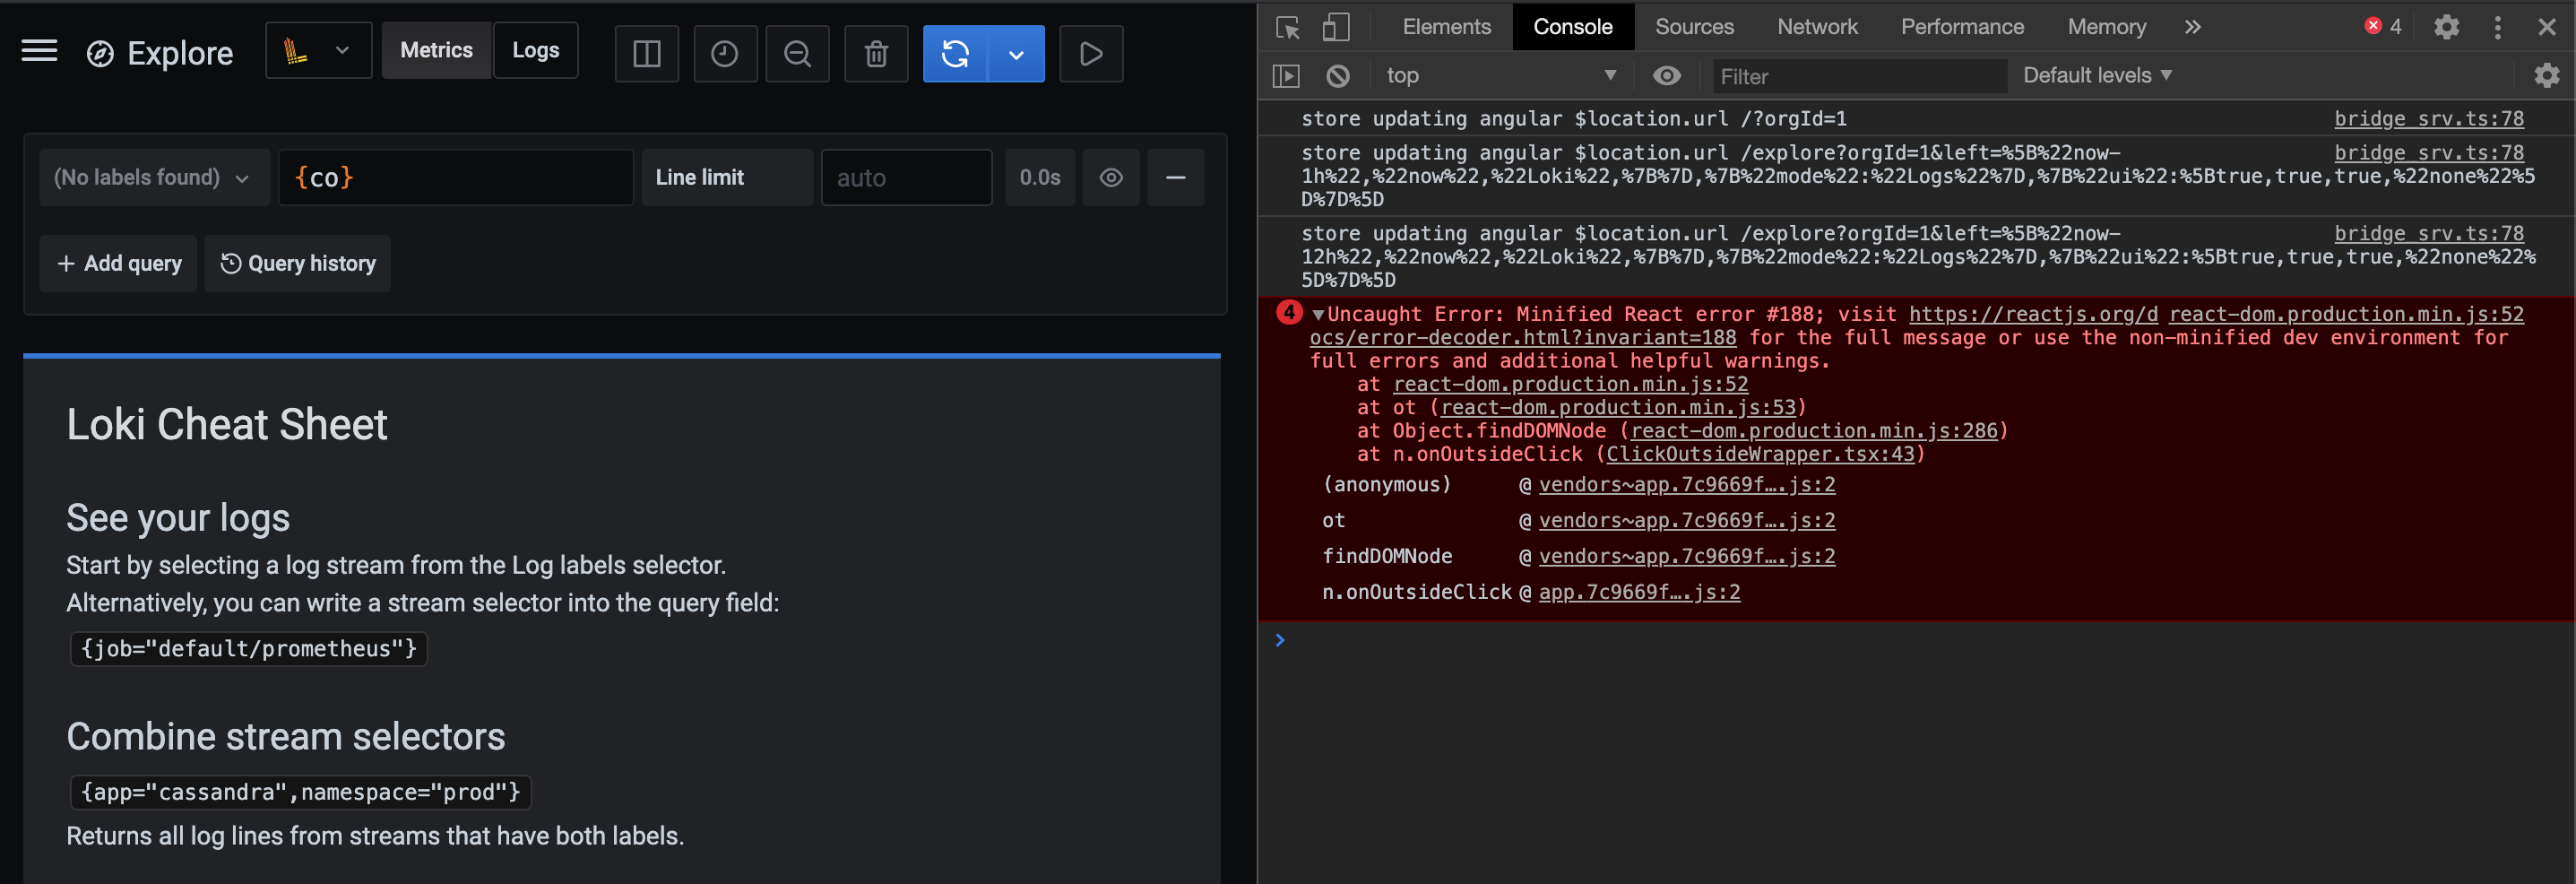
@nomatterz can you check the console in the browser if there is any javascript errors there? Can't reproduce this with my local setup so far.
 aocenas
on 7 Jul 2020
aocenas
on 7 Jul 2020
@cyriltovena
Yes, sure
@aocenas
At first there are no errors, but when i change timerange and start typing label name i get this:
nomatterz
on 7 Jul 2020
This issue has been automatically marked as stale because it has not had any activity in the past 30 days. It will be closed in 7 days if no further activity occurs. Thank you for your contributions.
![stale[bot] picture](https://avatars3.githubusercontent.com/in/1724?v=4&s=40) stale[bot]
on 7 Aug 2020
stale[bot]
on 7 Aug 2020
Hi @nomatterz! 👋 I think that this issue might be similar to https://github.com/grafana/grafana/issues/26213. Basically, we weren't sending the time range when we were fetching labels and we always just fetched labels from the past 1 hour. Looking at the results from your print screen, I can see that the first log (and therefore also value) was from 2+ hours in the past, and therefore labels query probably didn't fetch it. This PR https://github.com/grafana/grafana/pull/26622 that will be part of 7.2 fixes it. I will close this issue for now, but if you will encounter this issue after 7.2, please reopen it! 🙂
 ivanahuckova
on 7 Aug 2020
ivanahuckova
on 7 Aug 2020
Hi @ivanahuckova
Thank you for your input.
I think you're right with the cause of the issue.
I've just generated logs and checked Explore tab, all relevant labels are present.
nomatterz
on 12 Aug 2020
Awesome! 🙂 I am really glad it helped and thank you for confirming it. As mentioned, this fix will be part of 7.2 release.
ivanahuckova
on 12 Aug 2020
Related issues
 SuperQ
·
5Comments
SuperQ
·
5Comments
 kylos101
·
4Comments
kylos101
·
4Comments
 oleksandr-hyuna
·
4Comments
oleksandr-hyuna
·
4Comments
 naughtyGitCat
·
3Comments
naughtyGitCat
·
3Comments
 arnitolog
·
6Comments
arnitolog
·
6Comments