Describe the bug
I'm using Loki with Grafana to search logs in Grafana's Explore tab.

When you open up the Explore tab, then Grafana tries to load all the labels within a specific time range (it's 1 hour by default). But this loading takes pretty long even with a cache layer (memcached). Without cache, then it just times out (502 Bad Gateway).
Loki API being used to load all the labels:
/api/prom/label?start=1583952473956000000&end=1583956073957000000
To Reproduce
Steps to reproduce the behavior:
- Started Loki (SHA or version)
v1.3.0 - Started Promtail (SHA or version) to tail '...'
This issue isn't related to Promtail. - Query:
No query needed to reproduce the behavior. Label loading takes long.
Expected behavior
Labels should be loaded quickly. Latency of LabelHandler should be prompt like under 1 sec with cache.
Environment:
- Infrastructure:
Kubernetes v1.13 - Deployment tool: helm with a bit of tweak. Manually added memcached & Loki Querier" & Loki Query Frontend for faster search.
Screenshots, Promtail config, or terminal output
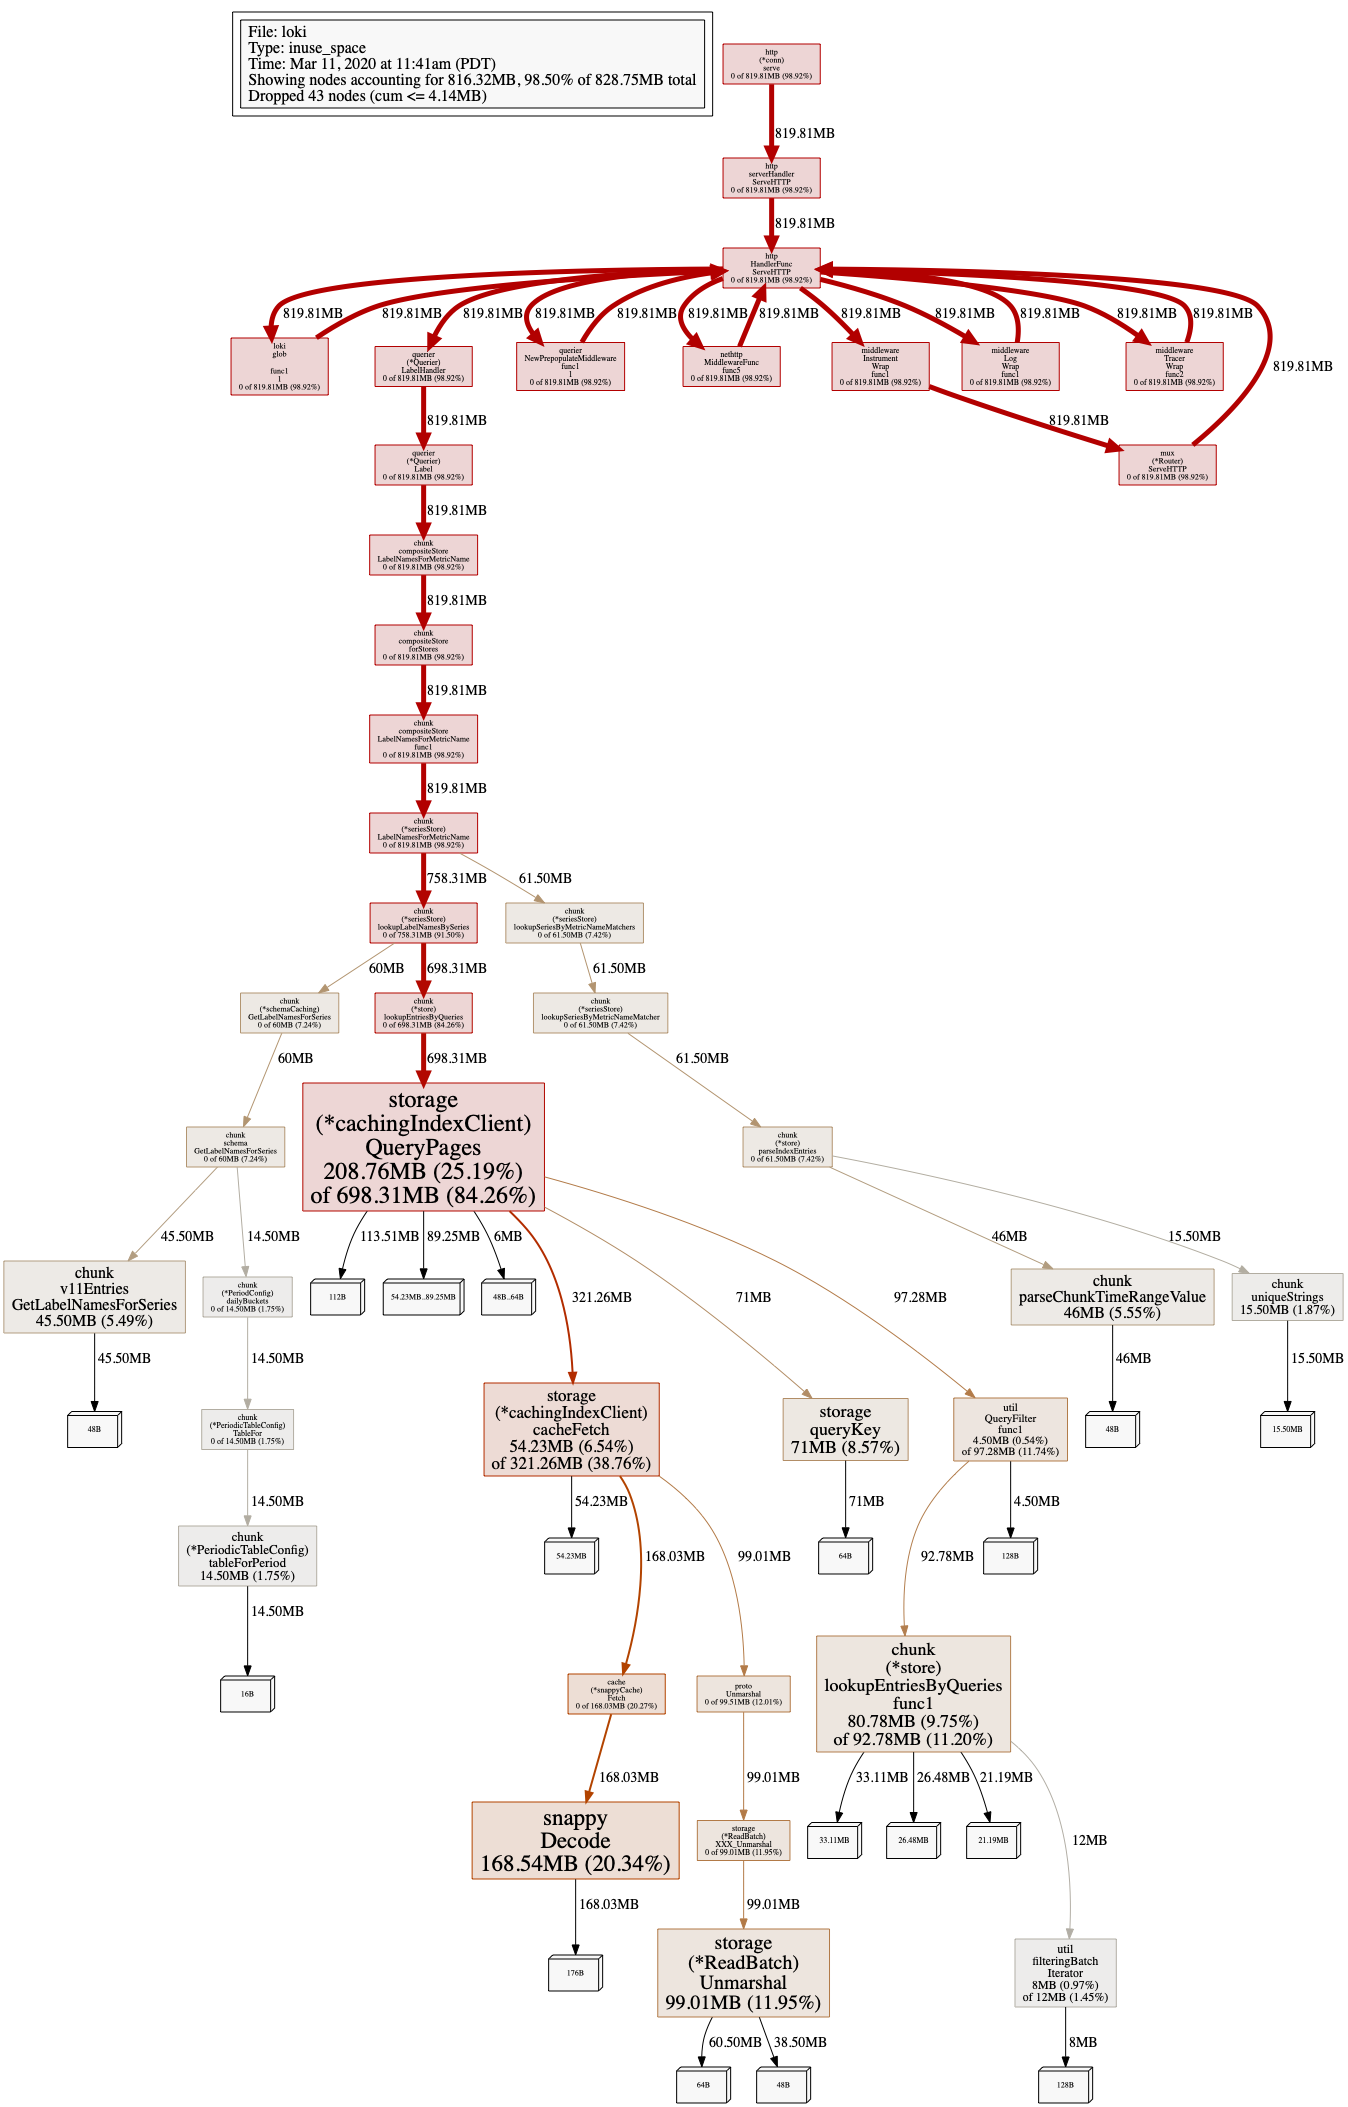
pprof heap of querier at the time of label loading:
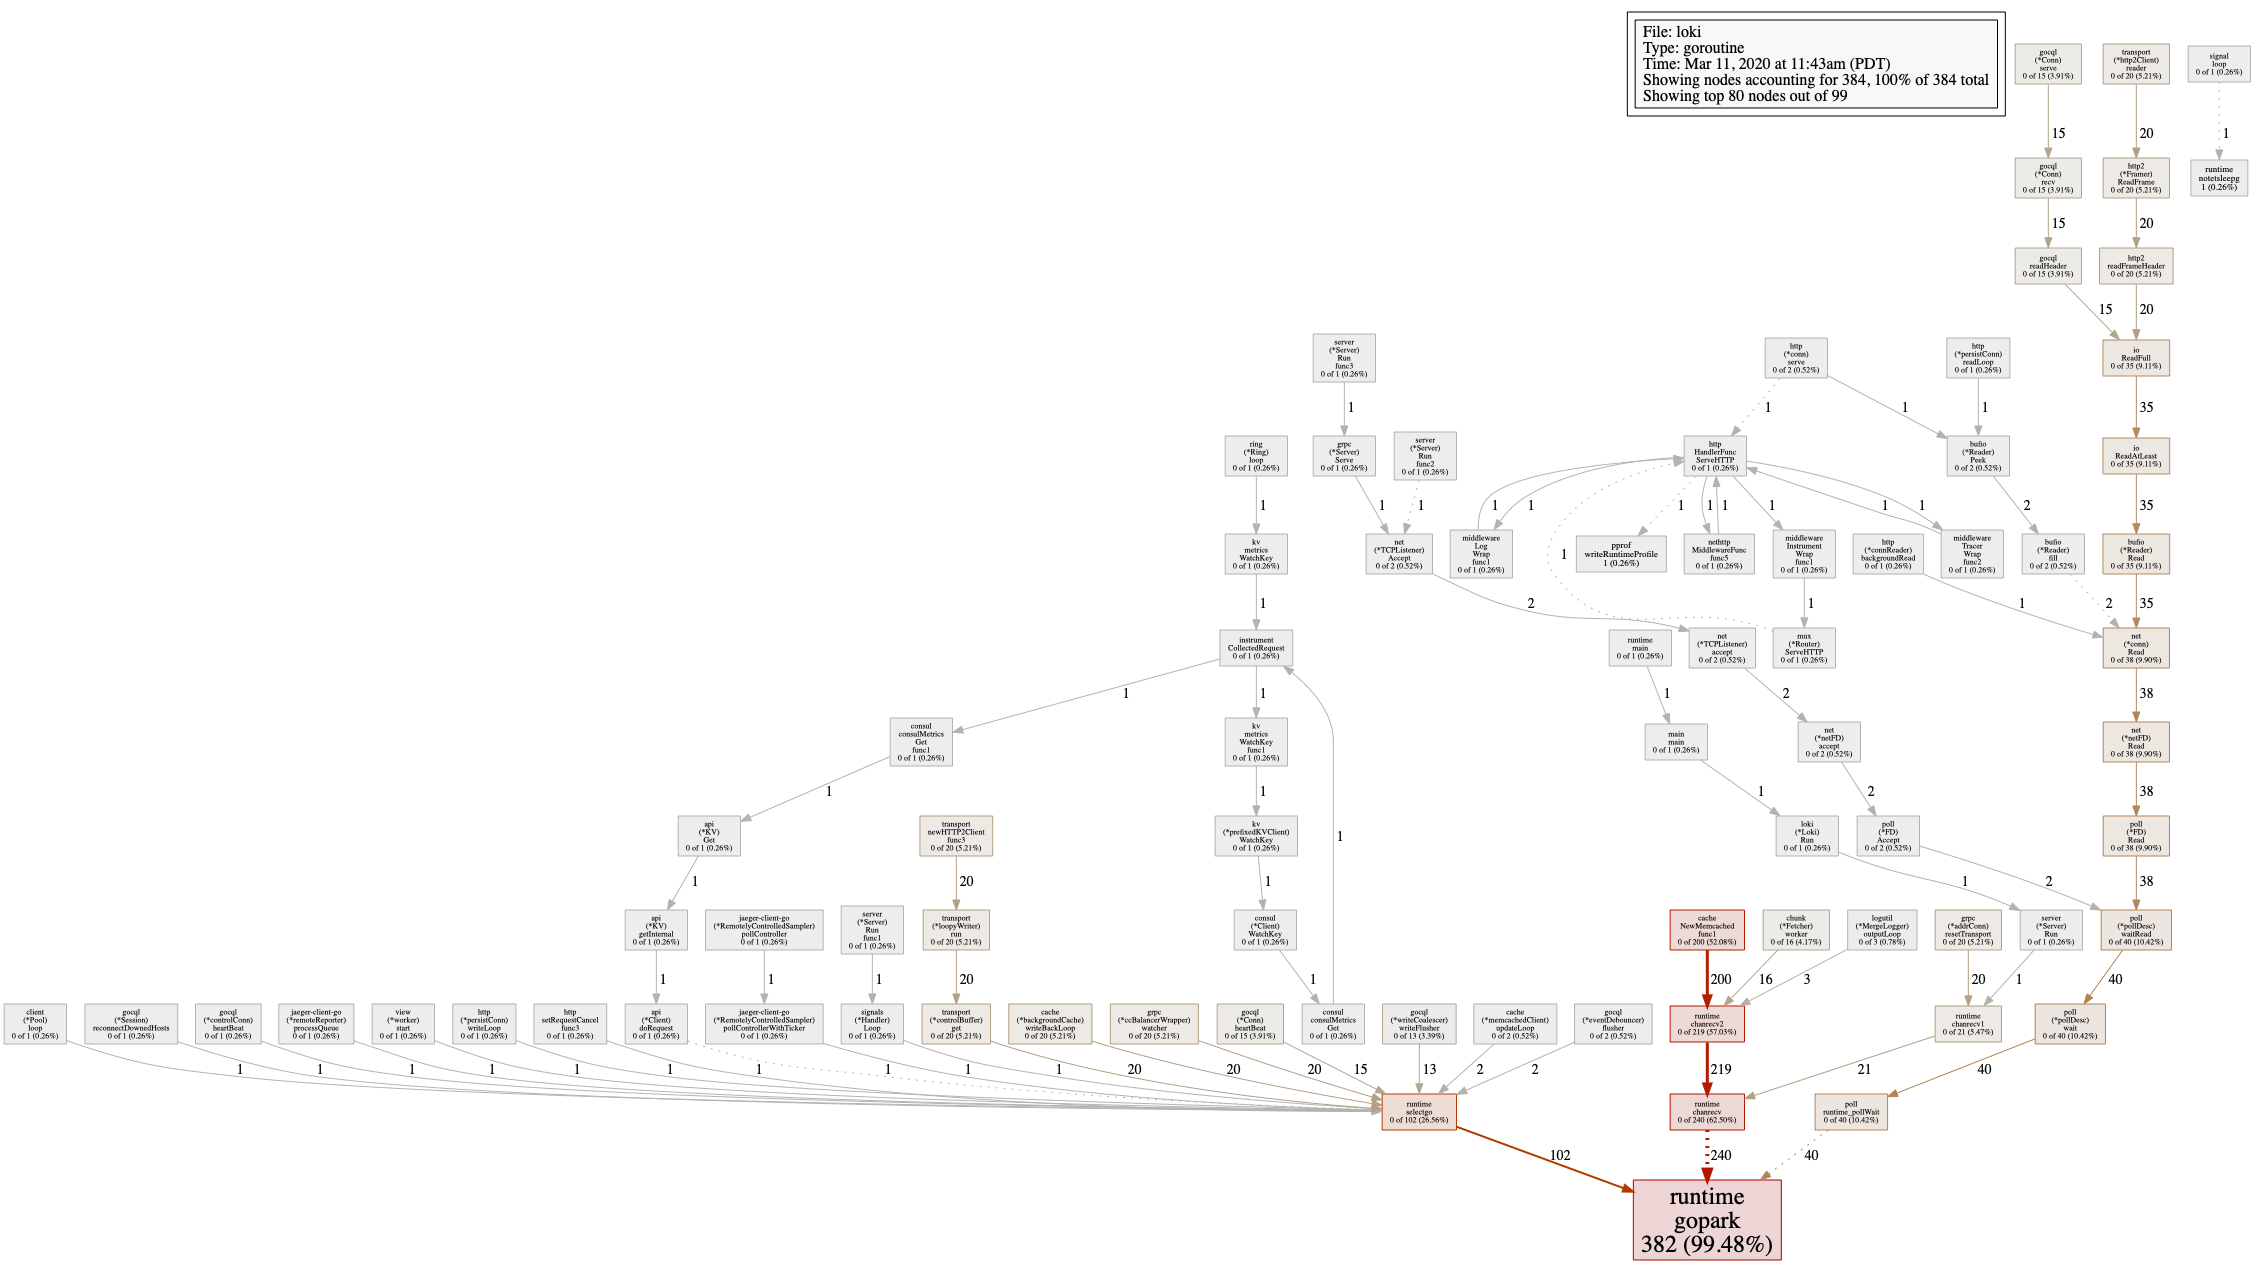
pprof goroutine of querier at the time of label loading:
Average ingestion rate: 40k/sec
 mjaewon
All 25 comments
What's your schema config look like, what version schema are you using?
v11 of the schema was introduced specifically to address slow label queries, unfortunately there is no easy way of updating the helm chart to the new version (and until recently there was a bug in cortex that would cause table rotation to fail when updating the schema outside of the weekly table roll.)
More unfortunately the first official loki release to have this change from cortex will not be released until probably tomorrow.
So you can wait until tomorrow, update to 1.4, and add a new schema entry (future dated), if you don't care about your data you can update you schema today.
The speedup will only help data written using the new schema, so only on new incoming data.
 slim-bean
on 11 Mar 2020
slim-bean
on 11 Mar 2020
Also, you want to be careful around the cardinality of your labels, an ingestion rate of 40k/sec is fairly low so I worry that you might have labels with really high cardinality.
Or put another way, you should only use labels that have a finite number of values, maybe 100's of values or 1000's tops.
slim-bean
on 11 Mar 2020
Also Also: much appreciate the profiles and the work you did debugging, this can be a huge helpn :)
slim-bean
on 11 Mar 2020
Thanks for your quick response and the suggestions.
Here's schema config that I'm using. Somehow realized there is a new version of schema, v11, while googling around so I think I'm already using the latest version of schema (but Loki version is still v1.3.0).
schema_config:
  configs:
    - from: 2020-03-10
      store: cassandra
      object_store: s3
      schema: v11
      index:
        prefix: grapefruit_
        period: 24h
Also I believe all the labels have cardinality up to around a few hundred, but I will double check it.
mjaewon
on 11 Mar 2020
I'm not sure if this is going to be helpful, but I'm attaching some metrics at the time of label loading:
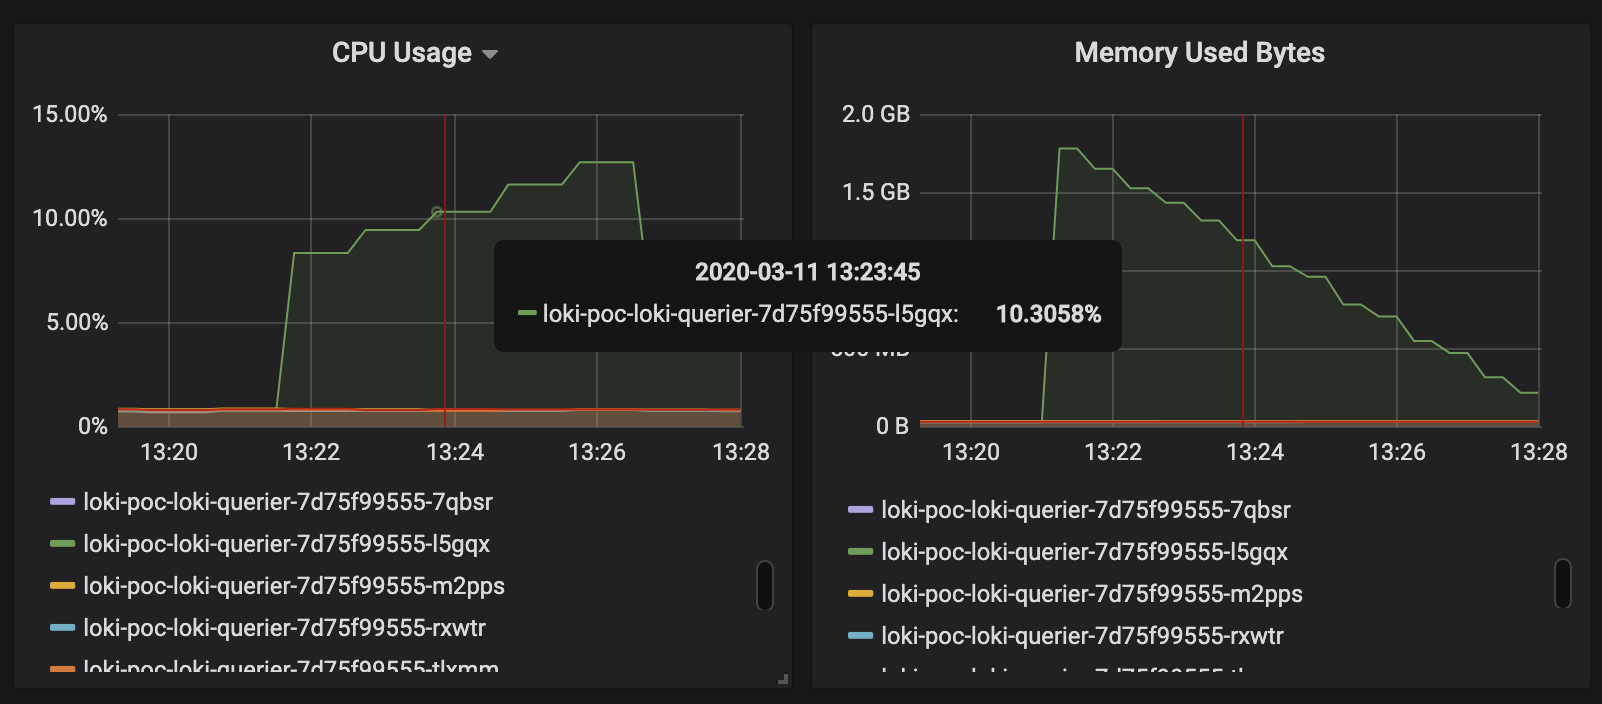
Loki Querier's cpu & memory:
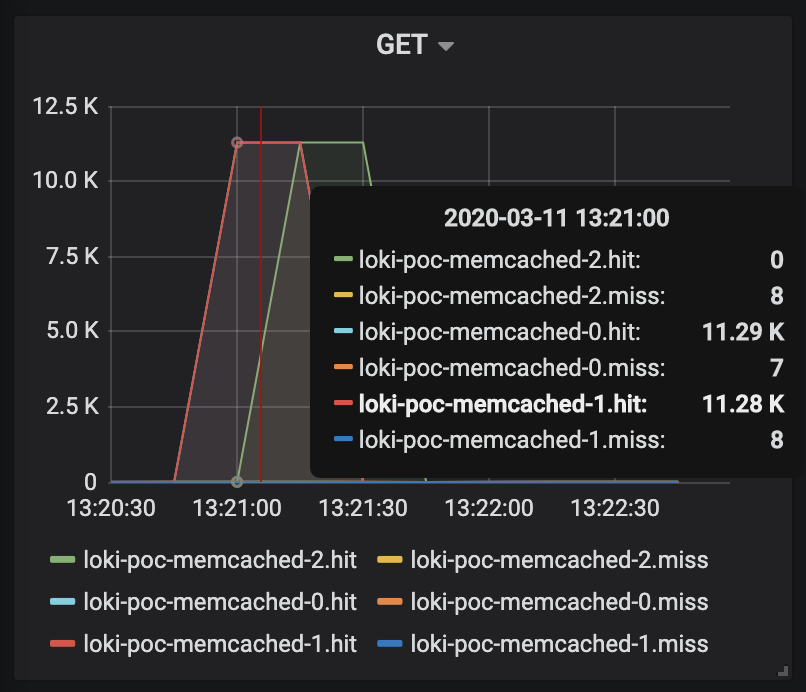
Memcached GET hit:
One of the interesting things here is that only a single node of querier shows a very high cpu & memory pattern even though there's query frontend layer located in front of them, and grafana sends requests to the query frontend layer. Maybe query splitting isn't being done for label loading.
Also high cpu usage might be due to mergeList?
mjaewon
on 11 Mar 2020
One more info.
Cardinality of label names: 7. This is fixed and never changes.
curl 'http://query-frontend.<redacted>/api/prom/label?start=1583954445121000000&end=1583958045121000000' | jq -re '.values | length'
7
Cardinality of each label's values:
curl 'http://query-frontend.<redacted>/api/prom/label/_log_relay_thread/values?start=1583954445121000000&end=1583958045121000000' | jq -re '.values | length'
663

curl 'http://query-frontend.<redacted>/api/prom/label/__name__/values?start=1583954445121000000&end=1583958045121000000' | jq -re '.values | length'
0

curl 'http://query-frontend.<redacted>/api/prom/label/service/values?start=1583954445121000000&end=1583958045121000000' | jq -re '.values | length'
4

curl 'http://query-frontend.<redacted>/api/prom/label/role/values?start=1583954445121000000&end=1583958045121000000' | jq -re '.values | length'
4

curl 'http://query-frontend.<redacted>/api/prom/label/instance_id/values?start=1583954445121000000&end=1583958045121000000' | jq -re '.values | length'
538

curl 'http://query-frontend.<redacted>/api/prom/label/filepath/values?start=1583954445121000000&end=1583958045121000000' | jq -re '.values | length'
39

curl 'http://query-frontend.<redacted>/api/prom/label/application/values?start=1583954445121000000&end=1583958045121000000' | jq -re '.values | length'
7
I'm using fluentd as a pipeline which ships logs to Loki ingesters. Value of _log_relay_thread label is random generated UUID in each fluentd process to avoid entry out of order errors. Because of auto scaling, its cardinality shows some fluctuation but it would never exceed 1000 within 24 hour.
Also cardinality of instance_id label's value seems a bit high (538) but that's almost fixed too.
So in a nutshell, I think I've done pretty much all of what I can do to make label loading faster like below:
- Add in cache layer (memchaced)
- Physically separate out querier & query-frontend layer, and have grafana to communicate with the endpoint of query-frontend.
- Label name cardinality is fixed to
7, which seems fairly low. - Most of labels' value cardinality are just around 10's. Two of them have around 100's (
663,538) but almost fixed. - Set schema version to
v11.
But still it takes around 10s to load the list of labels. Is this an expected level of slowness or am I missing something?
mjaewon
on 12 Mar 2020
This is interesting we have way more labels and that does not happen. I would love to understand why.
If you can share both cpu, heap and trace pprof profiles as binary instead of an image that would be really useful. I would also be interested to see the go gc rate. All of it during a label query.
Finally if you could also share all your kubernetes manifest, to double check everything. You can hide secrets.
I know we have to work on this:
- add a result cache for labels
- a better schema
- frontend splitting
But I have a feeling you’re hitting something else. I’ll dig into it as soon as possible.
 cyriltovena
on 12 Mar 2020
cyriltovena
on 12 Mar 2020
Ho and you could also check s3 I would love to see how many chunks you have and their size by date. I know this not used during labels but each chunks has index entry.
cyriltovena
on 12 Mar 2020
Really appreciate your help.
Kubernetes manifest (Current release of helm. Secrets are redacted):
current-release.yaml.log
helm get loki-poc-loki > current-release.yaml
pprof (all taken during an 1-hour range of label query):
pprof-cpu.txt.log
pprof-heap.txt.log
pprof-trace.txt.log
kubectl port-forward loki-poc-loki-querier-5f8db86b55-x52h9 8080:3100

go tool pprof -raw 'http://localhost:8080/debug/pprof/heap' > pprof-heap.txt
curl -fsSL 'http://localhost:8080/debug/pprof/trace?seconds=5' > pprof-trace.txt
go tool pprof -raw 'http://localhost:8080/debug/pprof/profile?seconds=20' > pprof-cpu.txt
Go runtime:
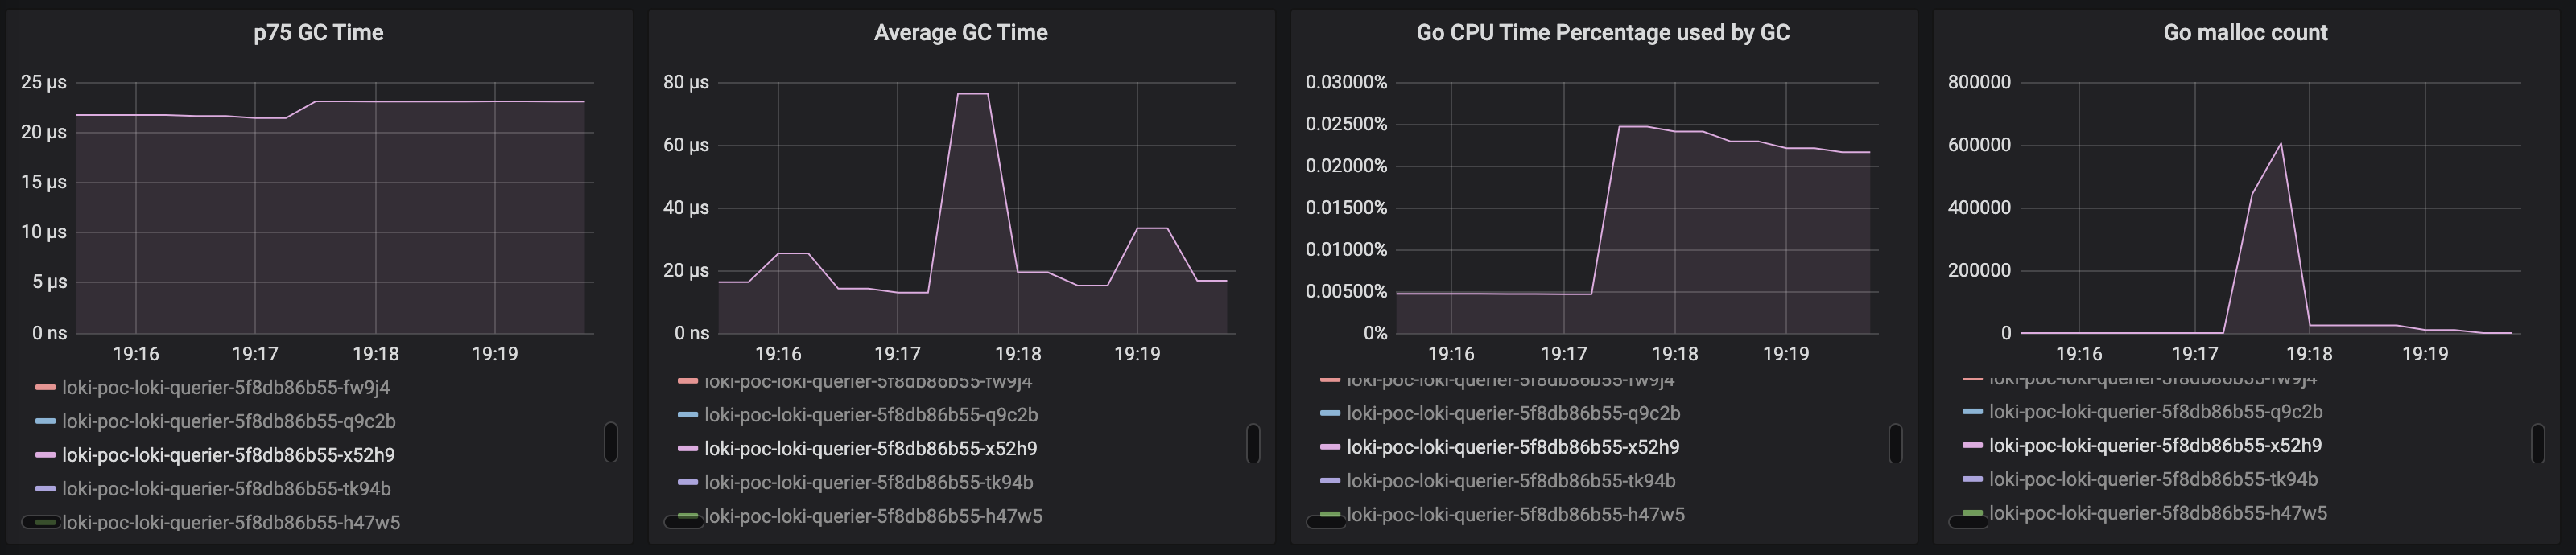
mjaewon
on 12 Mar 2020
Just checked S3 too.
Chunks (S3 objects) count per day: 5MM
S3 size increase per day: ~ 200GiB
Average chunk (s3 object) size: 200 * 1024 * 1024 / 5,000,000 ~= 42KiB (compressed)
mjaewon
on 12 Mar 2020
Ok I’ll give you a more detailed answer tomorrow but I think you have a wrong deployment causing ton of tiny chunks and index entries.
You should consider tanka. How much mb/sec are you ingesting ? Around 8 mb/sec based on your daily numbers?
We usually aim at 2.1mb per chunk to give you an idea.
cyriltovena
on 12 Mar 2020
Thanks a lot. Wow,2.1mb per chunk is 50x times bigger than my current average. This number is exactly what I've been looking for! I will definitely go give it a try.
Ingestion traffic has some daily fluctuation:
- Max: 20mb/sec (uncompressed)
- Min: 3mb/sec (uncompressed)
- Avg: 13mb/sec (uncompressed)
Can I ask what's tanka? Is it like helm?
mjaewon
on 12 Mar 2020
Yeah Tanka is like helm, you could use tanka show command just to have an idea of how we deploy the distributed version of Loki.
Based on your ingestion rate, you can also try to use the single binary version from helm without scaling and see if labels queries are doing better. If so and you still want the frontend to speed up filter queries which makes total sense, then I can help you figured out how to do that with helm.
I still need to dig into your pprof to ensure everything is fine.
cyriltovena
on 12 Mar 2020
I tried
go tool pprof -http :8081  -nodefraction=0  /Users/ctovena/Downloads/pprof-cpu.txt.log
/Users/ctovena/Downloads/pprof-cpu.txt.log: parsing profile: unrecognized profile format
failed to fetch any source profiles
Can you try a different command:
curl localhost:$PORT/debug/pprof/$PROFILE_TYPE
to download the profile ?
cyriltovena
on 12 Mar 2020
@mjaewon check out the chunk_target_size in the ingester_config
We use this setting (which is currently not the default). We are targeting a chunk size of 1.5MB (not 2.1MB, sorry Cyril :) ) This is somewhat arbitrary, making it bigger uses more memory in ingesters but also reduces some overhead on queries, so you may want to play around with this, we still are.
Just make sure if you are using memcache that you have it configure to accept whatever size you target, ours is set to allow up to 2MB objects.
Also be aware that memcache doesn't love objects bigger than 512kb and we see a fair number of memcache errors with these large chunks, that being said most chunks are stored and retrieved properly so caching still make a huge difference.
slim-bean
on 12 Mar 2020
@cyriltovena Captured profile again at the time of label loading like below. This time I did it twice for each 20sec and 5 sec just in case.
curl -fsSL 'http://localhost:8080/debug/pprof/profile?seconds=20' > pprof-cpu-20sec.log
curl -fsSL 'http://localhost:8080/debug/pprof/profile?seconds=5' > pprof-cpu-5sec.log
pprof-cpu-5sec.log
pprof-cpu-20sec.log
I was able to confirm that those files can be loaded with go tool pprof -http :8081 -nodefraction=0 command.
mjaewon
on 12 Mar 2020
@slim-bean Thanks for your suggestion and the heads-up, it's really helpful. I will go get play around with chunk_target_size value.
I still do have some questions, sorry for bugging you.
- If you guys are aiming 1.5MB for
chunk_target_size, that means it should be 1.5MB AFTER compression right? - Could you share your current production value for
chunk_block_sizetoo? - I have 20 ingesters (yeah it's pretty over provisioned considering ingestion rate) now, and it seems a bit hard to make each chunk big enough before it's flushed. In this case I can choose one of these options right? Increase
chunk_idle_timebig enough, or reduce the number of ingesters to make each one get more traffic.
mjaewon
on 12 Mar 2020
It aims for creating 1.5MB chunks after compression yes, however they will always be smaller because the calculation is a bit naive, it basically looks to see if all the compressed blocks + what's in the head block (uncompressed) + the incoming log line will be more than the target size. If yes, it will cut the head block, compress it, and then cut the chunk. But this means that once the head block is compressed the end chunk will always be smaller than the target size.
our current
chunk_block_sizeis left at the default, we haven't played with this much, our general understanding is the compression algorithm we are using (which we currently use snappy not the default gzip because it's faster although not as efficient in final size as gzip) only operates on blocks smaller than our default block size, so increasing this doesn't change compression effectiveness. Also be aware that compression happens on the write path, so whoever sends the batch that fills the head block has to wait for it to compress, so be careful about making this too big.It shouldn't matter how many ingesters you have if you configure them to use a shared ring via consul/etcd. Any single stream should only go to one ingester (excluding replication). Blocks getting flushed that are not filled will be for one of 2 reasons, some label value changed and the stream is 'dead' and will not get any more values and will idle time out. Or the stream is really slow to update and it will either get idle flushed or hit the chunk max age setting (default 1hr). You can increase both of these to help with slow writing log files (just keep in mind you keep more logs in memory and run increased risk of losing them if an ingester crashes). The cardinality problem affects us to and why we generally advise keeping label key=value combinations as small as possible (although nothing you posted seems unreasonable to me). Considering it may actually be faster to remove some labels and do filter expressions
|= or |~because Loki is more highly optimized to work with full chunks and do this in parallel. There is a fair amount of overhead with processing lots of tiny chunks (as you are seeing). Again though this is just general advice, your unique label counts don't strike me as a problem unless you have labels that are toggling between values at regular intervals leaving a lot of stranded streams to be flushed by idle timeouts (only to be create again when the original set of label=values return)
slim-bean
on 12 Mar 2020
The profile is probably not run when you're doing a label, I guess with 20 replicas it's hard.
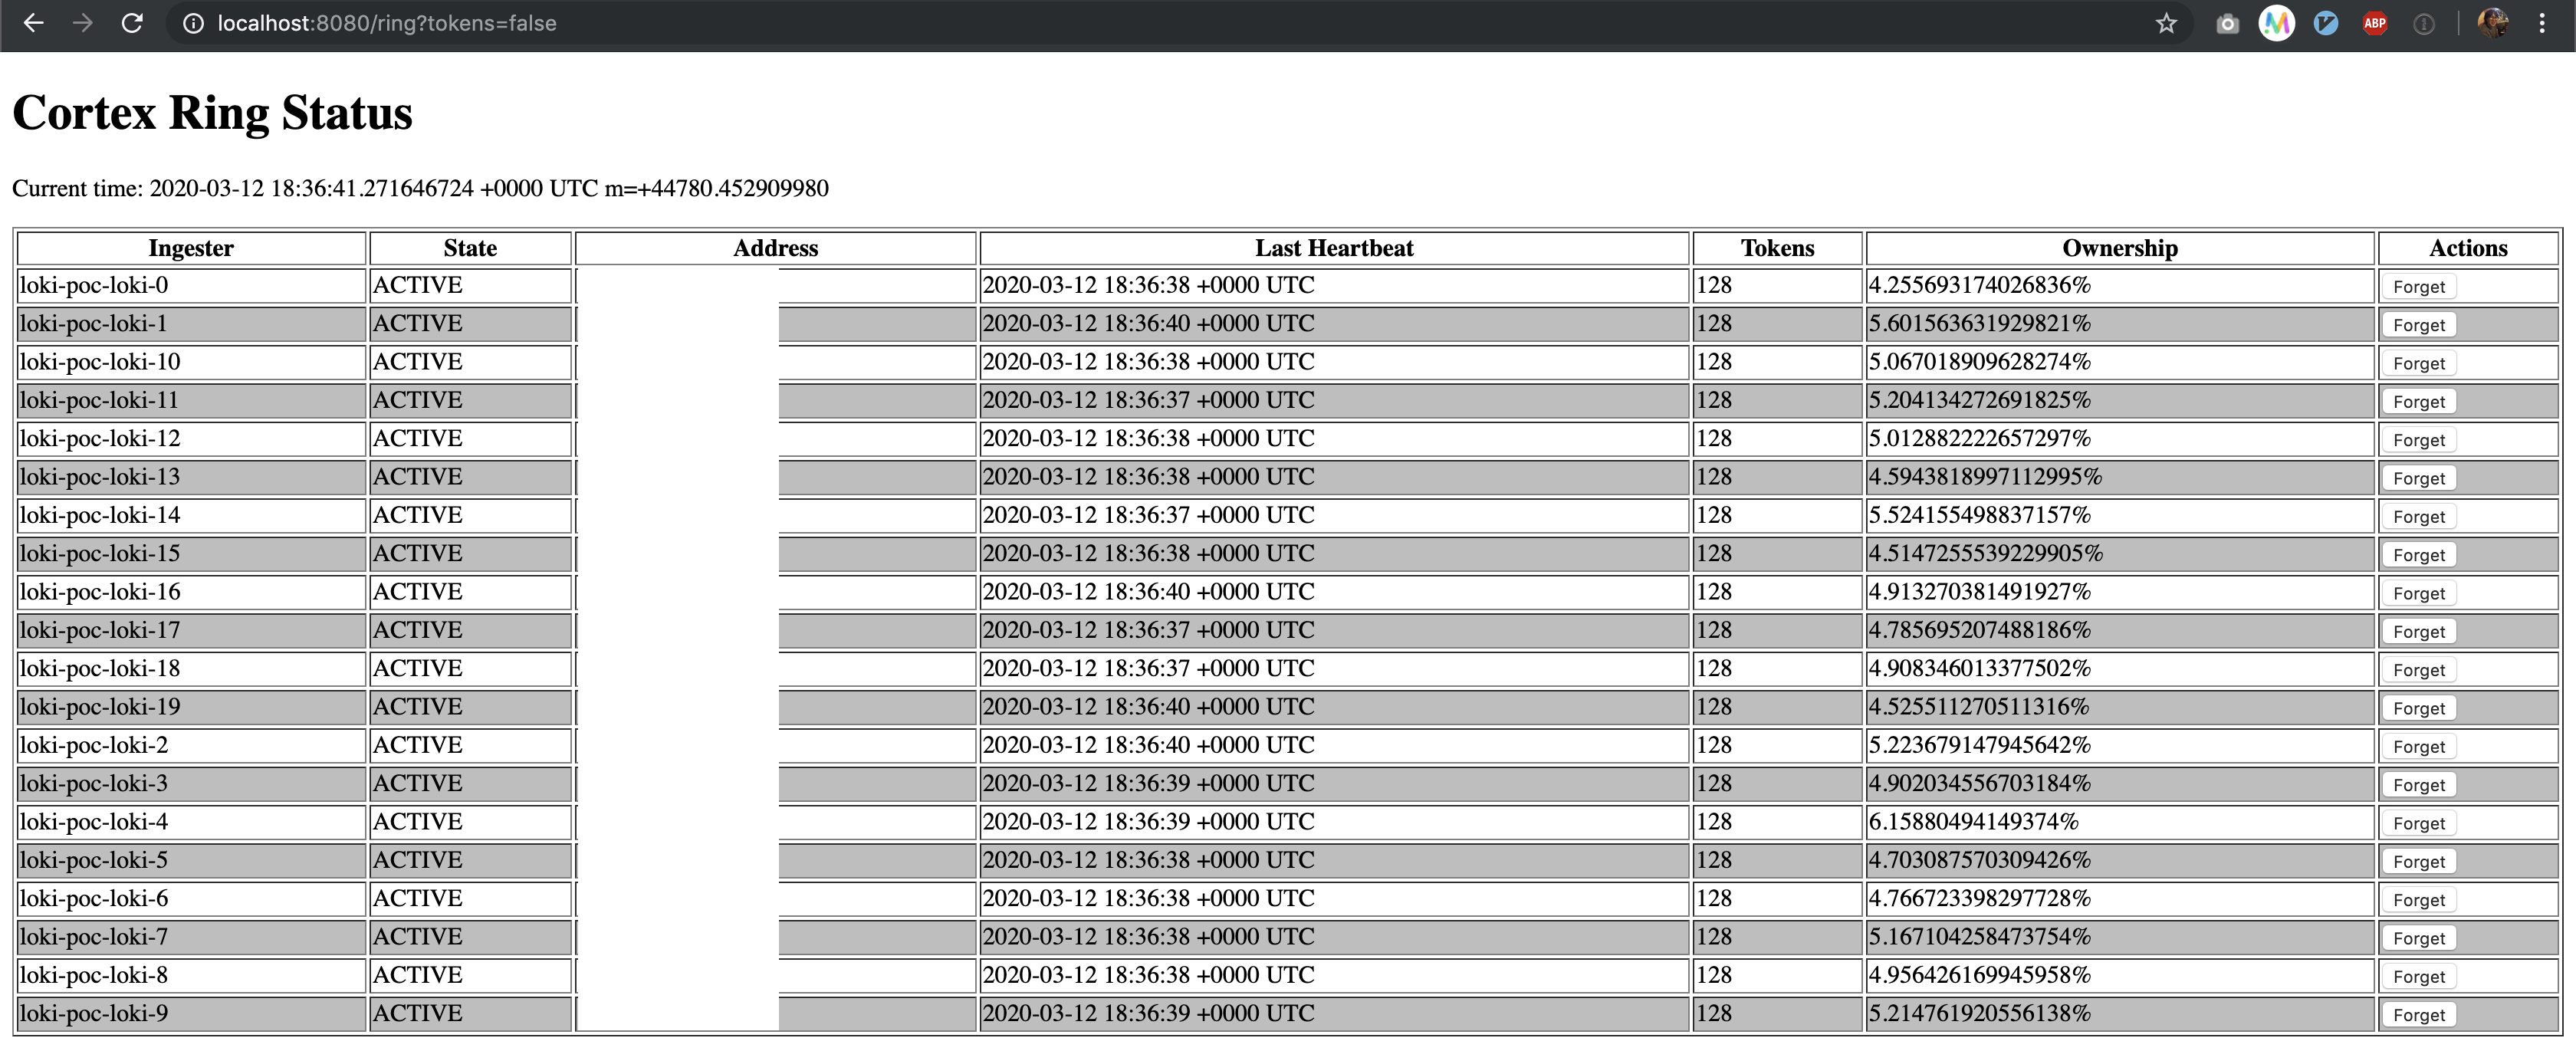
Can you share a screenshot of the ring page (/ring) and make sure it's the same seen for each replicas.
cyriltovena
on 12 Mar 2020
Thanks a lot for your explanation. So invaluable to me. I think all of them are worth being noted down in somewhere in loki documentation.
Also I didn't realize there is something like max_chunk_age since I've been only looking at v1.3.0 documentation but it's in master branch!
So it seems that Loki's performance is all about handling chunk size properly (with some exaggeration :)) I may need some more time to play around with chunk size and finally optimize performance.
mjaewon
on 12 Mar 2020
@cyriltovena Sure. It looks they are well balanced. (Addresses are redacted)
mjaewon
on 12 Mar 2020
So it seems that Loki's performance is all about handling chunk size properly (with some exaggeration :)) I may need some more time to play around with chunk size and finally optimize performance.
I don't think this is an exaggeration :) This is actually on point.
If that page is the same on each replica that looks good.
cyriltovena
on 12 Mar 2020
Ah, actually I'm monitoring consul ring status too:
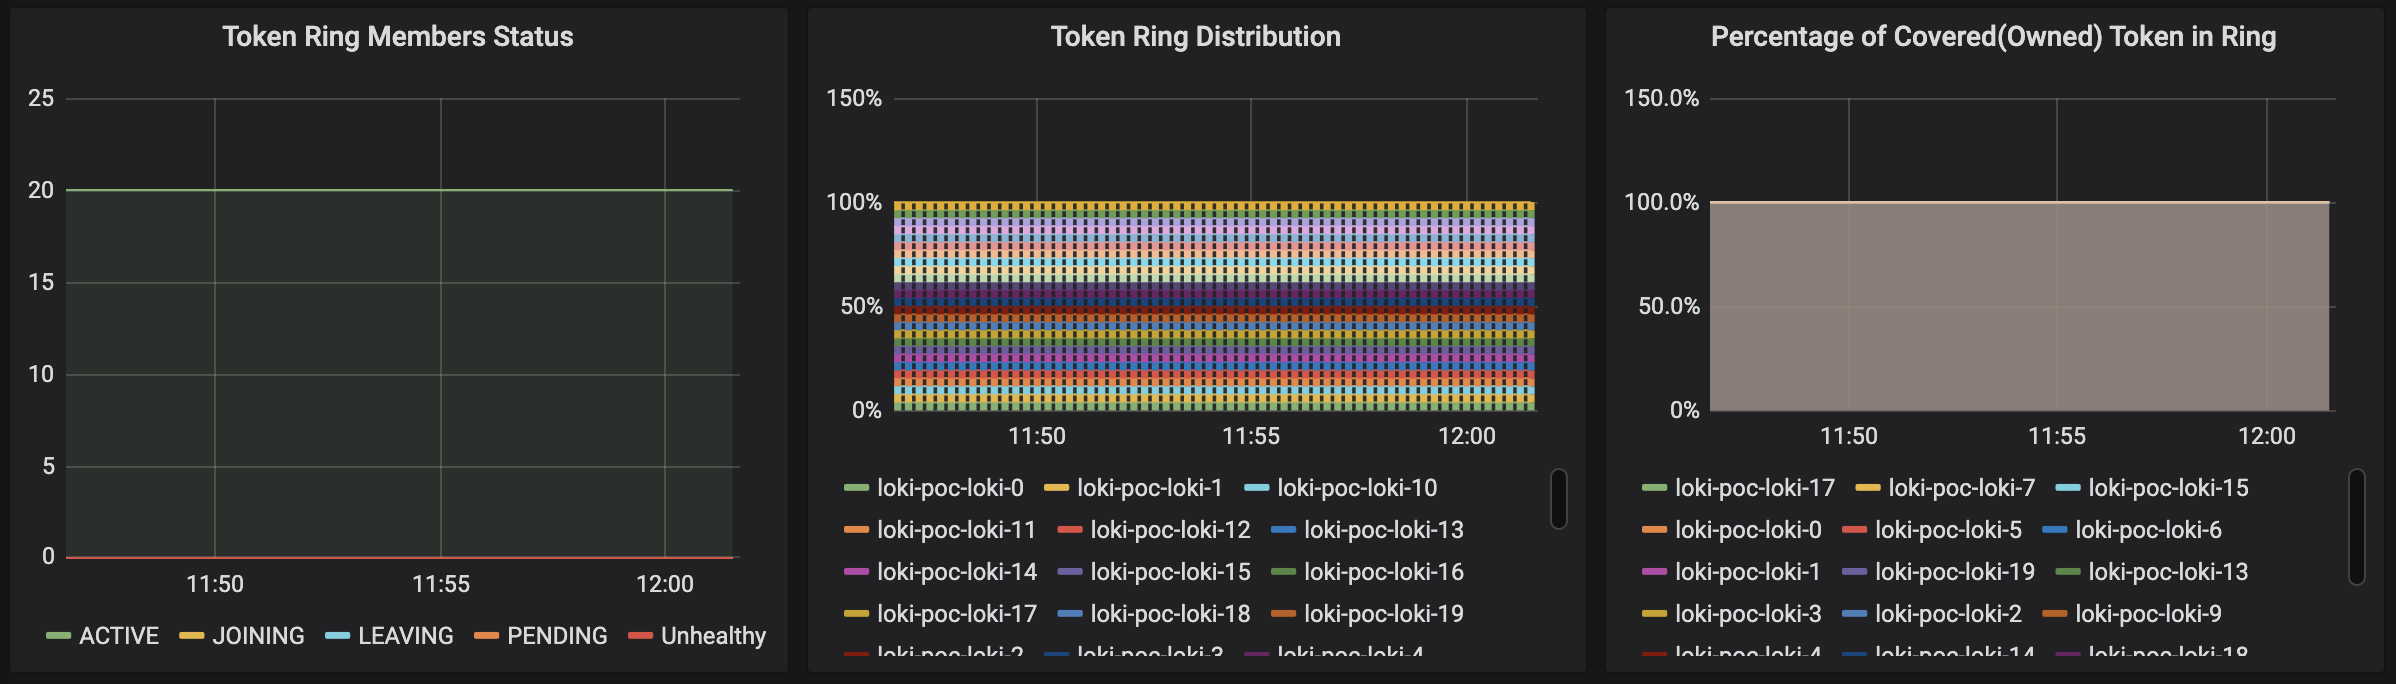
Also I just checked all the /ring page of each ingester manually and they're all same.
Thank you guys so much for your help. While I'm closing this issue now, but please feel free to let me know if there's anything you'd like me to provide more.
mjaewon
on 12 Mar 2020
@mjaewon Let us know how it goes !
cyriltovena
on 12 Mar 2020
After setting chunk_target_size to 2.5mb, label loading & search performance got improved way better. Thanks a lot.
mjaewon
on 19 Mar 2020
Related issues
cyriltovena
·
4Comments
 suppix
·
3Comments
suppix
·
3Comments
 TakumaNakagame
·
5Comments
TakumaNakagame
·
5Comments
 Menda
·
5Comments
Menda
·
5Comments
 Mario-Hofstaetter
·
4Comments
Mario-Hofstaetter
·
4Comments
Most helpful comment
After setting
chunk_target_sizeto 2.5mb, label loading & search performance got improved way better. Thanks a lot.