Loki: How to create alert when using loki?
How to create alert when using with loki?
 orange888
All 20 comments
Do you mean Alert in Grafana based on log entries? I don't think that is currently possible. /cc @davkal
 pstibrany
on 16 Dec 2019
pstibrany
on 16 Dec 2019
Do you mean Alert in Grafana based on log entries? I don't think that is currently possible. /cc @davkal
Yes, custom alert based on log (loki)?
Can loki subscribe to kafka? kafka -> promtail -> loki? Or kafka -> loki?
orange888
on 16 Dec 2019
Yes, custom alert based on log (loki)?
David will give you a definitive answer, but I don't think it's currently supported by Grafana (and not sure what kind of support it would need from Loki. Tailing everything all the time doesn't sound like good idea).
Can loki subscribe to kafka? kafka -> promtail -> loki? Or kafka -> loki?
Not at the moment.
pstibrany
on 16 Dec 2019
Grafana alerting is only available for certain datasources. Even though Loki is not supported yet, Prometheus is supported. And Loki has a prometheus-compatible API, so you can add your Loki as a Prometheus datasource, see #1222. Then you need to set up logql queries that return timeseries and alert on those, e.g., count_over_time({job="foo"} |= "error" [5m]) > 0.
Native alerting w/o the prometheus workaround is still under development.
 davkal
on 16 Dec 2019
davkal
on 16 Dec 2019
@davkal could u please elaborate it in more detail? Where should i set up logql queries? thx
 miklezzzz
on 16 Dec 2019
miklezzzz
on 16 Dec 2019
Where should i set up logql queries?
You create a graph panel using the prometheus datasource that points to loki. In the query field you write the logql query and you should see a line graph for your log volume (depends on the query). Then you can add a panel alert.
davkal
on 16 Dec 2019
@davkal. - When i create prometheus datasource and that datasources pointed to loki service ,
Facing 404 not found error, see the grafana error logs
t=2019-12-28T00:58:25+0000 lvl=info msg="Request Completed" logger=context userId=1 orgId=1 uname=admin method=GET path=/api/datasources/proxy/11/api/v1/query status=404 remote_addr=106.198.13.89 time_ms=202 size=19 referer=https://monitoring-dev.np.example.com/datasources/edit/11/
 AnandPalani92
on 28 Dec 2019
AnandPalani92
on 28 Dec 2019
@anandecemptc URL should be http(s)://<loki-domain>/loki (ex. https://loki.domain.tld/loki). The same as loki datasource but suffix with /loki (and select prometheus datasource)
 Eraac
on 4 Jan 2020
Eraac
on 4 Jan 2020
Thanks Eraac.
I have created a prmetheus datasource using loki url (ex. https://loki.domain.tld/loki), during the creation and saving the datasource i checked the datasource and it was worked.
When i checked through the Grafana explore option and metrics are not loaded.
still metric loading...

When i searched with some string and its not displayed anything.

I created a dashboard and added the query on that dashboard and itsn't loaded anything.

AnandPalani92
on 6 Jan 2020
You need to use a metric query, see https://github.com/grafana/loki/blob/master/docs/logql.md#counting-logs.
Alternatively I want to add that a safe option is also to add metrics pipeline in promtail and scrape promtail with a Prometheus. This allows to create custom metrics in promtail.
See metrics stage : https://github.com/grafana/loki/blob/master/docs/clients/promtail/pipelines.md
 cyriltovena
on 11 Jan 2020
cyriltovena
on 11 Jan 2020
This issue has been automatically marked as stale because it has not had any activity in the past 30 days. It will be closed in 7 days if no further activity occurs. Thank you for your contributions.
![stale[bot] picture](https://avatars3.githubusercontent.com/in/1724?v=4&s=40) stale[bot]
on 10 Feb 2020
stale[bot]
on 10 Feb 2020
Doesn't work for now. Alerter fires:
Object
firing:true
state:""
conditionEvals:" = true"
timeMs:"1.050ms"
error:"tsdb.HandleRequest() error bad_response: readObjectStart: expect { or n, but found p, error found in #1 byte of ...|parse error|..., bigger context ...|parse error : syntax error: unexpected $end |..."
logs:Array[1]
0:Object
message:"Condition[0]: Query"
data:Object
 chrono2002
on 28 Apr 2020
chrono2002
on 28 Apr 2020
I am also seeing this with grafana 6.6.2 and above when trying to create an alert using the prometheus from Loki
firing:true
state:"pending"
conditionEvals:" = true"
timeMs:"2.785ms"
error:"tsdb.HandleRequest() error bad_response: readObjectStart: expect { or n, but found p, error found in #1 byte of ...|parse error|..., bigger context ...|parse error : syntax error: unexpected end|..."
 houstonj1
on 29 Apr 2020
houstonj1
on 29 Apr 2020
@chrono2002 @houstonj1 I'm working on a fix https://github.com/grafana/loki/issues/2020
cyriltovena
on 30 Apr 2020
btw which Loki are you using ? Cloud / Tanka / Helm ?
cyriltovena
on 30 Apr 2020
@cyriltovena We are deploying Loki v1.4.1 with a custom Helm chart
houstonj1
on 30 Apr 2020
You shouldn't be impacted then. Hum.
cyriltovena
on 30 Apr 2020
To get things working again, I rolled back to Grafana v6.5.3
houstonj1
on 30 Apr 2020
Doesn't work for now. Alerter fires:
Upgraded to latest Loki. Everything is ok now.
chrono2002
on 17 May 2020
hello,
error Cannot read property '__name__' of undefined
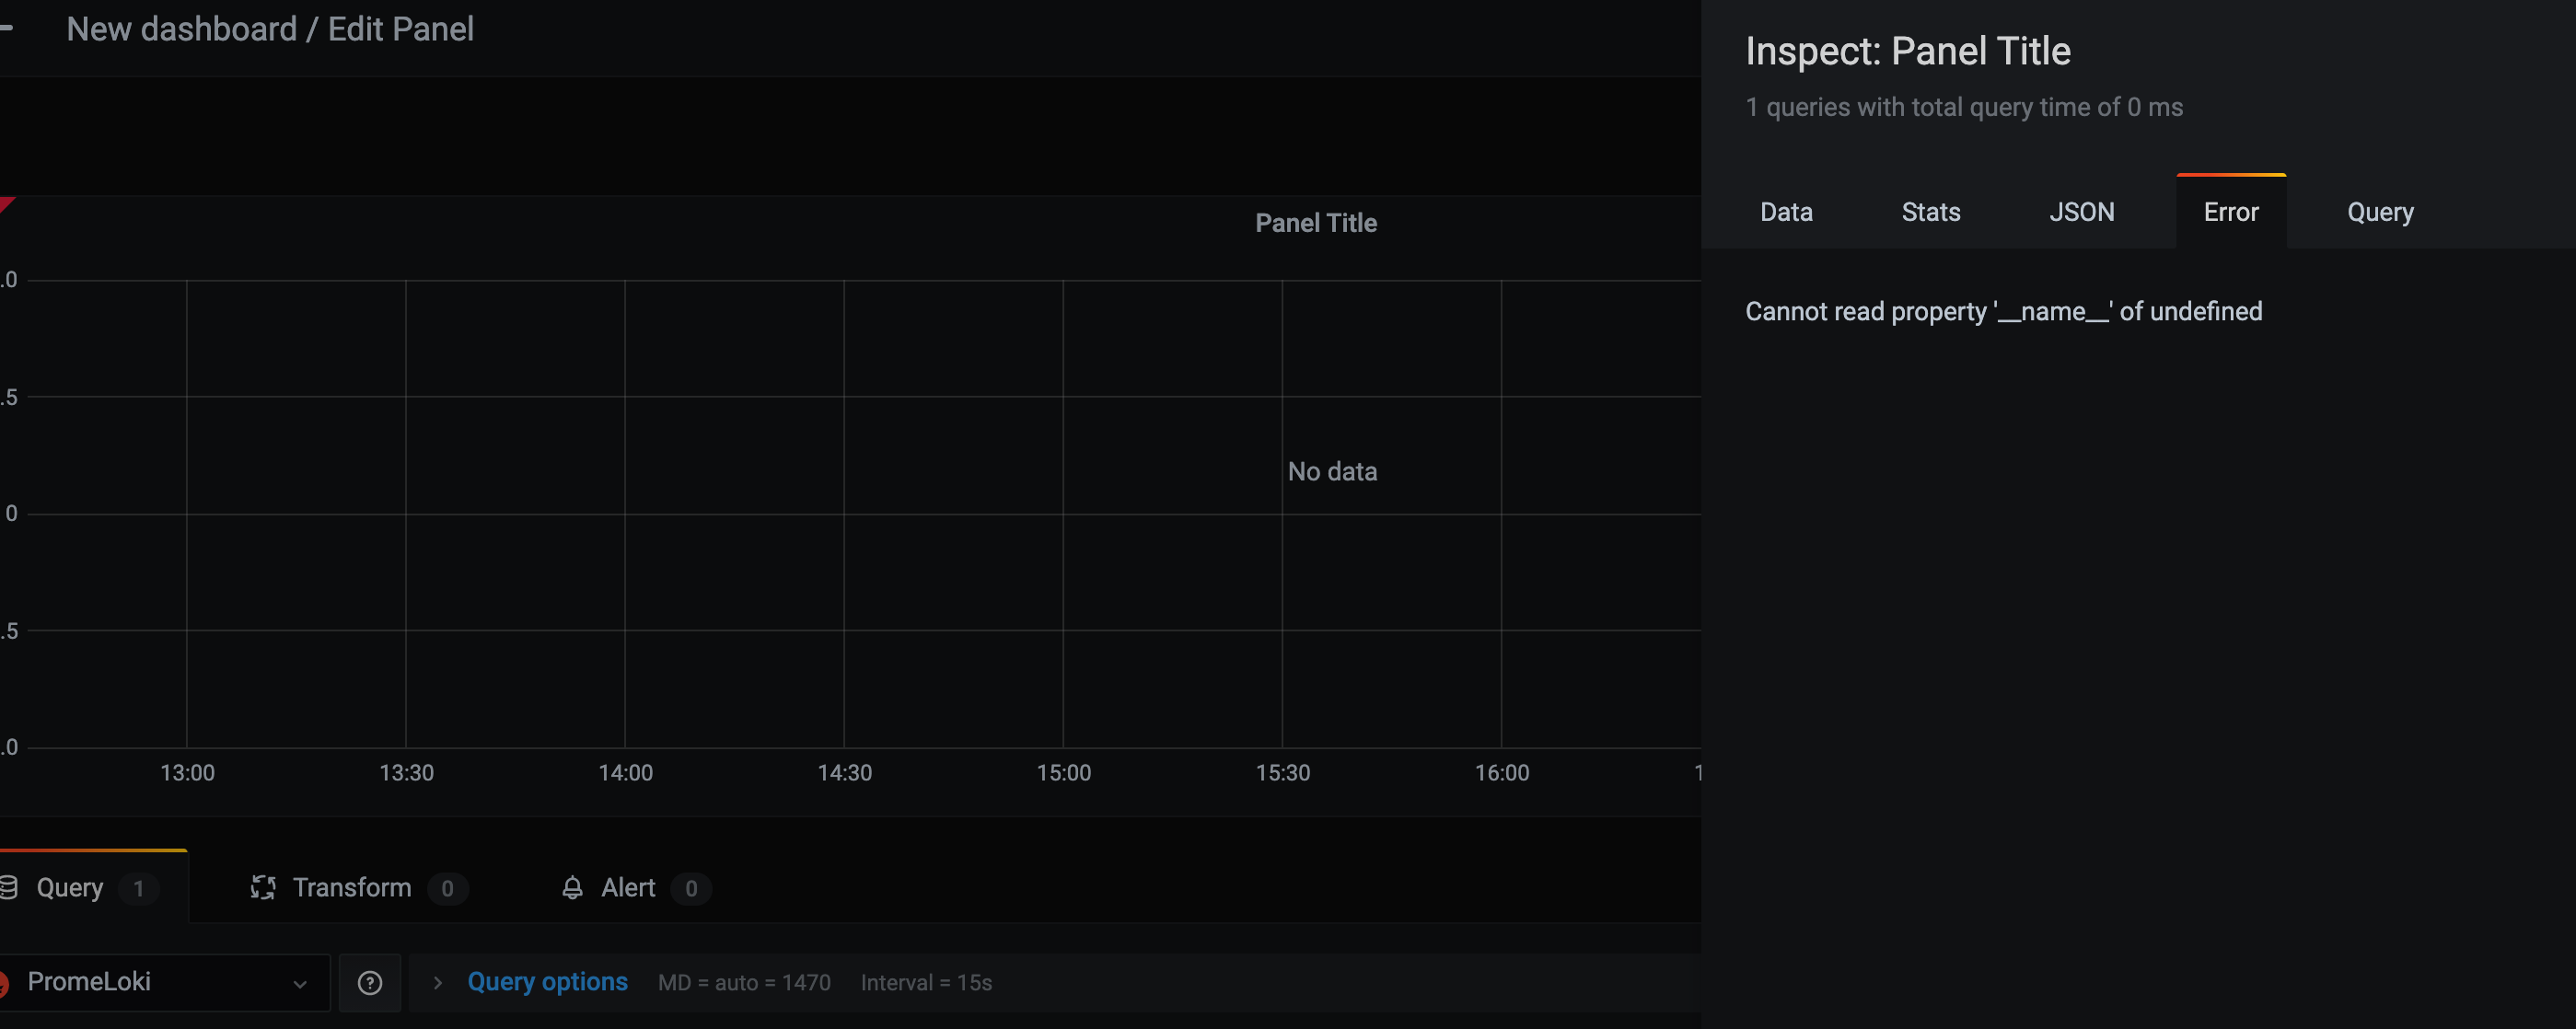
 coverthesea
on 11 Nov 2020
coverthesea
on 11 Nov 2020
Related issues
 bzon
·
5Comments
bzon
·
5Comments
 pandey-adarsh147
·
4Comments
pandey-adarsh147
·
4Comments
 gouthamve
·
4Comments
gouthamve
·
4Comments
 Horkyze
·
5Comments
Horkyze
·
5Comments
 setevoy2
·
4Comments
setevoy2
·
4Comments
Most helpful comment
Grafana alerting is only available for certain datasources. Even though Loki is not supported yet, Prometheus is supported. And Loki has a prometheus-compatible API, so you can add your Loki as a Prometheus datasource, see #1222. Then you need to set up logql queries that return timeseries and alert on those, e.g.,
count_over_time({job="foo"} |= "error" [5m]) > 0.Native alerting w/o the prometheus workaround is still under development.