Locust: stats - statistics are not precise because of rounding (i.e. 99th percentile sometimes has higher value than max)
Describe the bug
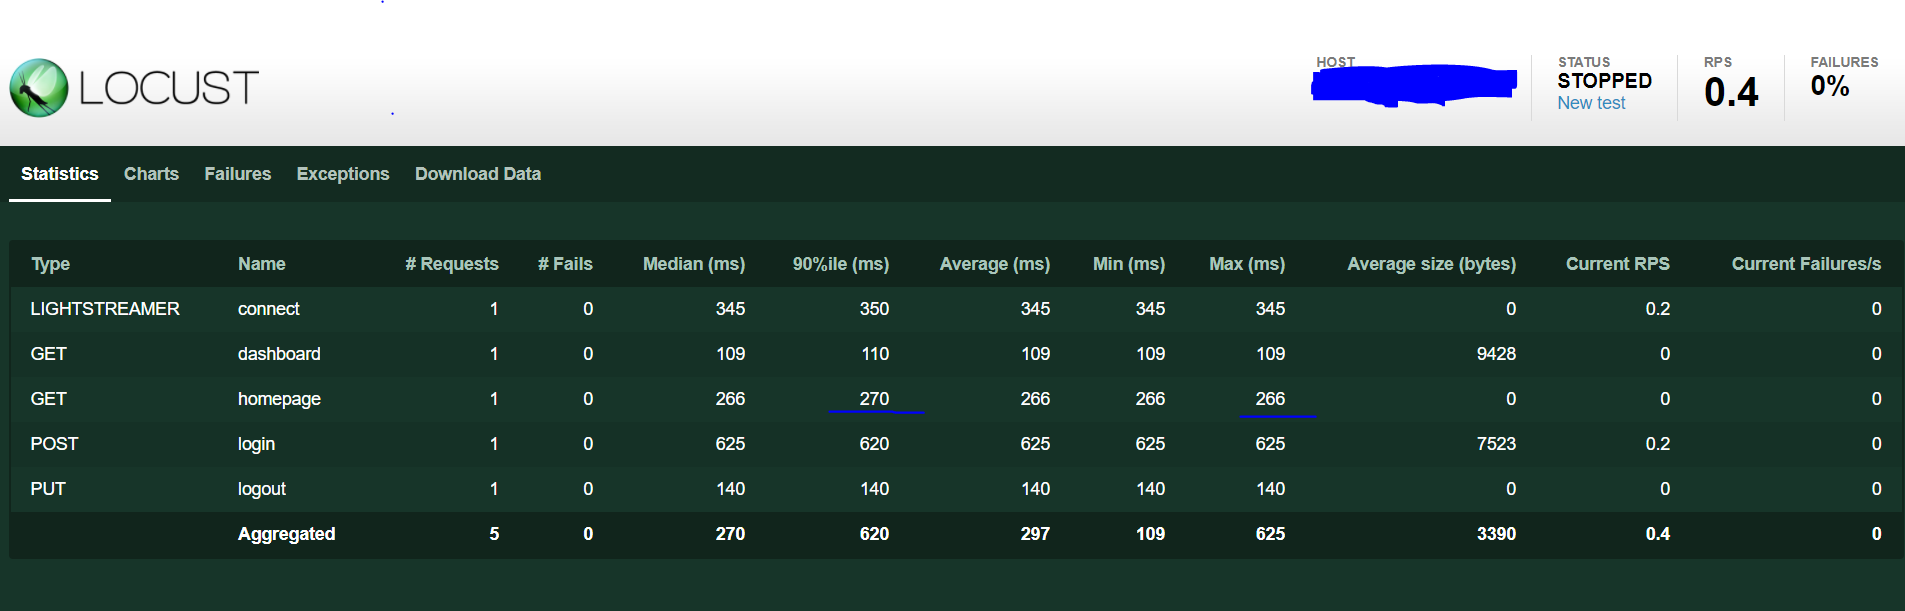
I'm extracting stats per item from environment.stats.entries where environment is locust.enc.Environment object.
From stats object I use max_response_time and get_reponse_time_percentile(0.99)
I noticed that sometimes value of 99th percentile has higher value than max_response_time - which is impossible.
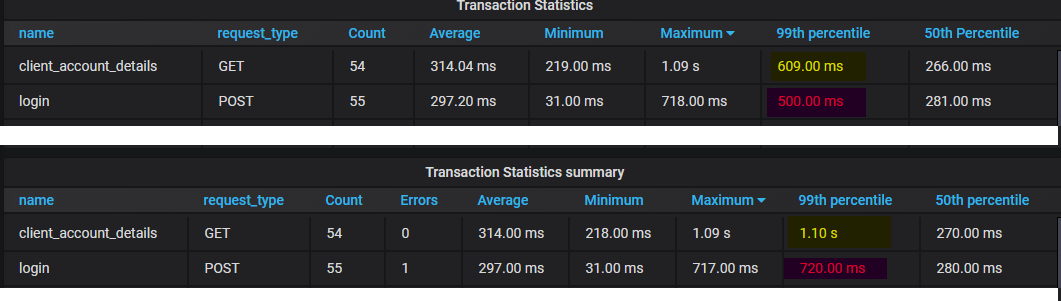
In general there are differences between statistics from Influx and from Locust generated for the same data
Expected behavior
All statistics return correct values
Actual behavior
Max value is sometimes bigger than some of the percentiles.
I observed the same issue on UI on 90th percentile (on screenshot GET homepage)
Stats calculated by Influx vs stats from Locust:

Steps to reproduce
run the test and observe the logs
Environment
- OS: Windows 10
- Python version: 3.8.5
- Locust version: 1.2.3
- Locust command line that you ran: locust -f locustfiles/
--skip-log-setup
 stanislawskwark
All 13 comments
percentiles are rounded (using buckets), so this is normal
 cyberw
on 16 Sep 2020
cyberw
on 16 Sep 2020
@cyberw if we compare summary data from Locust with RAW data (every sample) analyzed by Influx the outcome is totally different especially for 95/99 percentile. Are you sure this is expected behavior? The data is sometimes lower while sometimes higher so totally inconsistent.
Our IT department is using Influx/Prometheus to store statistics. Once we will compare Locust summary data with raw response times from app the outcome is that Locust summary data has a flaw. This will be causing questions is the tool reliable when it comes to other statistics. We really doubt that Influx would have any flaw in percentiles calculation
Top result is raw data analyzed by Influx lower graph is data extracted from the summary. The 50th percentile is almost same those higher ones have problem.
 domik82
on 17 Sep 2020
domik82
on 17 Sep 2020
Hi @domik82 ! Sounds like a different issue from what @stanislawskwark is talking about. If you can make a detailed log (the full csv with every request) and find there is a significant discrepancy, please add it here, or file a separate issue.
cyberw
on 17 Sep 2020
@cyberw - we work together with @stanislawskwark so let us rephrase the original issue. The most obvious discrepancy was that p99 is higher than max but all in all, there are huge differences in the way it's being calculated. I'll work with Stanislaw to extract the samples from Influx as we don't store csv at all.
domik82
on 17 Sep 2020
If you do find a bug, be prepared to need to fix it yourselves (in https://github.com/locustio/locust/blob/master/locust/stats.py), as I dont really use the built in stats aggregation (because I use locust-plugin's external logging/stats analysis in Timescale/Grafana)
cyberw
on 17 Sep 2020
@cyberw we also do have our own implementation for sending sample statistics to Infux using Kafka (Locust -> Kafka -> Telegraf -> Influx) and then plot it on Grafana. Kafka is used as a metric buffer so Influx will not go down due to excessive load. We wanted to extract summary data from Locust and store it instead of doing a query to influx for aggregated data. This was the first sanity check if we see the same output. Not sure how much time would it take to analyze current solution for us it might be way quicker to do the query on our own. The benefit of the summary is that we have seen that some of the samples got lost so sanity check if summary from Locust has overall number same was beneficial.
domik82
on 17 Sep 2020
Cool stuff. If you decide you want to open source your solution, PRs to locust-plugins are most welcome :)
cyberw
on 17 Sep 2020
Btw, are you doing crazy amounts of requests/loggings?
I've done direct logging to Timescale (and previously Influx) and never really seen it be a bottleneck, as long as the writes are properly batched (you can check out the implementation in locust-plugins for inspiration if you want to try a more naive/simple approach)
cyberw
on 17 Sep 2020
Attaching csv with data for which locust produced statistics mentioned above
data.zip
stanislawskwark
on 17 Sep 2020
@cyberw you would have to define crazy ;) we are still at a very early stage when it comes to Locust. It really depends on how we will count it down probably later in the year bare minimum will be 1000 samples/s. From what I know Influx heavly depends on the disk/CPU in our case it's virtual machine with as minimum resources as possible ;) This approach is common in our company for storing metrics so we just applied the solution to the existing infrastructure. Normally no one writes directly to influx.
domik82
on 17 Sep 2020
👍 Yea I seem to remember the limit for our influx being something like 4000/s. I just hate complicated infrastructure :P
cyberw
on 17 Sep 2020
@cyberw after analyzing code you pointed out we found that the way we report things to influx will be impacted. I'm seeking a bit of guidance how to work out the proper solution. We wrote the code to be executed on master node but based on the code it seems that the buckets will be created on the workers. Therefore there seem to be only two options for us to properly address it.
One introduce a feature toggle in Locust that would allow to use RAW data samples on master node. The impact will be that without buckets quite a lot of data would be flowing in the ZMQ as well the dictionary that is used there to store the data will become quite big. So overall Locust itself might slow down.
Second approach would be to move the reporting to the workers but we lose the feature that the Java client (Swarm) that we also use would have to have it's own implementation of sendings stats what is a pain.
Do you have any other ideas?
domik82
on 21 Sep 2020
based on the code it seems that the buckets will be created on the workers
I honestly dont know, as I didnt write that code :)
One introduce a feature toggle in Locust that would allow to use RAW data samples on master node
Not sure I think that is a good idea. I much prefer the slaves reporting individual samples somewhere else (like in TimescaleListener). But it might have its uses. I guess it depends on how much code you'd need to modify.
Second approach would be to move the reporting to the workers but we lose the feature that the Java client (Swarm) that we also use would have to have it's own implementation of sendings stats what is a pain.
Is there any particular reason you have to use the Java client?
cyberw
on 21 Sep 2020
Related issues
 styk-tv
·
3Comments
styk-tv
·
3Comments
 pawlaguna
·
4Comments
pawlaguna
·
4Comments
 foxracle
·
3Comments
foxracle
·
3Comments
 max-rocket-internet
·
3Comments
max-rocket-internet
·
3Comments
 wosc
·
3Comments
wosc
·
3Comments