Locust: Strange behavior of "Total Requests per Second" chart
Description of issue
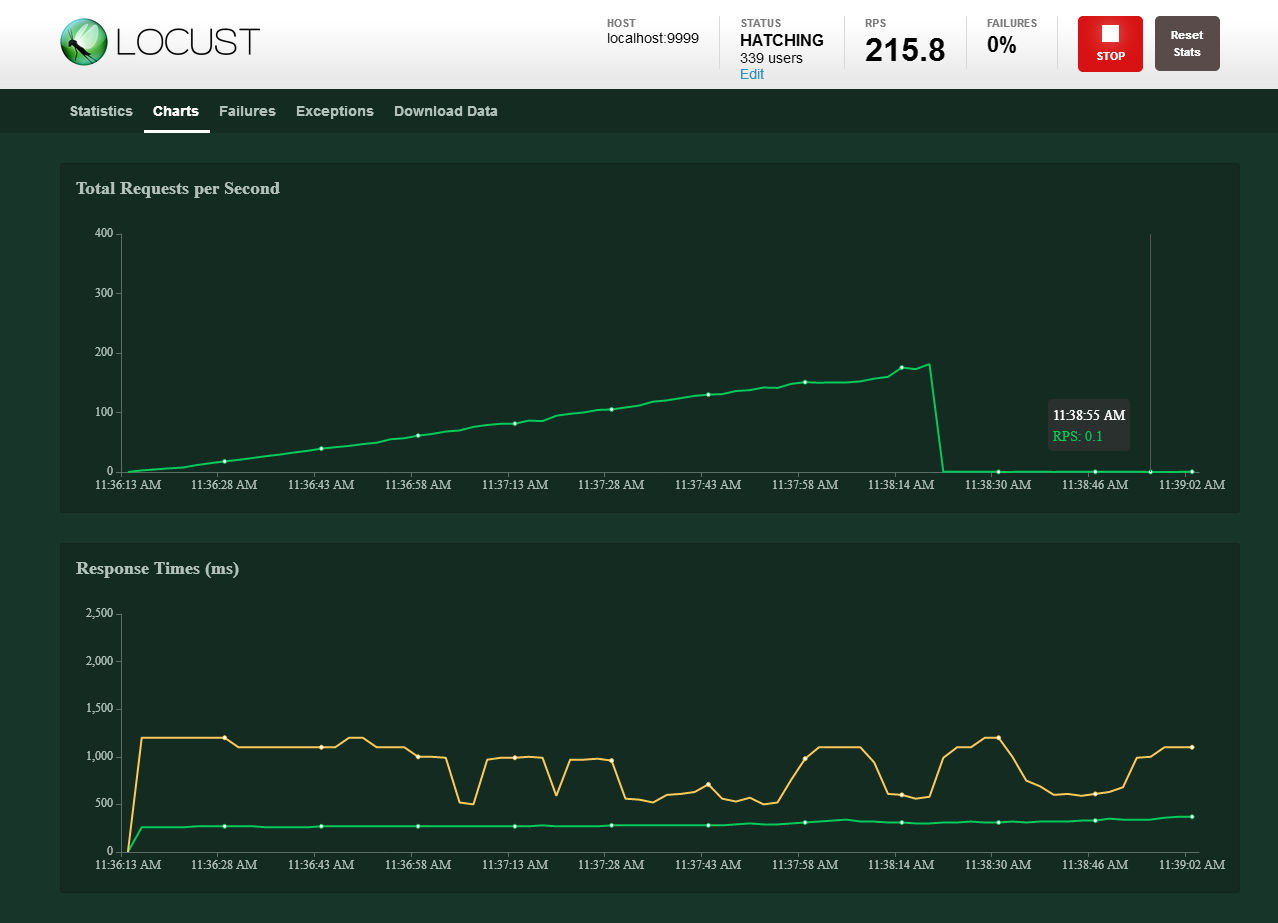
Total Requests per Second's RPS drop to below 1 after the test start a while despite the RPS number on top keep rising
Expected behavior
The RPS of Total Requests per Second chart should keep updating according to the RPS number on top
Actual behavior
The RPS of Total Requests per Second chart value does not match the RPS number on top after the test start a while
Environment settings (for bug reports)
- OS: Ubuntu 16.04.3 LTS (GNU/Linux 4.4.0-78-generic x86_64)
- Python version: 2.7.12
- Locust version: 0.9.0
Steps to reproduce (for bug reports)
I don't know what to put here but feel free to ask for any extra information. I can't provide the code though
Screenshot
P/s: Sorry for ignored the template.
 hoangphucITJP
All 8 comments
I have also encountered this issue. I dug into the responses and it's happening because the /stats/request endpoint stops returning the "Total" stat block at the end of the stats list. This then causes the graph to show a RPS from a random path instead of from the total like it should. Interestingly, as is shown in the screenshot from @hoangphucITJP, the RPS in the header is still correct.
I tried to dig into the Python code and figure out what's causing it there, but haven't had much success there yet (mostly b/c I'm only running this in AWS, not locally so my debugging options are somewhat limited).
Please let me know if there's any suggestions as to how to solve this or any other debugging information I can provide.
 klloveall
on 7 Feb 2019
klloveall
on 7 Feb 2019
@cgoldberg I think my simple change should work as a fix (it has solved the issue for me). Thanks.
 supermasita
on 9 Mar 2019
supermasita
on 9 Mar 2019
@hoangphucITJP @klloveall - let me know if manually applying my change fixes your issue. I think my PR is correct, but it is not building for unrelated reasons. Thanks.
supermasita
on 12 Mar 2019
we are also facing this issue, when is the PR supposed to be merged?
 sweetib
on 24 Jun 2019
sweetib
on 24 Jun 2019
any update for this issue ?
 victor61zhong
on 12 Sep 2019
victor61zhong
on 12 Sep 2019
I also see the RPS drop off as shown in the graph every time we run Locust. It makes tracking the average RPS value over a run very hard without it working.
 canstudios-simonm
on 1 Oct 2019
canstudios-simonm
on 1 Oct 2019
I cant reproduce this (on MacOS, using locust 0.12.1). Is this only an issue on Linux? Or is it something related to the test plan?

 cyberw
on 20 Oct 2019
cyberw
on 20 Oct 2019
I believe this could have the same cause to #1060 which has now been fixed.
 heyman
on 20 Oct 2019
heyman
on 20 Oct 2019
Related issues
 bgenchel
·
3Comments
bgenchel
·
3Comments
 ShaolongHu
·
3Comments
ShaolongHu
·
3Comments
 dolohow
·
3Comments
dolohow
·
3Comments
 ghost
·
3Comments
ghost
·
3Comments
 wosc
·
3Comments
wosc
·
3Comments