Locust: Question: debugging in pycharm (or other arbitrary IDE)
Hello, so quick question. I have locust installed in a venv on python 3 (locustio==0.8a2). I've been building and testing a locust python script, but I'm trying to traverse some complicated json responses. In order to run a locust script, you have to run locust loadtest-file.py
Is it possible to attach a debugger while running a locust script?
 paul-nelson-baker
All 10 comments
not really an answer, but a few comments:
Is it possible to attach a debugger while running a locust script?
I've been building and testing a locust python script, but
a locustfile is a normal python file, so you can debug it directly without the rest of the framework. It's easier to debug a single Locust than a swarm.
I'm trying to traverse some complicated json responses.
add code so your Locust class gets created when locustfile is run as a script (not imported) ... you can usually do most script development against a single instance of a Locust.
 cgoldberg
on 27 Jun 2017
cgoldberg
on 27 Jun 2017
Took me a minute to get there (specifically to realize I had to call .run()) so I figured I'd share:
I create a subclass of HttpLocust called WebsiteUser. To execute a single instance from the CLI, I added:
if __name__ == '__main__':
    x = WebsiteUser()
    x.run()
Then run python locustfily.py. If I have a pdb breakpoint in one of my tasks, this triggers the breakpoint. Full example locustfile.py:
from locust import HttpLocust, TaskSet, task

class UserBehavior(TaskSet):
    @task
    def index(self):
        import pdb; pdb.set_trace()
        self.client.get("/")

class WebsiteUser(HttpLocust):
    task_set = UserBehavior
    host = 'http://google.com'
    min_wait = 1000
    max_wait = 2000

if __name__ == '__main__':
    WebsiteUser().run()
 MattF-NSIDC
on 20 Oct 2017
MattF-NSIDC
on 20 Oct 2017
Here I managed to get Intellij Idea (Similar to PyCharm) to break while locust is running.
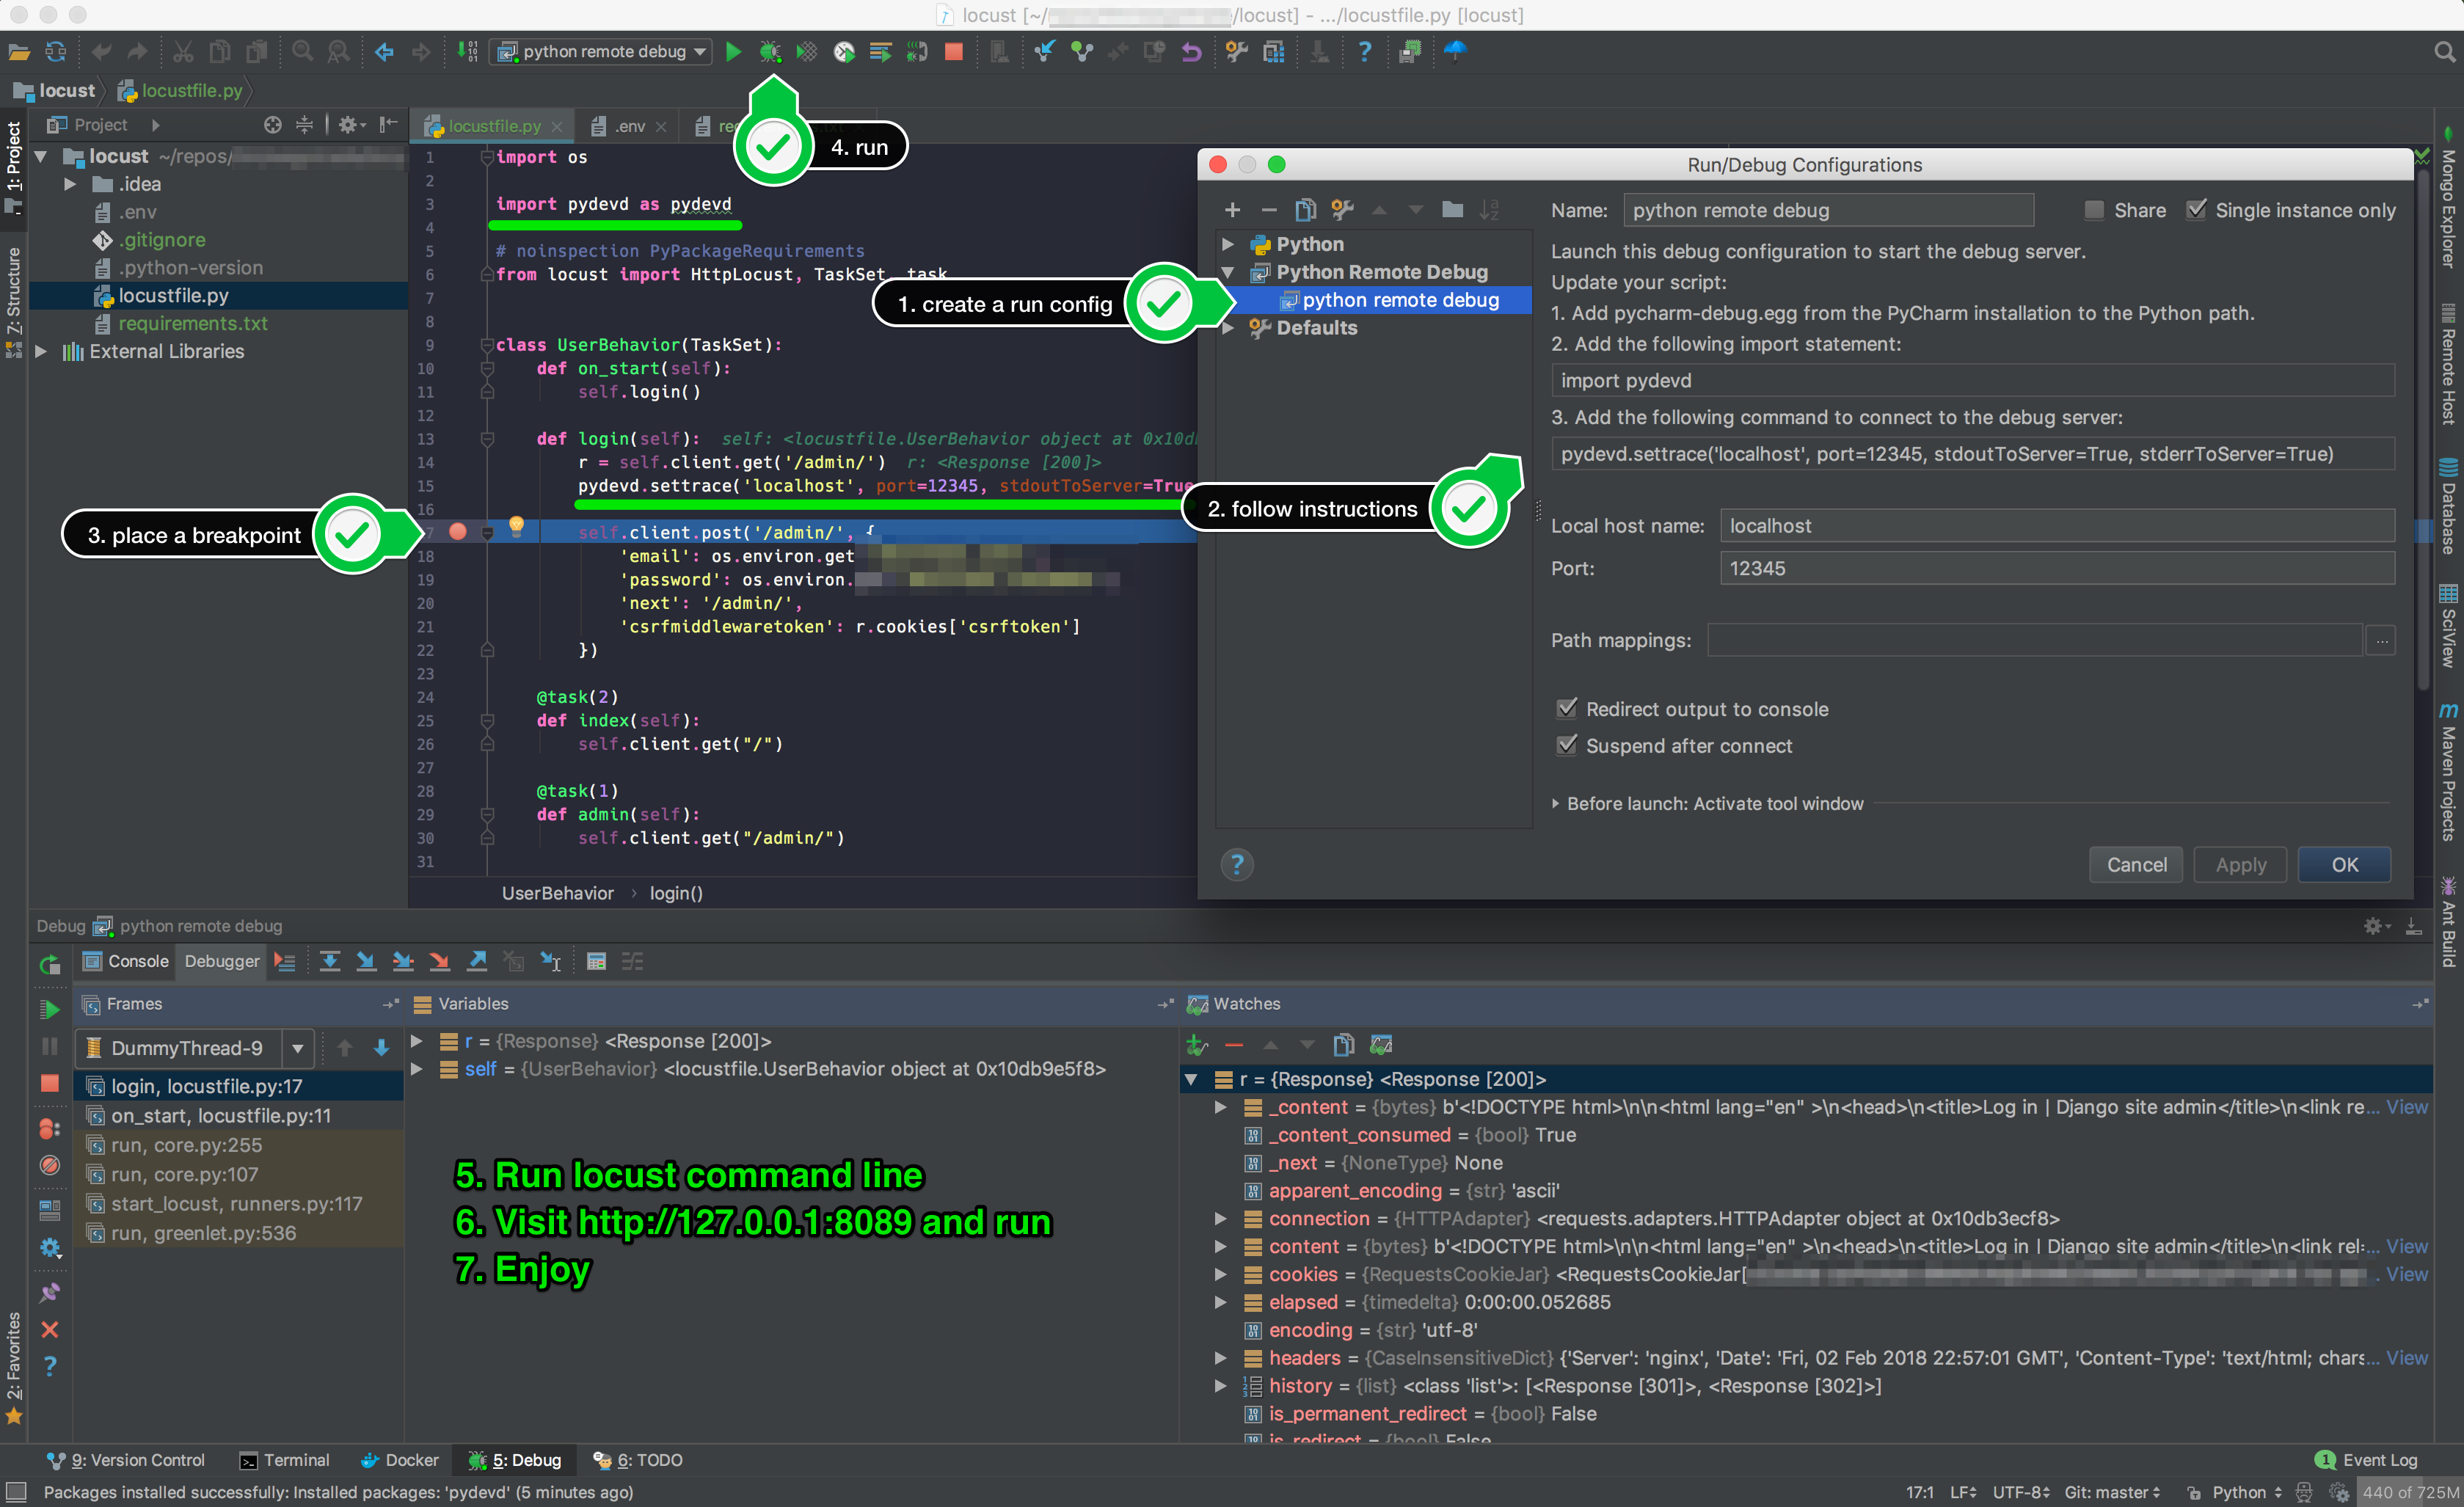
I used python remote debug run configuration, followed instructions. In my case, I just used a virtualenv and installed locustio and pydevd directly. 🎉
It should break automatically right under the following line (I think break point is optional):
pydevd.settrace('localhost', port=12345, stdoutToServer=True, stderrToServer=True)
👍
 GabLeRoux
on 3 Feb 2018
GabLeRoux
on 3 Feb 2018
- Turn on the gevent compatible option in the debugger
- Run the locust executable as the script, (
which locust)
This seems to work for me. Also, note that the remote debug suggestion above requires a paid version of PyCharm or its cousin of a plugin in IntelliJ. I think the steps I have above will work for PyCharm CE as well.
 nelsonjchen
on 10 Jul 2018
nelsonjchen
on 10 Jul 2018
is there a similar tip for visual studio code ?
 ad34
on 20 Nov 2018
ad34
on 20 Nov 2018
just to add to what @nelsonjchen has stated, for IntelliJ set the "Script path" to what which locust returns from the command line then set the "Parameters" to -f script_you_want_to_debug.py --host http://whatever. you should be able hit breakpoints where you placed them in script_you_want_to_debug.py
 dalegaspi
on 19 Feb 2019
dalegaspi
on 19 Feb 2019
@ad34
is there a similar tip for visual studio code ?
This is what I put in my .vscode\launch.json
{
    "version": "0.2.0",
    "configurations": [
        {
            "name": "Locust",
            "type": "python",
            "request": "launch",
            "module": "locust",
            "args": [
                "-f",
                "${file}",
            ],
            "gevent": true,
            "console": "integratedTerminal"
        }
    ]
}
You can parameters to the args array, if you want an headless experience, set user and hatche rate, the host, etc.
 r3dlin3
on 7 Aug 2020
r3dlin3
on 7 Aug 2020
Debug doesn't work in locust >= 1.2.3
To enable debug add env variable:
GEVENT_SUPPORT=True
 ffedoroff
on 7 Oct 2020
ffedoroff
on 7 Oct 2020
In locust-plugins you can find debug example:
https://github.com/SvenskaSpel/locust-plugins/blob/master/examples/debug_ex_advanced.py
ffedoroff
on 7 Oct 2020
I use Eclipse with Pydev. In Preferences->PyDev->Debug the 2nd to last option is "Gevent compatible debugging?".
Gevent has to do with the lightweight threading used by Locust ( greenlets ) and I am too ignorant to know much more than that. Once I clicked that, I was able to stop at a breakpoint in my code.
Thanks to all who provided the information and the person who wrote the Single User locust-plugin.
 GugliEyes
on 20 Oct 2020
GugliEyes
on 20 Oct 2020
Related issues
 YannickXiong
·
3Comments
YannickXiong
·
3Comments
 kowalcj0
·
3Comments
kowalcj0
·
3Comments
 ShaolongHu
·
3Comments
ShaolongHu
·
3Comments
 gboorse
·
3Comments
gboorse
·
3Comments
 walbx
·
4Comments
walbx
·
4Comments
Most helpful comment
Took me a minute to get there (specifically to realize I had to call
.run()) so I figured I'd share:I create a subclass of HttpLocust called WebsiteUser. To execute a single instance from the CLI, I added:
Then run
python locustfily.py. If I have apdbbreakpoint in one of my tasks, this triggers the breakpoint. Full examplelocustfile.py: