Lnd: LND 100% CPU Won't gracefully shutdown
Background
Been running a node with stable config for ~ 9months. After some moderate usage of ln-service calls to LND the node has become unresponsive to shutdown commands and is consuming 100% of the available CPU. Attempting to close the node results in it spamming this message: "2019-08-12 17:04:40.013 [INF] UTXN: NurseryReport: building nursery report for channel 398678968111a6ec1d8517f93b0d9ff229ca43e77677b530dcacc1c6ad6512d2:0"
Your environment
- lnd 0.7.1-beta`
- Ubuntu 18.04
- bitcoind 18.0
Steps to reproduce
I'm not entirely sure how to reproduce the issue. I am using a very normal lnd.conf (see attached) and simple grpc commands through ln-service. The ln-service calls I am using include:
decodePaymentRequest
pay
sendToChainAddress
subscribeToInvoices
createInvoice
createChainAddress
subscribeToChainAddress
Expected behaviour
LND should shutdown when ctrl+C is hit
Actual behaviour
LND spams the output:
"2019-08-12 17:04:40.013 [INF] UTXN: NurseryReport: building nursery report for channel 398678968111a6ec1d8517f93b0d9ff229ca43e77677b530dcacc1c6ad6512d2:0"
 MrRGnome
All 13 comments
Attempting to close the node results in it spamming this message: "2019-08-12 17:04:40.013 [INF] UTXN: NurseryReport: building nursery report for channel 398678968111a6ec1d8517f93b0d9ff229ca43e77677b530dcacc1c6ad6512d2:0"
This log only gets shown when calling the pendingchannels RPC.
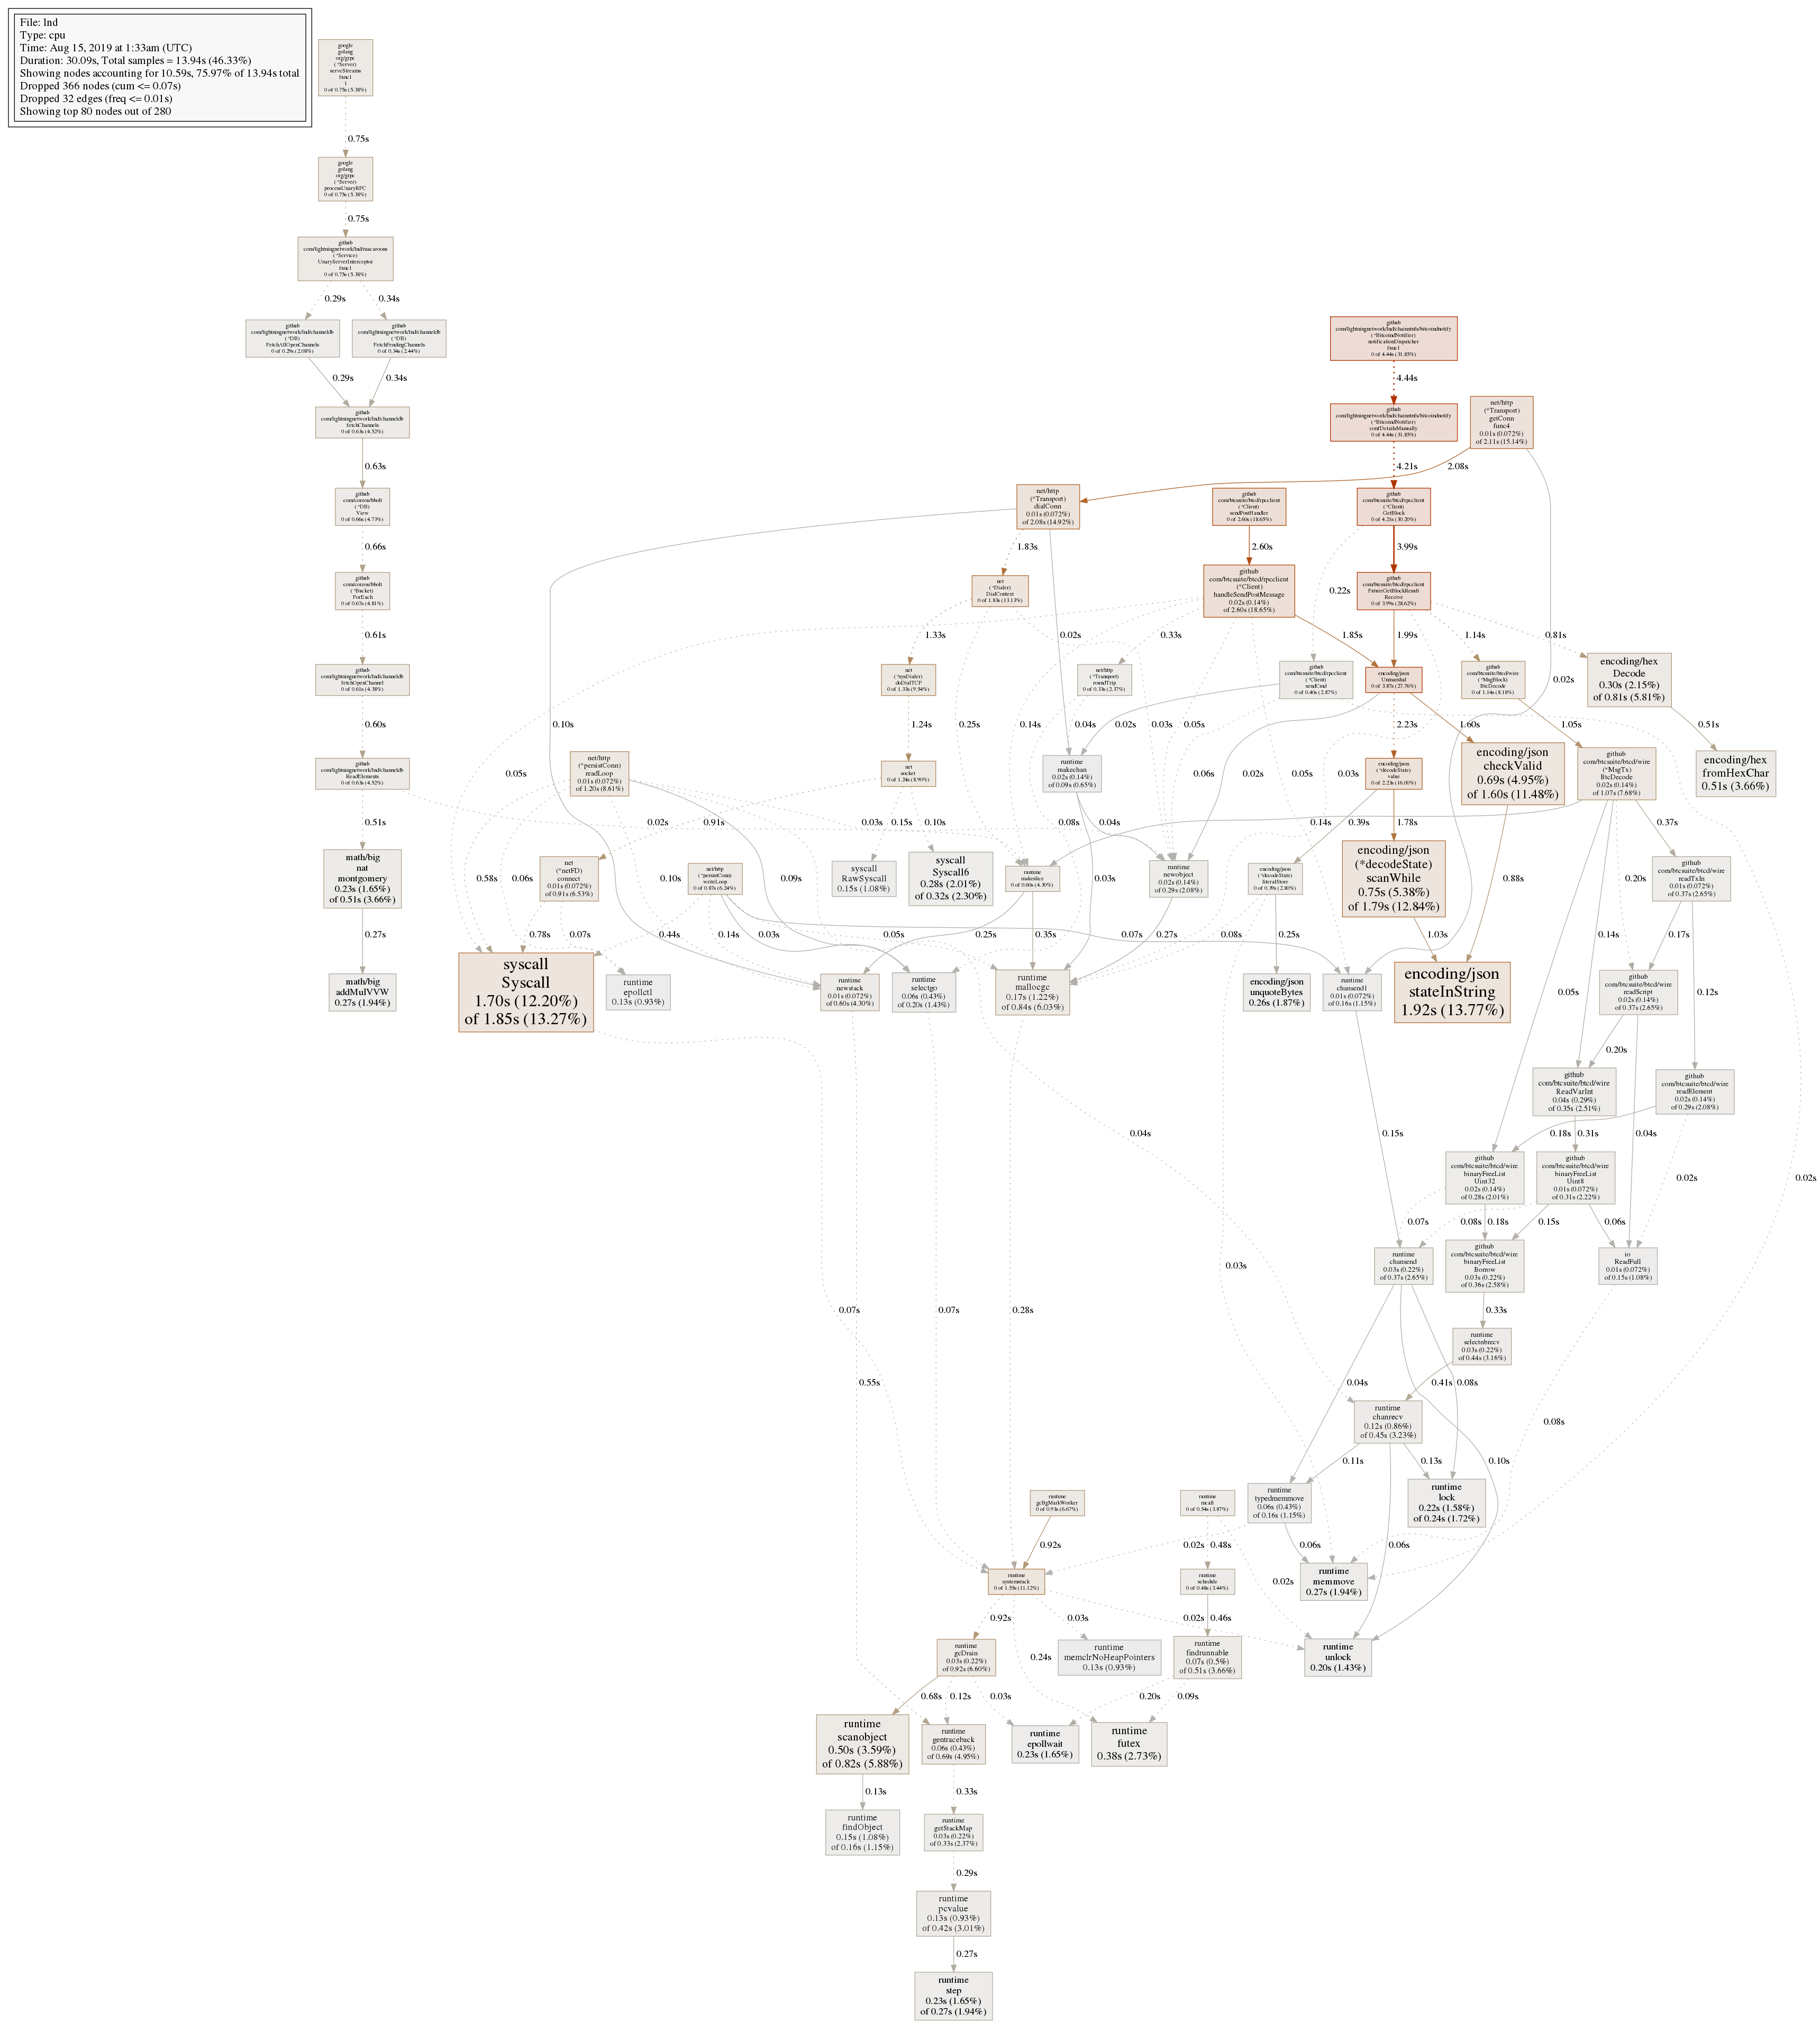
Would you be able to obtain a CPU profile? You'll have to enable profiling in lnd with the --profile=PORT flag and restart. Once done, you can run go tool pprof -png http://localhost:PORT/debug/pprof/profile. This will produce a PNG file which you can then include here.
 wpaulino
on 12 Aug 2019
wpaulino
on 12 Aug 2019
Thanks for the quick and helpful response. It should be noted the issue has yet to recur and I expect these CPU profiles to be within normal ranges.
I attempted to collect a CPU profile but ran into some strange issues. After installing the requisite go and graphviz dependencies and running the above command I was treated to a sea of the word "PuTTY" (my ssh client) on my terminal and little else. I do see it produced a file: pprof.lnd.samples.cpu.002.pb.gz which I assume is a precursor to the PNG which I have included here, but no PNG.
MrRGnome
on 13 Aug 2019
It should be noted the issue has yet to recur and I expect these CPU profiles to be within normal ranges.
Yeah they look fine indeed, thanks for providing the profile. There's not much we can do on our part unless you're able to reproduce the issue and collect a profile at that point.
wpaulino
on 14 Aug 2019
I except the best course in that case is to close this issue and reopen it should it present itself again.
It's a real pleasure working with the LND community, thanks for all the work you guys put in.
MrRGnome
on 14 Aug 2019
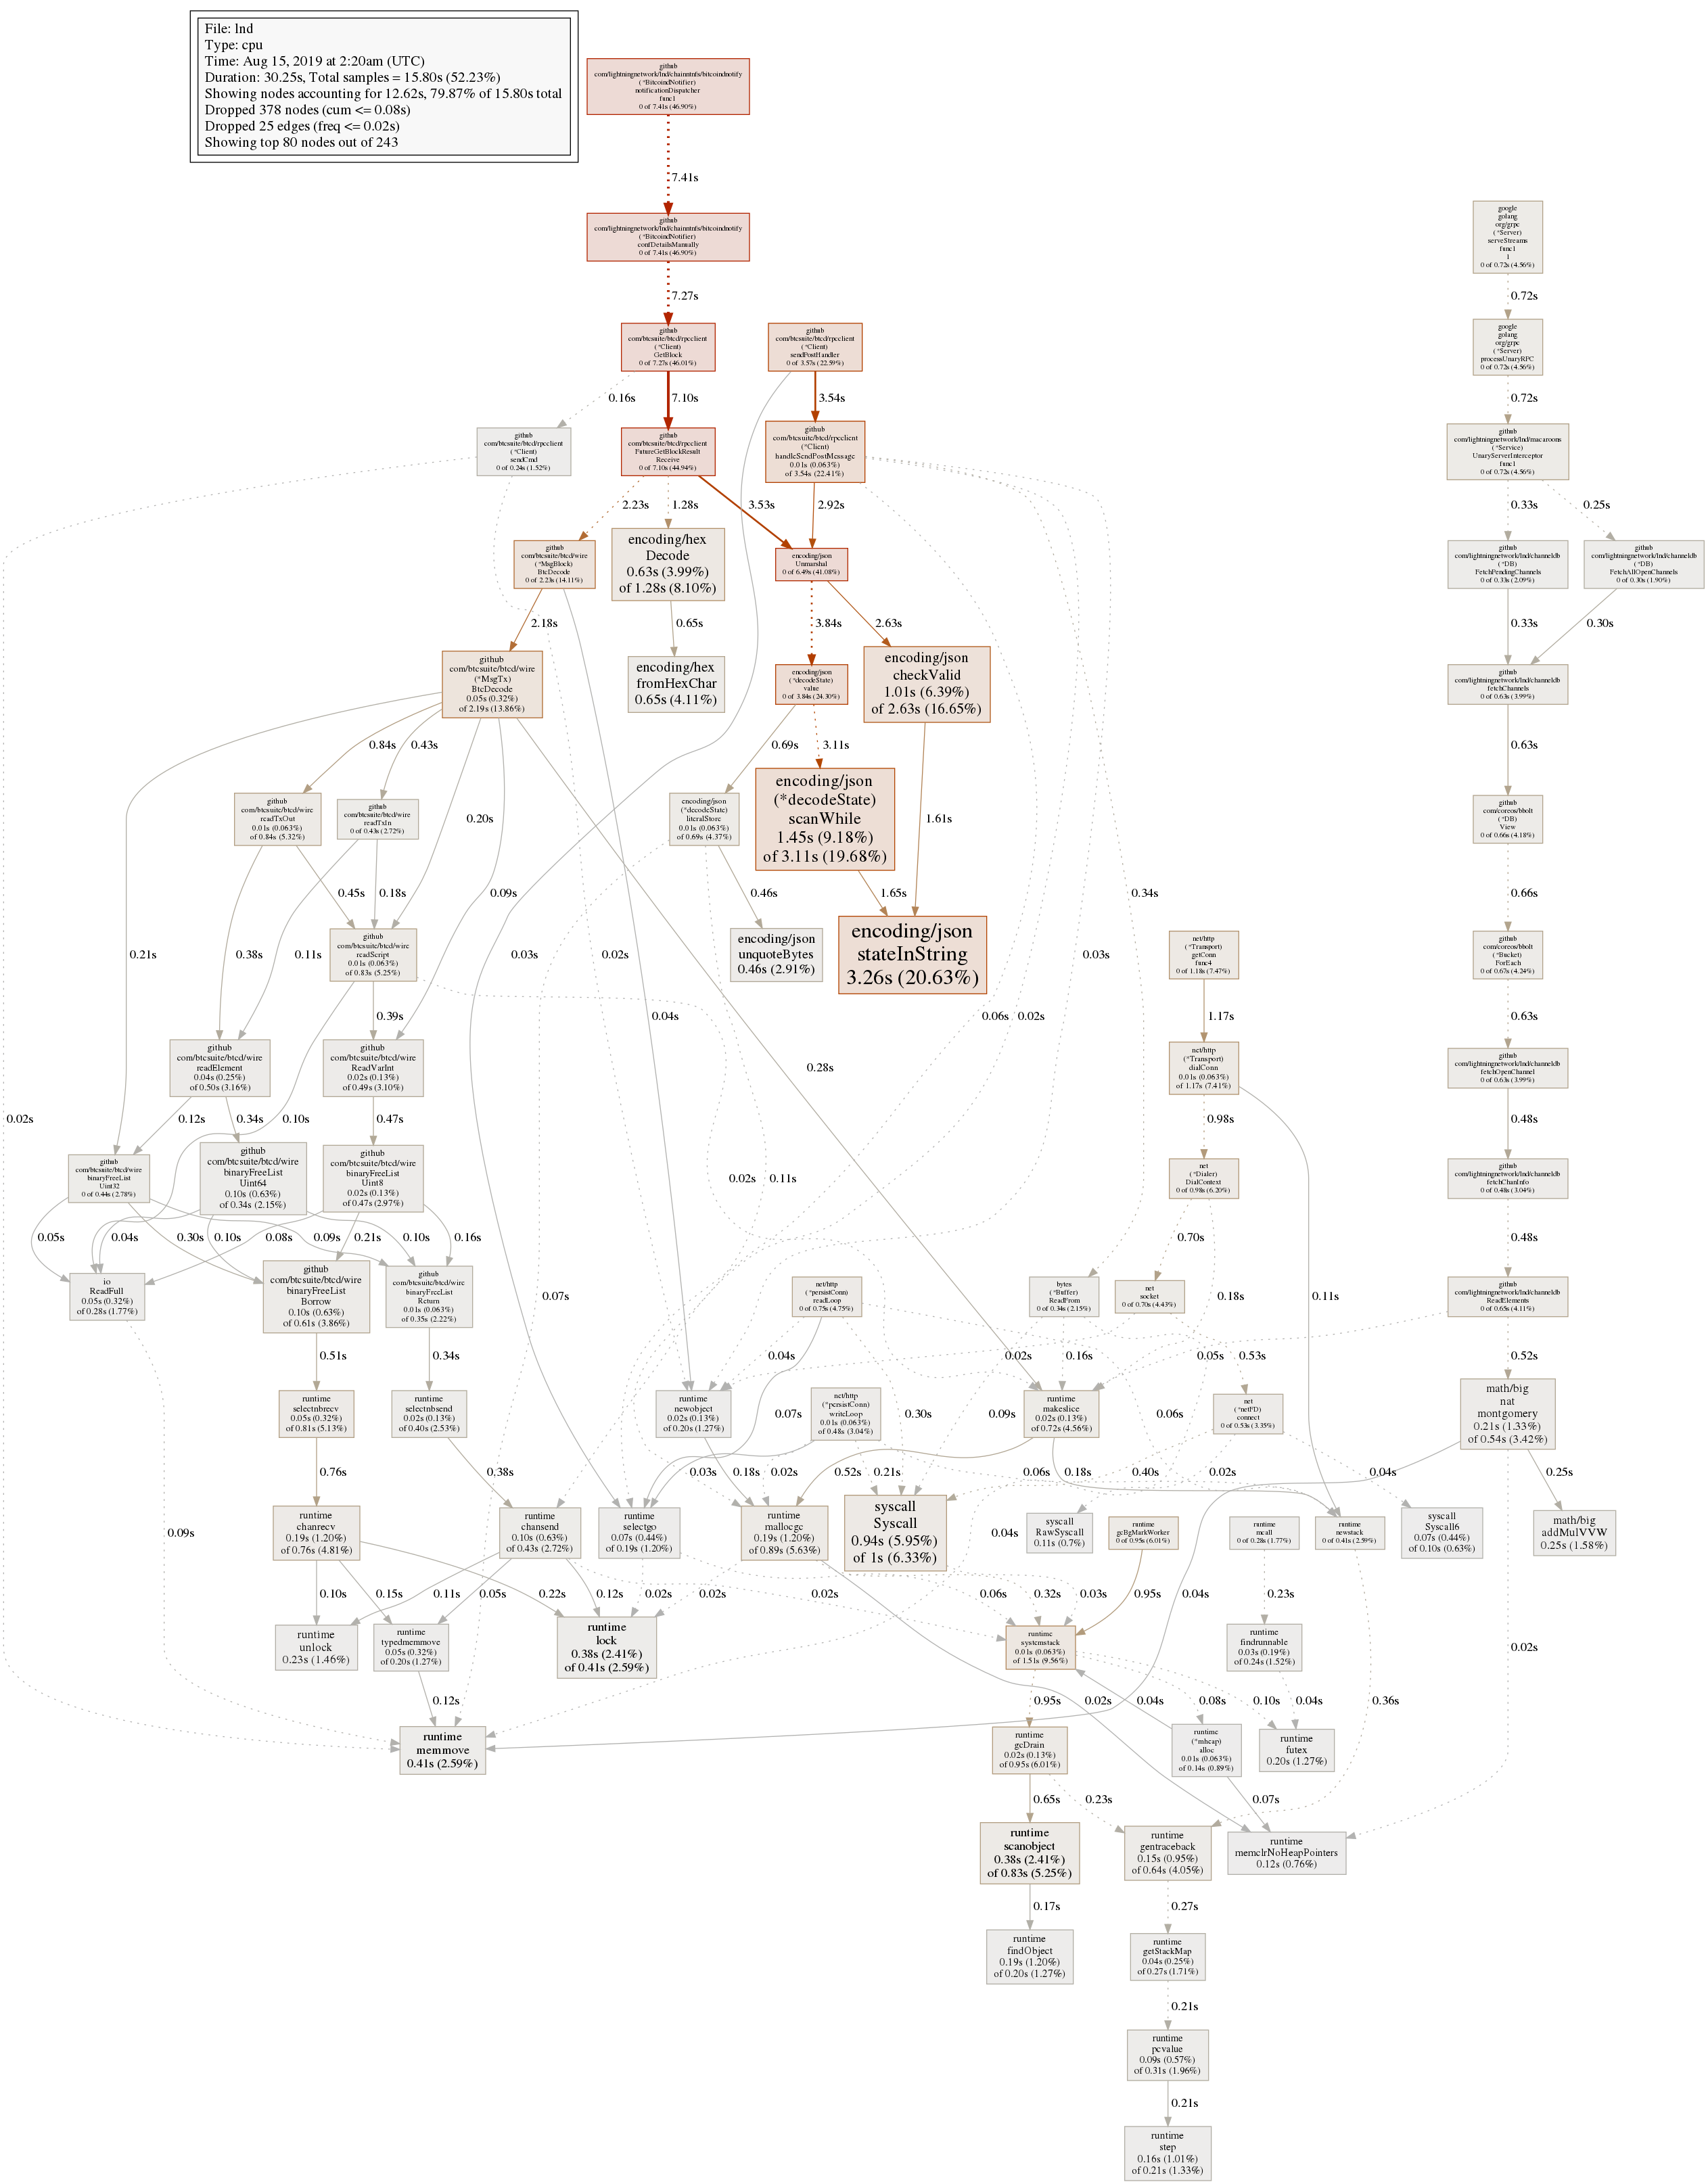
This issue has recurred with identical symptoms. Please reopen this issue and see the PNG's attached for cpu profiles as well as a log of the LND output. I noted that leading up to the issue LND and bitcoind CPU usage was rising consistently in a 2:1 LND:bitcoind ratio.
cpuprofile.png was when I first noticed significantly elevated CPU usage.
cpuprofile2.png was when I noticed maximum CPU usage consistently.
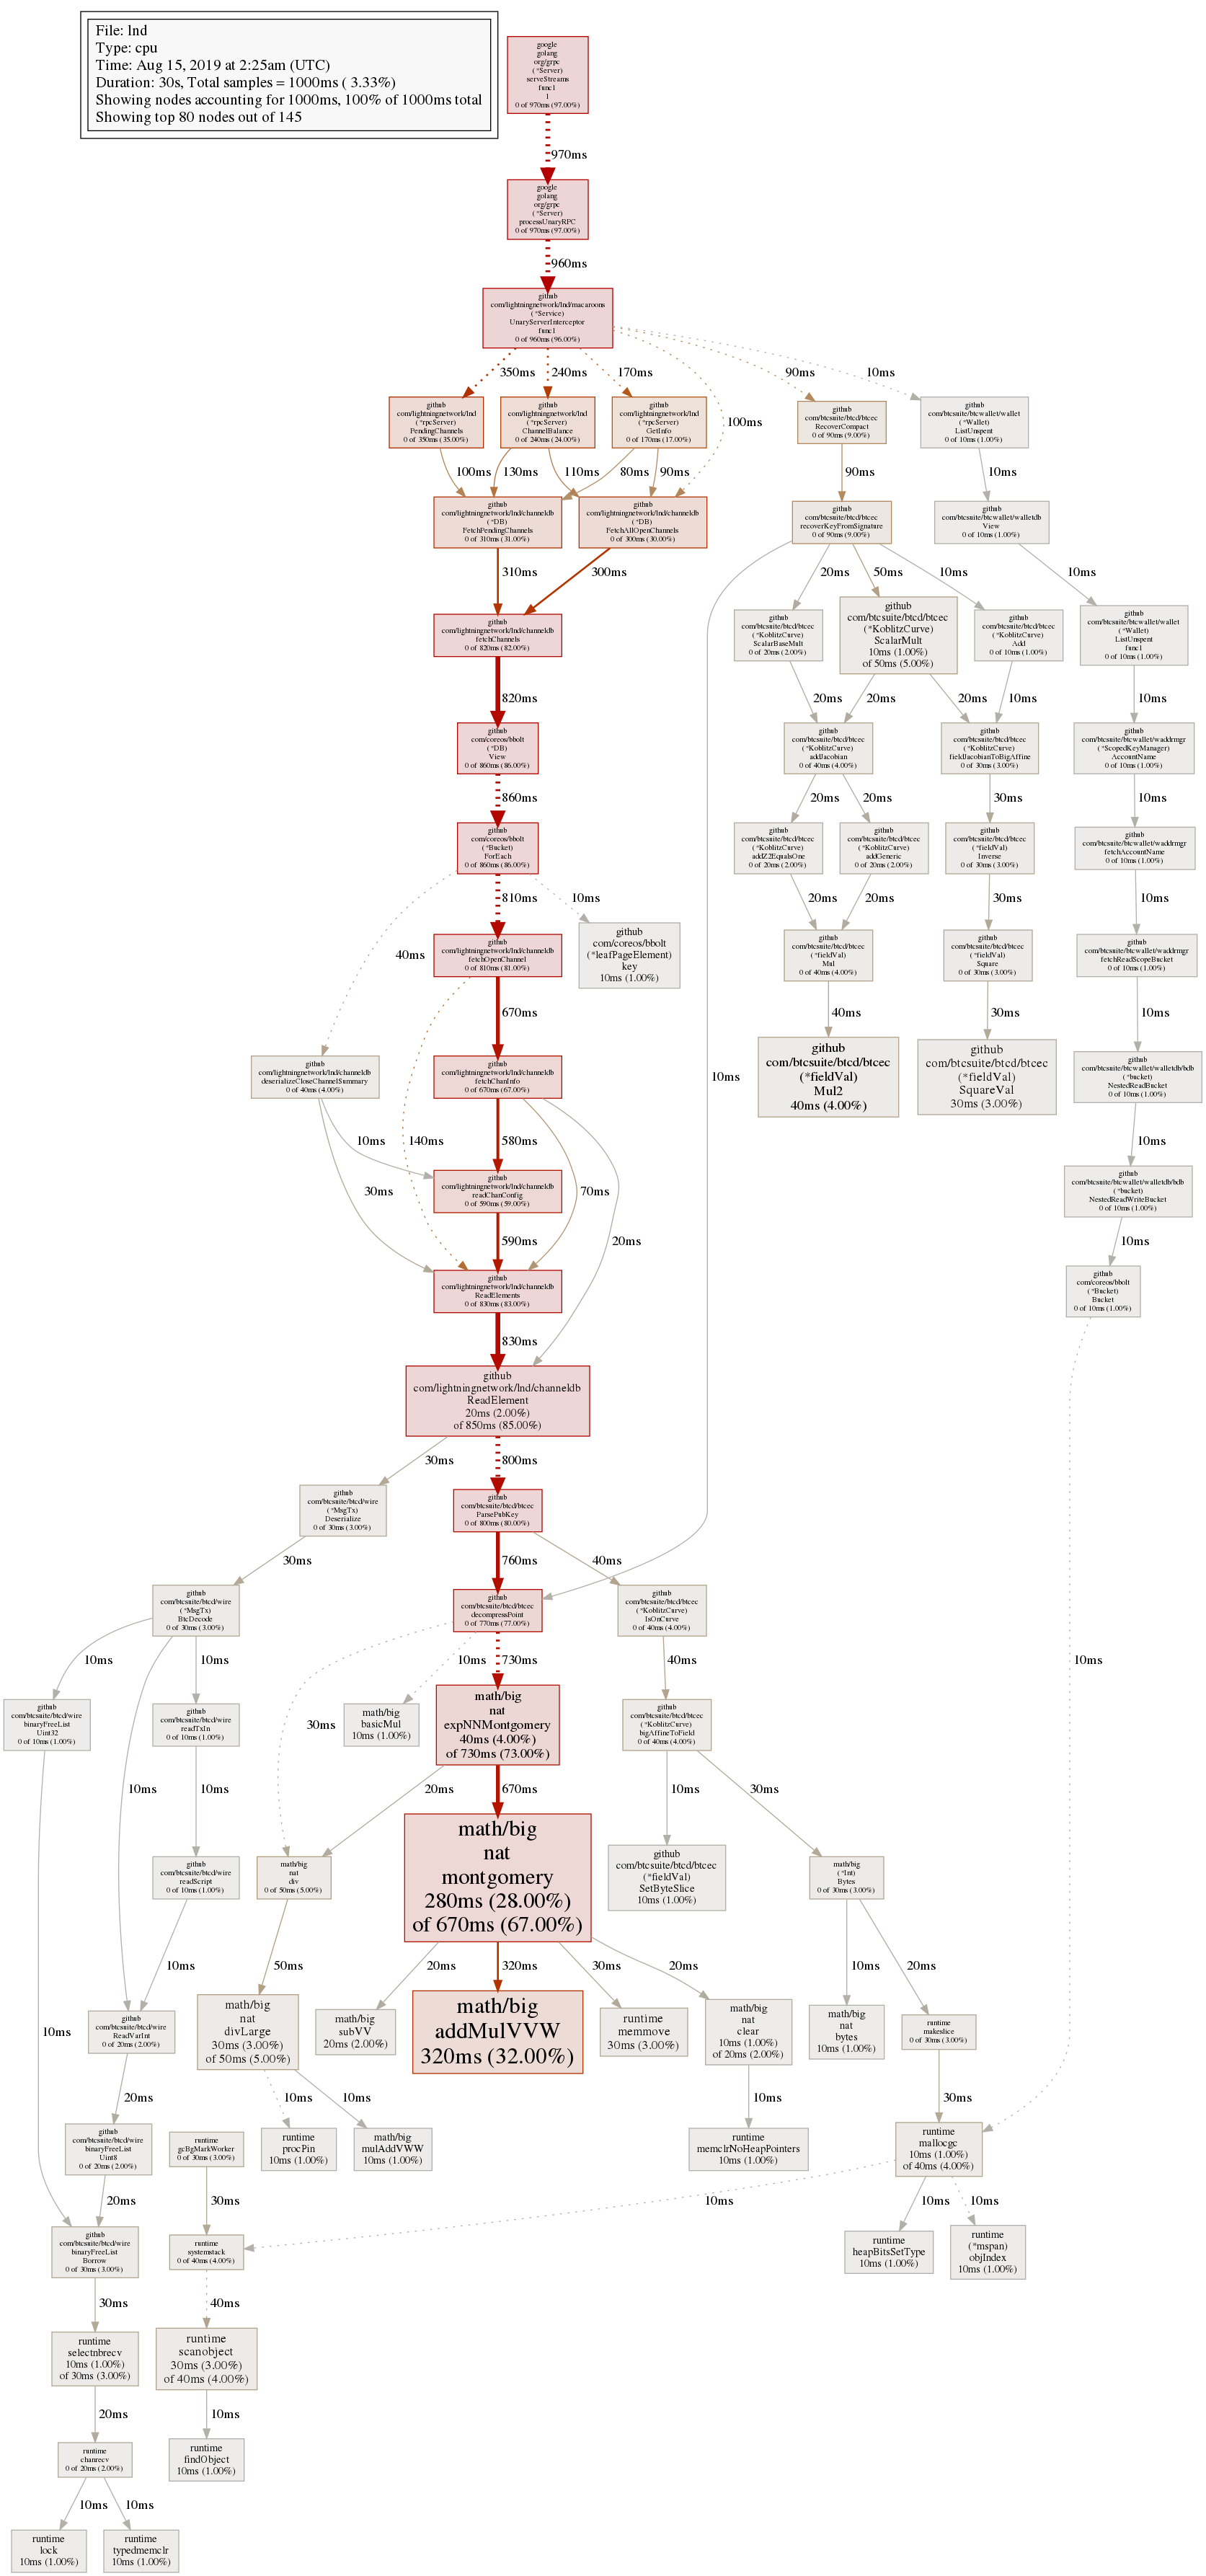
cpuprofile3.png was after I had attempted to shutdown LND with ctrl+c and failed
log.txt is the LND output immediately before, including, and after the ctrl+c interrupt attempt
 MrRGnome
on 15 Aug 2019
MrRGnome
on 15 Aug 2019
2019-08-15 02:24:35.034 [ERR] NTFN: Rescan to determine the conf details of script=OP_HASH160 6f5b27ed1b159f689cd817bb4ba52085dbe49273 OP_EQUAL within range 0-1574540 failed: chain notifier shutting down
2019-08-15 02:24:36.884 [ERR] NTFN: Rescan to determine the conf details of script=OP_HASH160 114d2980190242e48576595012457ac24c39b83e OP_EQUAL within range 0-1574541 failed: chain notifier shutting down
2019-08-15 02:24:39.313 [ERR] NTFN: Rescan to determine the conf details of script=OP_HASH160 fba83c1f638d48961d52746912f6690a28579a08 OP_EQUAL within range 0-1574541 failed: chain notifier shutting down
2019-08-15 02:24:41.078 [ERR] NTFN: Rescan to determine the conf details of script=OP_HASH160 aa6504ab417c41c71681358e9f1a225666fd7296 OP_EQUAL within range 0-1574540 failed: chain notifier shutting down
2019-08-15 02:24:41.222 [ERR] NTFN: Rescan to determine the conf details of script=OP_HASH160 49e3ffff695e352c11f19b24d551230526823808 OP_EQUAL within range 0-1574543 failed: chain notifier shutting down
2019-08-15 02:24:42.649 [ERR] NTFN: Rescan to determine the conf details of script=OP_HASH160 2442698fe89424a836811106238c11fb4557d9a5 OP_EQUAL within range 0-1574539 failed: chain notifier shutting down
2019-08-15 02:24:43.423 [ERR] NTFN: Rescan to determine the conf details of script=OP_HASH160 6208b654f300d80832357a581d218f7326de15e9 OP_EQUAL within range 0-1574542 failed: chain notifier shutting down
2019-08-15 02:24:43.615 [ERR] NTFN: Rescan to determine the conf details of script=OP_HASH160 b7f5a973cdc98edb80fc51363843b4587fe42438 OP_EQUAL within range 0-1574542 failed: chain notifier shutting down
2019-08-15 02:24:45.603 [ERR] NTFN: Rescan to determine the conf details of script=OP_HASH160 59ebcf4ecd8cfaa9c878231f3d12bdedcf5e103a OP_EQUAL within range 0-1574538 failed: chain notifier shutting down
2019-08-15 02:24:48.093 [ERR] NTFN: Rescan to determine the conf details of script=OP_HASH160 65fb0410c18875f2e874cc6335b04212283f8318 OP_EQUAL within range 0-1574542 failed: chain notifier shutting down
This seems to be the culprit of the high CPU usage. It's trying to scan the whole chain for these scripts. Are you using the chain notifier subserver or loopd with lnd?
wpaulino
on 15 Aug 2019
0-1574542
looks like it's scanning the whole testnet chain? seems weird that none of these have height hints
The last profile also looks like pendingchannels getinfo and channelbalance are getting hammered/still being executed on shutdown.
looking at the pendingchannels for example, we don't have anything to prevent the call from being executed while the rpcserver is stopping. could be a good usecase for some grpc interceptors?
 cfromknecht
on 15 Aug 2019
cfromknecht
on 15 Aug 2019
This seems to be the culprit of the high CPU usage. It's trying to scan the whole chain for these scripts. Are you using the chain notifier subserver or loopd with lnd?
I am using the released lnd-linux-amd64-v0.7.1-beta.tar.gz with no other flags. I'm not using loopd. I am using a ln-service call subscribeToChainAddress which could possibly be using the chain notifier server, I'm not familiar enough with LND or ln-service to say
MrRGnome
on 16 Aug 2019
I am using a ln-service call subscribeToChainAddress which could possibly be using the chain notifier server, I'm not familiar enough with LND or ln-service to say
This is reason for the high CPU usage. When using this API, you should provide a min_height, otherwise lnd will attempt to scan the chain from genesis looking for the address. This consists of fetching every block and iterating through each transaction in them to determine if it contains/spends the specific address.
wpaulino
on 16 Aug 2019
Thank you, I'll apply that change to my calls. If my lack of a min_height parameter is the sole cause of this issue I don't suppose there is much to be done here except possibly fail more gracefully in such a scenario as mine.
MrRGnome
on 16 Aug 2019
@MrRGnome also be sure to set min_confs > 0, that will ensure the daemon can exit properly during a rescan. #3405 should address the issues of failing more gracefully
cfromknecht
on 16 Aug 2019
You guys have been a great help, thanks again for your time.
MrRGnome
on 16 Aug 2019
@MrRGnome thanks for the detailed reports!!
cfromknecht
on 27 Aug 2019
Related issues
 zyp
·
4Comments
zyp
·
4Comments
 MrManPew
·
3Comments
MrManPew
·
3Comments
 joostjager
·
3Comments
joostjager
·
3Comments
 alexbosworth
·
3Comments
alexbosworth
·
3Comments
 danielemiliogarcia
·
3Comments
danielemiliogarcia
·
3Comments
Most helpful comment
I except the best course in that case is to close this issue and reopen it should it present itself again.
It's a real pleasure working with the LND community, thanks for all the work you guys put in.