Lnd: High CPU usage after a few hours
Background
High CPU usage since 0.7.1.
The node runs perfectly for a few hours and at one point the CPU usage of lnd reaches 100%, I've let it for a couple of days at 100% but it never goes down. Restarting lnd fixes the issue for a few hours. This behavior wasn't seen with 0.6.
bitcoind CPU usage stays low.
Your environment
- version of
lnd
lnd version 0.7.1-beta commit=v0.7.1-beta - which operating system (
uname -aon *Nix)
Linux 4.19.0-5-amd64 #1 SMP Debian 4.19.37-5 (2019-06-19) x86_64 GNU/Linux - version of
btcd,bitcoind, or other backend
Bitcoin Core Daemon version v0.18.0 - any other relevant environment details
CPU profile when it happens :

 LLeny
LLeny
All 94 comments
Thanks for the report!
cc @wpaulino
 halseth
on 5 Aug 2019
halseth
on 5 Aug 2019
Do the logs show anything relevant while this is happening?
 wpaulino
on 6 Aug 2019
wpaulino
on 6 Aug 2019
I couldn't see anything unusual in the logs, the node appears to still be working as expected, peers are connected, channels are active.
LLeny
on 6 Aug 2019
Are you experiencing this reliably? Do you see bitcoind falling behind at any point and then catching up?
wpaulino
on 6 Aug 2019
Got it after a few day this time.
Bitcoind blocks are up to date, lnd is also in sync with bitcoind.
Bitcoind is not taking any CPU.
I can keep it in this state for a few days if you think about something to look for.
LLeny
on 9 Aug 2019
Could you also obtain a heap profile while experiencing the issue?
wpaulino
on 9 Aug 2019
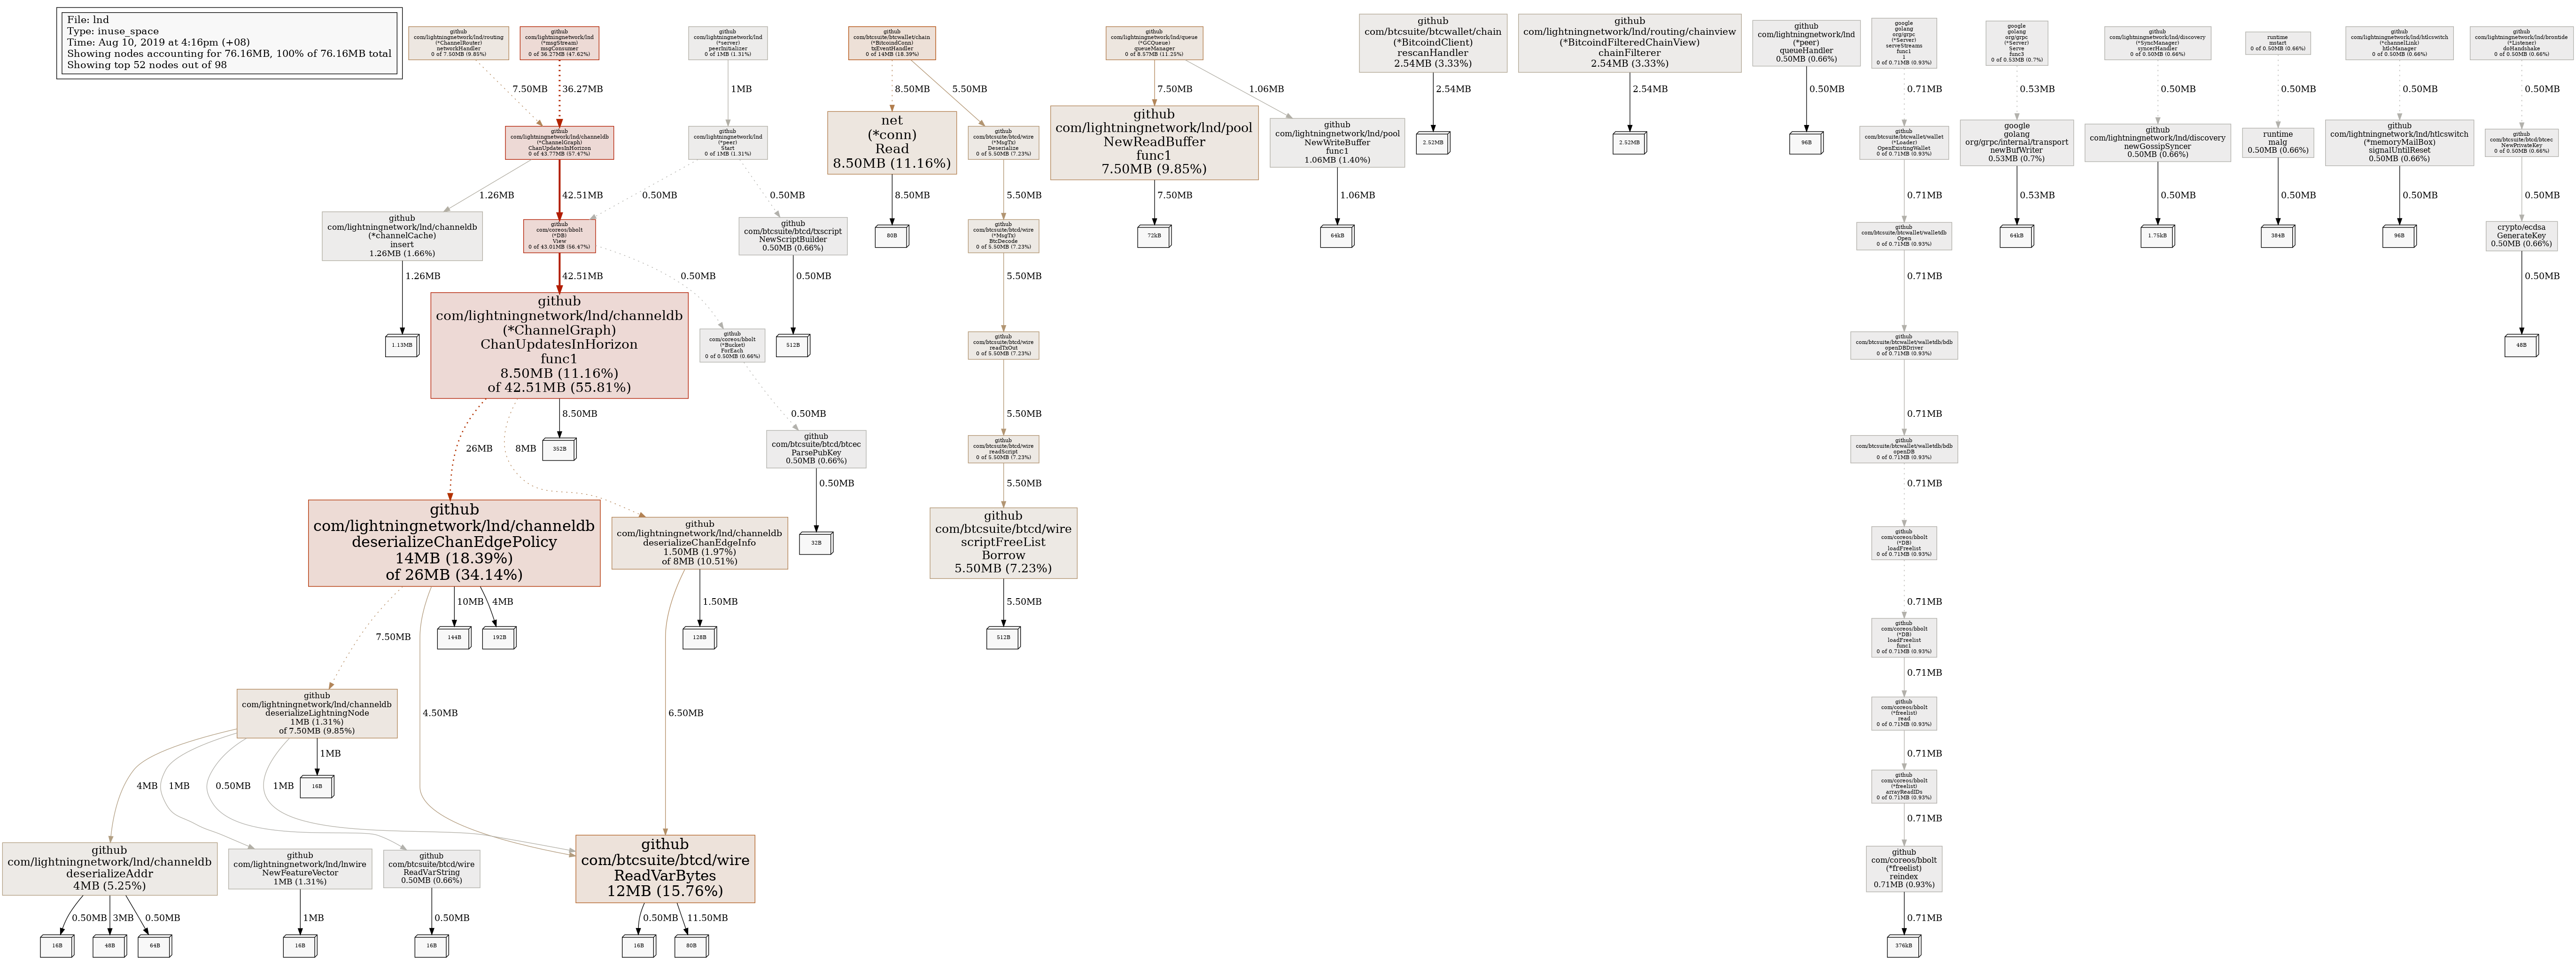
LLeny
on 10 Aug 2019
@LLeny curiously, what kind of device is this running on?
i'd guess by your description that you have a peer that requests a lot of graph data, which can a lot of allocations/deserializations as the objects are created and destroyed and gc pressure. we do keep an in-memory cache of these responses in order to avoid deserializing them every time a peer requests them, but depending on your peers or hardware, it may not be enough.
if you're machine has enough ram, you can consider increasing the caches.channel-cache-size to 35000, rather than the default of 20000. you'll notice higher overall memory usage, but less cpu (gc + deserialization).
either way you will probably want to identify which peer(s) is causing this. the logs should show something like:
... applying new update horizon: start=2019-08-04 23:38:09 +0000 UTC, end=2155-09-11 06:06:24 +0000 UTC, backlog_size=92088
thing to look for is peers that request a large backlog_size, e.g. 50k+. if you don't have a channel with them you can try banning their IP address. if you do, but the channel isn't sentimental, you can try making a channel with someone else.
this recent pr #3359 offers a new configuration option called ignore-historical-filters which will be available in 0.8. the feature is designed to help less beefy machines avoid the heavier resource costs of syncing other peers on the network. if you're comfortable, another possible solution is to run master and use ignore-historical-filters.
as noted in the PR, there are plans to remove this behavior entirely as it is quite heavy, but there are currently nodes on the network that depend on this for synchronizing the graph. you can follow the progress of its removal in this spec PR
 cfromknecht
on 12 Aug 2019
cfromknecht
on 12 Aug 2019
@cfromknecht thank you, lnd has 1 core of a x86 @ 2.4GHz, 2GB of RAM.
I indeed found a few update horizon backlog_size between 100k and 120k, but I couldn't identify a clear correlation with the constant CPU usage. When it happens it stays at 100% for days until the next restart.
I'll check in more depth during the next occurrence.
LLeny
on 13 Aug 2019
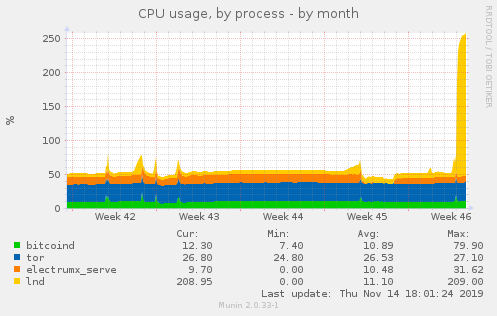
I've noticed cpu spikes too since latest beta release:
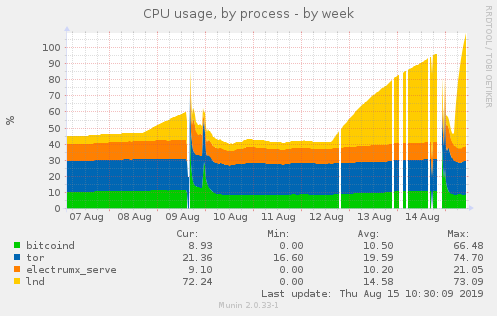
At the same time, bitcoind (0.18.1) memory starts growing, so I assume it's due to lnd misbehavior:
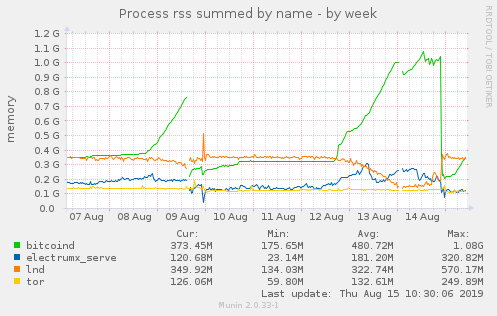
And this is profile output of curl http://localhost:9000/debug/pprof/goroutine?debug=1 > lnd_profile_output.txt:
 Talkless
on 15 Aug 2019
Talkless
on 15 Aug 2019
I came here via the search for the similar issue.
I am running lnd connected to remote bitcoind backend. I've discovered, that after missing the connect to the btc backend lnd daemon goes to eat 99% of the cpu (single - core instance)
It may be some not recovered network calls going to infinite cycle after connectivity issue.
@LLeny could you tell please how do you connect to bitcoin backend?
In your profile I see gozmq calls, so it is definitively related to the bitcoind zero mq communication.
Step to reproduce my issue. It may be the same issue from this topic.
- Run lnd connected remotely to Bitcoind back-end
- Interrupt the connection between lnd and bictoind
- lncli getinfo - shows no response
- Restore back the connection
- lncli getinfo - shows response but lnd eats 99% of the cpu core.
- The restart of the daemon fixes this behavior.
 begetan
on 15 Aug 2019
begetan
on 15 Aug 2019
@Talkless thanks for the report, though the profile you've provided is for goroutines. We'll need a CPU one instead: http://localhost:9000/debug/pprof/profile.
@begetan have you confirmed whether you're experiencing the same gossip issue pointed out in https://github.com/lightningnetwork/lnd/issues/3370#issuecomment-520589066?
wpaulino
on 15 Aug 2019
@Talkless thanks for the report, though the profile you've provided is for goroutines. We'll need a CPU one instead:
http://localhost:9000/debug/pprof/profile.
Oh, I've blindly copied that line from https://github.com/lightningnetwork/lnd/blob/6afee3d0997f1661710390b39746c61f38a1c41f/docs/debugging_lnd.md#capturing-pprof-data-with-lnd . Maybe it's worth to change it there..?
Talkless
on 16 Aug 2019
Curl fetch some binary output, so this is go tool pprof -text output, not sure if that's what you need:
Talkless
on 16 Aug 2019
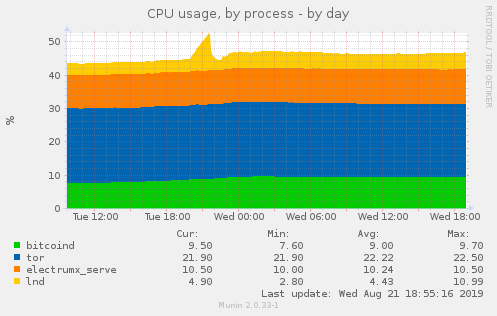
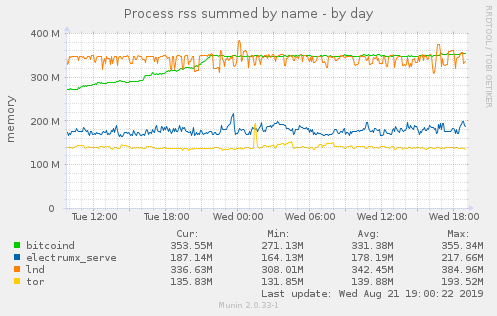
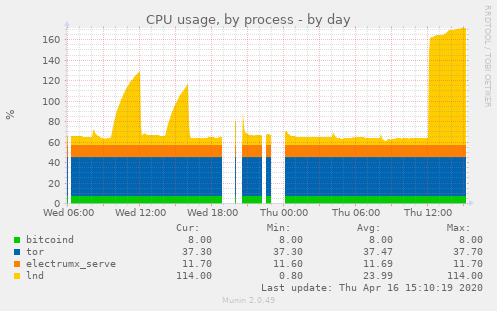
CPU usage of lnd started growing again, and looking and munin graph, I found these interesting lines in lnd logs at around that time:
2019-08-19 13:43:06.160 [INF] DISC: Broadcasting 32 new announcements in 4 sub batches
2019-08-19 13:43:13.729 [DBG] LNWL: Filtering block 590787 (00000000000000000012798608afd0869a51ce54aac0c24722735e0345355024) with 2881 transactions
2019-08-19 13:43:13.730 [DBG] LNWL: Filtering block 590787 (00000000000000000012798608afd0869a51ce54aac0c24722735e0345355024) with 2881 transactions
2019-08-19 13:43:13.730 [DBG] LNWL: Filtering block 590787 (00000000000000000012798608afd0869a51ce54aac0c24722735e0345355024) with 2881 transactions
2019-08-19 13:43:15.669 [INF] CRTR: Pruning channel graph using block 00000000000000000012798608afd0869a51ce54aac0c24722735e0345355024 (height=590787)
2019-08-19 13:43:16.078 [INF] CHDB: Pruned unconnected node 037db7ce71ef503ed0e45aacbd346f3b1af40122d1d0eeb52d574711bb9a5bcf5f from channel graph
2019-08-19 13:43:16.079 [INF] CHDB: Pruned 1 unconnected nodes from the channel graph
2019-08-19 13:43:16.325 [INF] CRTR: Block 00000000000000000012798608afd0869a51ce54aac0c24722735e0345355024 (height=590787) closed 3 channels
2019-08-19 13:43:16.943 [INF] NTFN: New block: height=590787, sha=00000000000000000012798608afd0869a51ce54aac0c24722735e0345355024
2019-08-19 13:43:16.945 [INF] UTXN: Attempting to graduate height=590787: num_kids=0, num_babies=0
2019-08-19 13:43:33.392 [INF] CRTR: Processed channels=0 updates=24 nodes=0 in last 59.999735574s
2019-08-19 13:44:33.393 [INF] CRTR: Processed channels=0 updates=5 nodes=0 in last 1m0.000909243s
2019-08-19 13:44:36.160 [INF] DISC: Broadcasting 29 new announcements in 3 sub batches
Filtering block 590787 three times?
Talkless
on 19 Aug 2019
Filtering block 590787 three times?
This is expected. There are three clients within lnd that perform block filtering: the wallet, the chain notifier (notifies confirmations/spends of txids/outputs), and the graph (to detect spent channels).
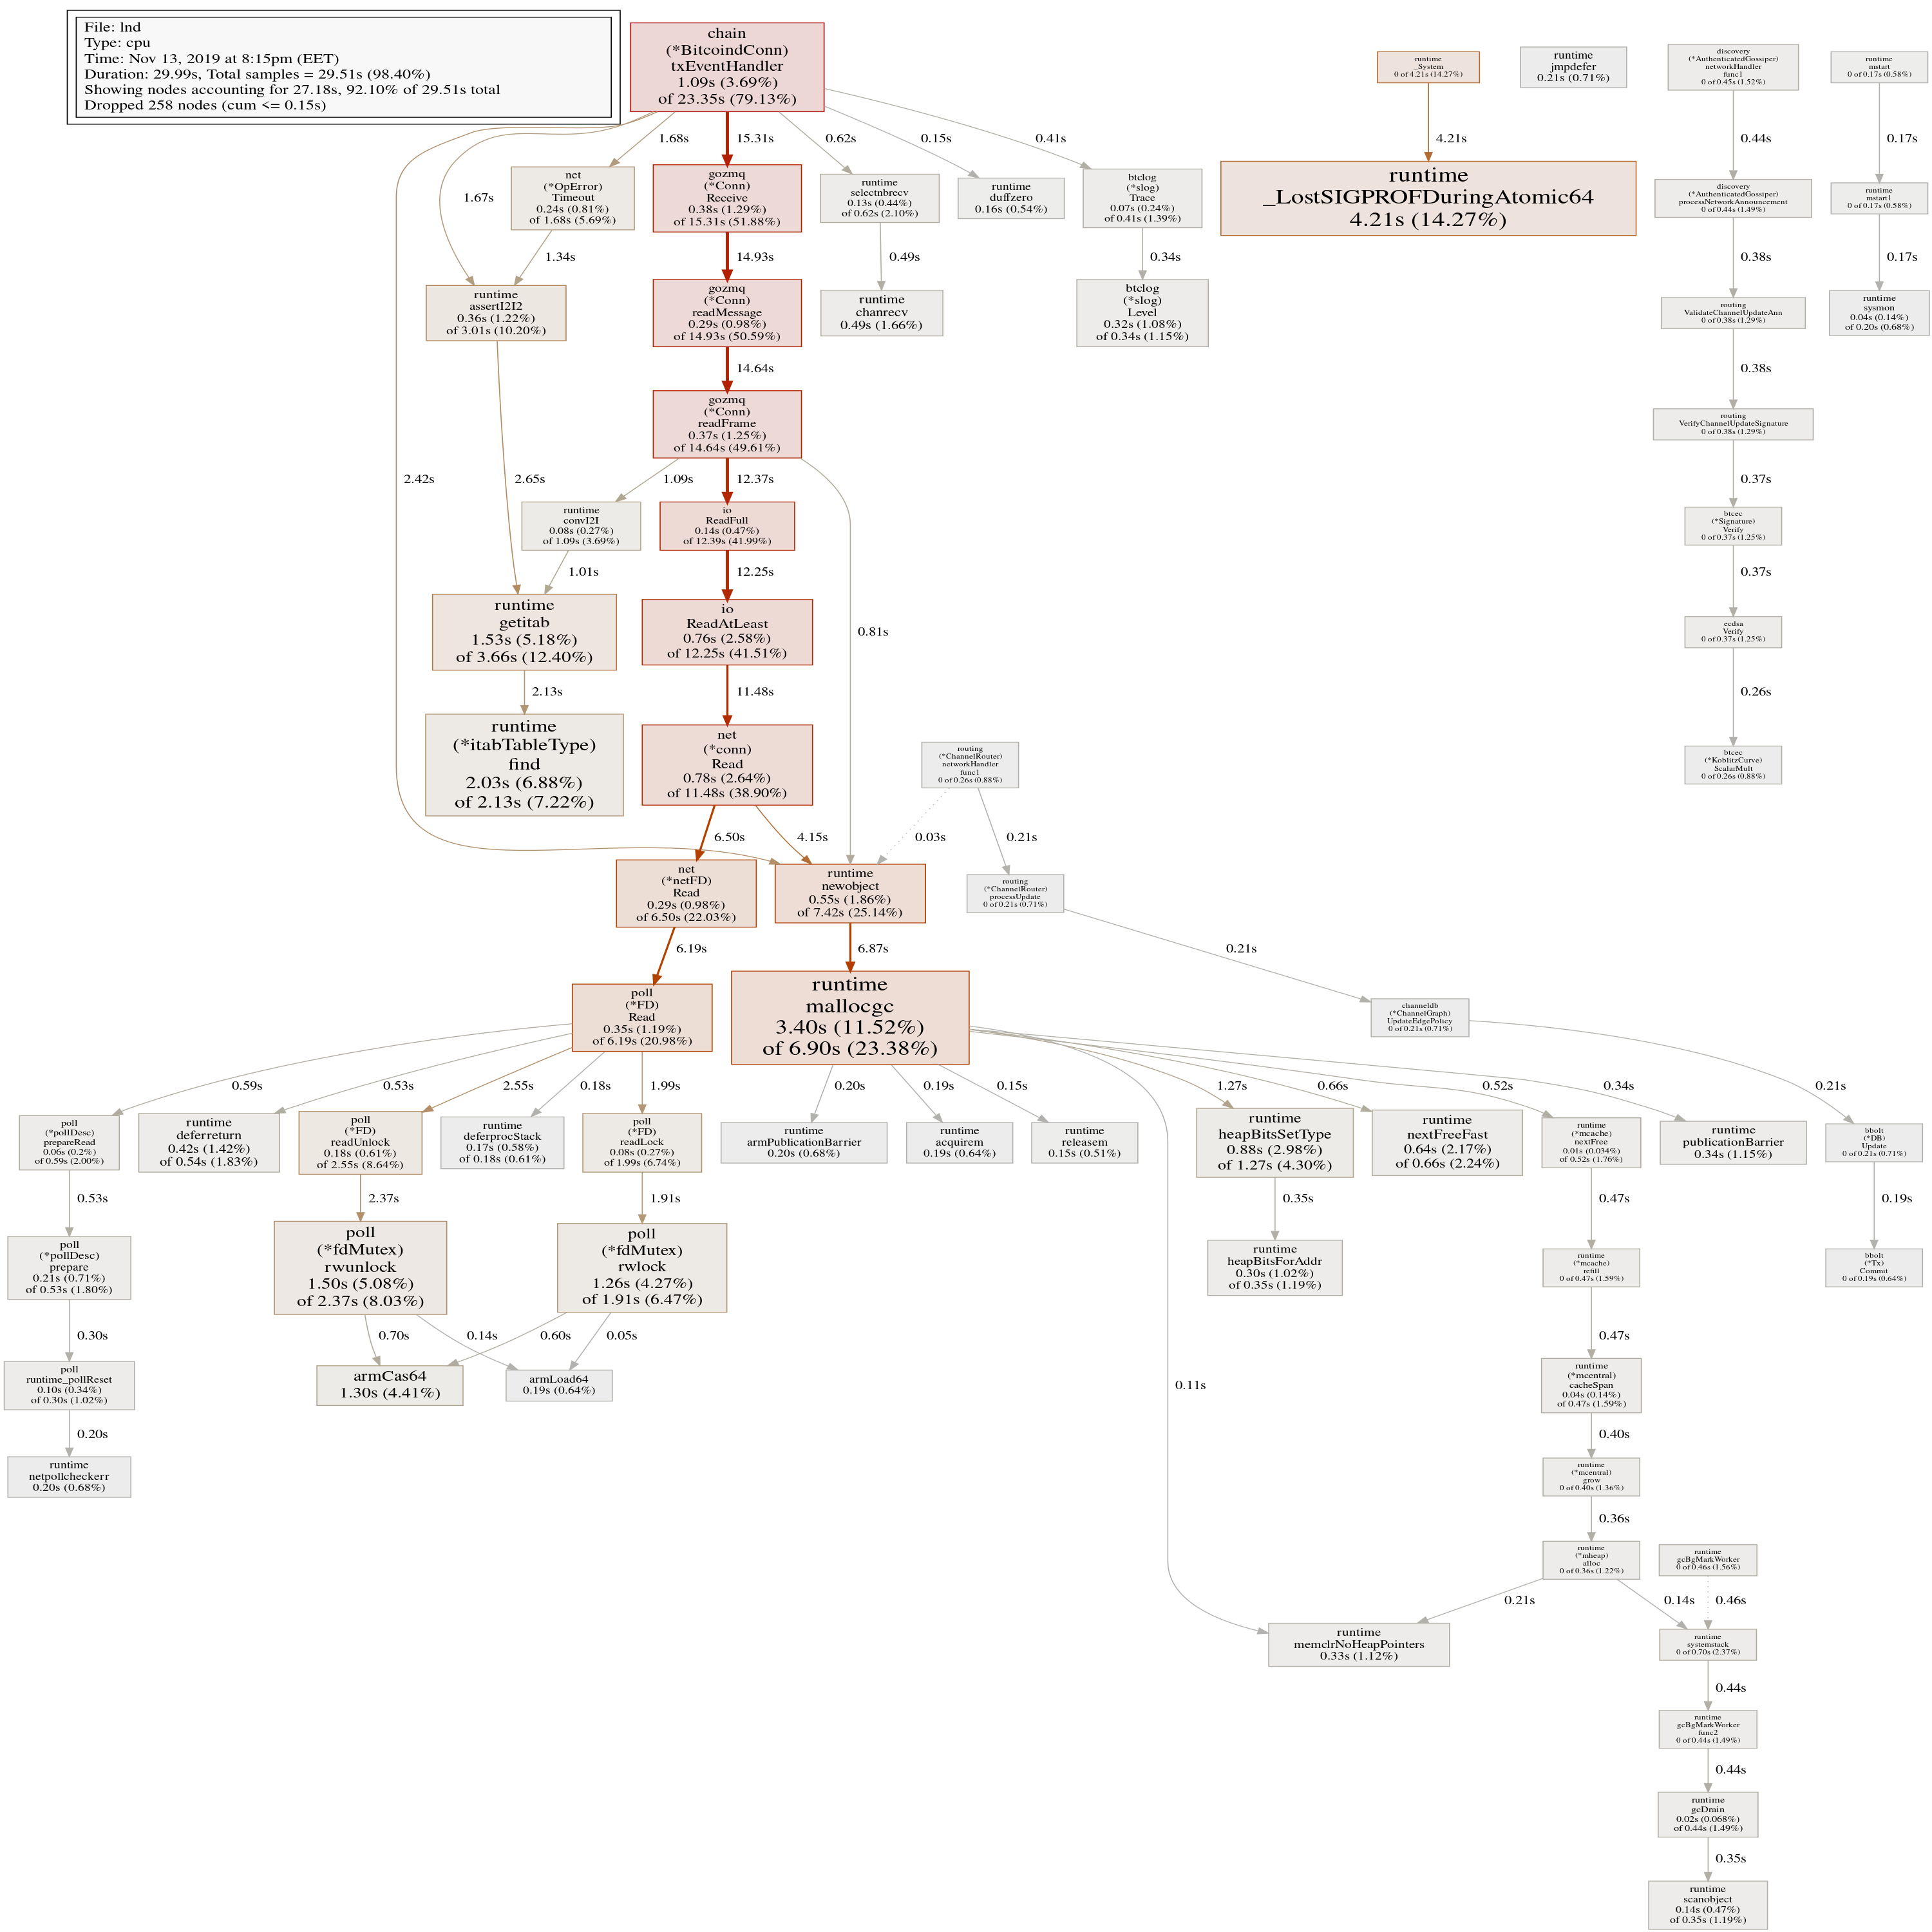
Curl fetch some binary output, so this is go tool pprof -text output, not sure if that's what you need:
This profile shows the transaction ZMQ connection as a hot path, is your bitcoind node being flooded with transactions?
wpaulino
on 19 Aug 2019
@wpaulino
Not sure what exact issue you talking about. I would confirm high CPU utilization after several hours of lnd work. In my configuration the bitcoind is running in remote machine via VPN.
I can provide a necessary information from logs if you tell what filter should be applied.
begetan
on 20 Aug 2019
Filtering block 590787 three times?
This is expected.
OK :-/ . Well this is only what hits the eye at the time when LND CPU usage started climbing.
This profile shows the transaction ZMQ connection as a hot path, is your bitcoind node being flooded with transactions?
Uhm I dunno..? What I do see is that bitcoind memory usage increases (see my previous munin graph) together with LND cpu usage. So you think some sort of bitcoind DoS somehow drive LND CPU usage too..? Should I monitor bitcoin-cli getpeerinfo or something to check that theory (during spikes)?
Talkless
on 20 Aug 2019
is your bitcoind node being flooded with transactions?
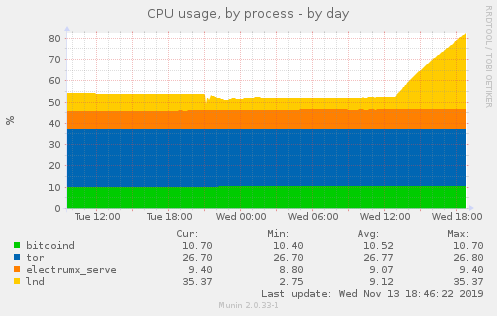
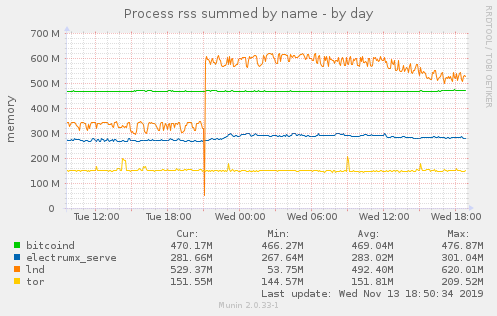
I doubt this is the case. I just need to restart lnd and lnd CPU usage gets calm again, and bitcoind memory usage stops growing:
(little spike as I managed to restart lnd early)
(bitcoind memory usage stops growing at the time I restarted lnd):
Talkless
on 22 Aug 2019
I'm seeing the same issue, lnd uses >100% cpu (1 core in constant use + light usage on other cores) after I've left it up and running for a few days. If I restart lnd it goes back to using low cpu (hovering between 0-20%). It also only started happening recently for me, I'd guess around the time I upgraded to 0.7.1 but it is also happening on the latest master.
I'm using a local bitcoind instance, running on an ARM ODROID-HC1 with 2 GB ram. I'd be happy to run some profiling or answer questions to help.
 sangaman
on 9 Sep 2019
sangaman
on 9 Sep 2019
@sangaman Profiling would be very helpful!
halseth
on 11 Sep 2019
go1.13 has some more performance improvements so I'm wondering if it'll help in this issue if anyone wants to try it out.
wpaulino
on 11 Oct 2019
Sorry I haven't had time to pull profiling information. I actually just upgraded to go 1.13 and the 0.8.0 RC, after about 36 hours of uptime I'm seeing cpu usage stuck at 100-130%, so one core seems like it's being used nonstop.
sangaman
on 11 Oct 2019
To follow up on the issue, I've upgraded to 0.8, set ignore-historical-gossip-filters=1 and I am still encountering the issue, happened after 2 weeks of lnd running. The CPU profile is similar.
LLeny
on 1 Nov 2019
@LLeny are you seeing any correlation between restarting bitcoind without restarting lnd and the increased CPU usage?
wpaulino
on 6 Nov 2019
@wpaulino I tried to stop bitcoind after lnd entered in this high usage. Disk, network i/o went to close to 0 but lnd kept its high CPU usage until I restarted it.
LLeny
on 7 Nov 2019
I think I found the culprit for the high CPU usage. @LLeny @sangaman @Talkless @begetan could you all try out #3695 to see if it improves things?
wpaulino
on 8 Nov 2019
@wpaulino can we use it with current 0.8 release (not master)?
Talkless
on 10 Nov 2019
@Talkless you should be able to just by cheanging the gozmq dependency in go.mod
halseth
on 11 Nov 2019
@Talkless you should be able to just by cheanging the gozmq dependency in go.mod
You'll also need the btcwallet changes. You can just fetch the PR locally and cherry pick the commits on top of the v0.8.0-beta branch.
wpaulino
on 11 Nov 2019
I've applied commit:
$ lncli getinfo | jq ".version"
"0.8.0-beta commit=v0.8.0-beta-1-g9b941eb5c8ca622946a0ab0954bdb8d8420f34fc"
But sadly, after ~16 hours, CPU usage spiked still:
Also, memory usage increased by ~200MB just after starting patched version:
Talkless
on 13 Nov 2019
The issue seems to be resolved for me with this commit: https://github.com/lightningnetwork/lnd/pull/3695/commits/39e3a45d999f59f39ad3f33c939680e2e77d3fa2
sangaman
on 13 Nov 2019
Here's my profile:
Talkless
on 13 Nov 2019
The issue seems to be resolved for me with this commit: 39e3a45
Never mind, cpu is back over 100%...
sangaman
on 14 Nov 2019
@sangaman I had same issue creep again, but it was bad rebuild. @wpaulino helped me (via IRC) to clean the go cache and re-cherry-pick. @sangaman try cleaing up whole GOPATH and rebuild lnd from scratch.
Talkless
on 14 Nov 2019
Is that not what make clean does? I have been rebuilding with that command.
sangaman
on 14 Nov 2019
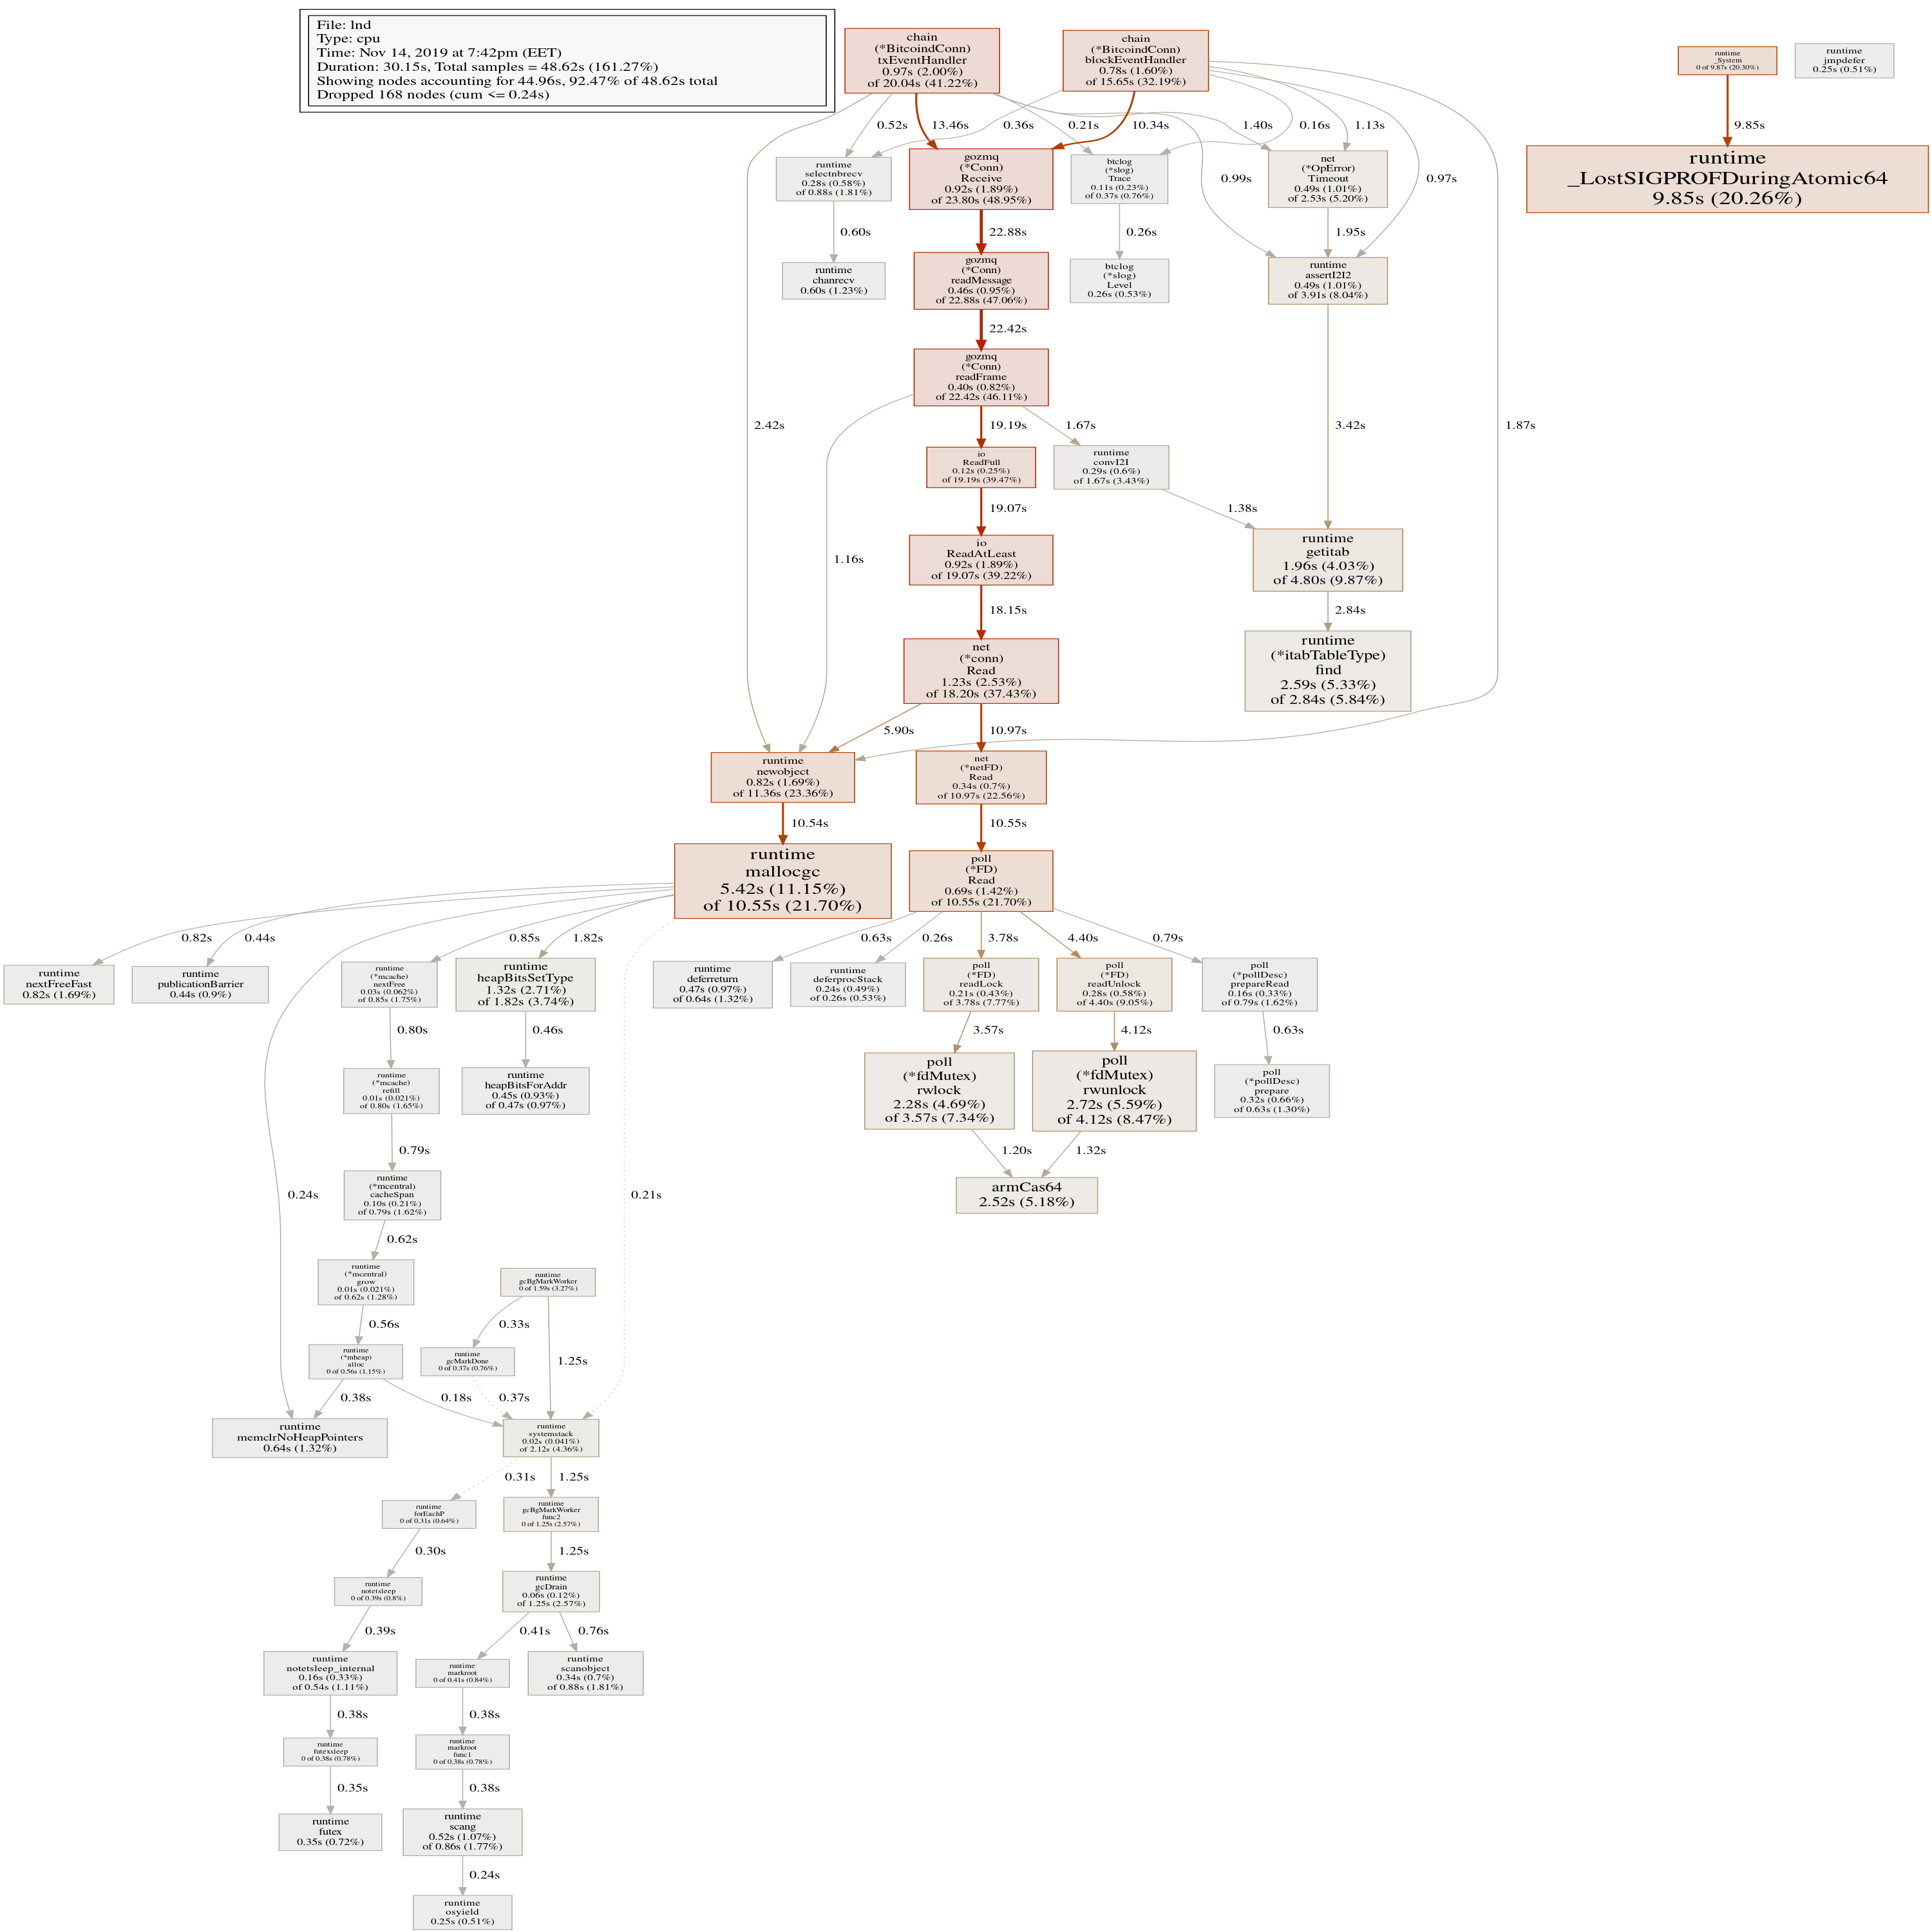
@sangaman Idunno, maybe it doesn't matter, now I have biggest CPU spike ever:
Talkless
on 14 Nov 2019
Current profile:
Talkless
on 14 Nov 2019
The interesting thing that bitcoind's memory usage increases at the same time as lnd cpu usage increaces.
Talkless
on 14 Nov 2019
I think I found the culprit for the high CPU usage. @LLeny @sangaman @Talkless @begetan could you all try out #3695 to see if it improves things?
I have been running 0.8 with #3695 for a few days and sadly the issue is still there.
LLeny
on 15 Nov 2019
Anything I can do to help pinpoint this issue? I've been running lnd with profiling enabled and would be happy to provide any info requested.
sangaman
on 23 Nov 2019
I just noticed this high cpu load on my node running 0bff2ed5545d27d5c8e15c43d0885145267eb2ab (tag: v0.8.1-beta) after wondering about strange messages about premature announcements on the lnd output:
...
2019-11-27 21:54:07.049 [INF] DISC: Announcement for chan_id=(665897227183652864), is premature: advertises height 605630, only height 605622 is known
2019-11-27 21:54:08.845 [INF] DISC: Update announcement for short_chan_id(665904923896381441), is premature: advertises height 605637, only height 605622 is known
2019-11-27 21:54:09.375 [INF] DISC: Announcement for chan_id=(665897227183652864), is premature: advertises height 605630, only height 605622 is known
2019-11-27 21:54:10.014 [INF] DISC: Announcement for chan_id=(665897227183652864), is premature: advertises height 605630, only height 605622 is known
2019-11-27 21:54:12.667 [INF] DISC: Announcement for chan_id=(665897227183652864), is premature: advertises height 605630, only height 605622 is known
...
It seemed that my lnd node got stuck synchronizing with my bitcoind-0.18.1 on block 605622. The bitcoind itself was already synchronized to block height 605643 at that time. After restarting lnd, it catched up to block height 605643:
...
2019-11-27 22:08:06.440 [INF] LNWL: Started rescan from block 00000000000000000012b570dc48c789ed415664eb4d43c3828edb8395fe2101 (height 605622) for 6313 addresses
2019-11-27 22:08:50.354 [INF] LNWL: Catching up block hashes to height 605643, this might take a while
2019-11-27 22:08:50.372 [INF] LNWL: Done catching up block hashes
2019-11-27 22:08:50.372 [INF] LNWL: Finished rescan for 6313 addresses (synced to block 0000000000000000000ee000a35c4d42e22fcb1ef88b8ca8a8f6978b2bfa234c, height 605643)
2019-11-27 22:08:50.738 [INF] LTND: Chain backend is fully synced (end_height=605643)!
...
 hpbock
on 27 Nov 2019
hpbock
on 27 Nov 2019
@wpaulino, is there a reason why this has not been triaged as a bug and marked with priority? I think this is pretty serious bug, since you now need proper hardware to run lnd (embedded devices get overloaded in no time) and you cannot downgrade existing lightning node. I am getting load averages between 2-3 running just lnd (bitcoind is running on a different machine).
I hate to just complain. Tell me how to help if I can, but I never wrote a line in Go.
 janvojt
on 2 Dec 2019
janvojt
on 2 Dec 2019
@janvojt I've been testing a series of patches myself along with others, but a proper fix has not been found yet. Running your bitcoind node with blocksonly=1 and restarting bitcoind followed by lnd should reduce the CPU usage for now, but note that this prevents your node from forwarding incoming transactions from other peers (transactions you broadcast still propagate). As a result, your lnd node will be unable to see an unconfirmed wallet balance.
wpaulino
on 2 Dec 2019
Can confirm this bug is occurring for me as well. This is a huge issue for those of us running LND on cloud instances where high CPU usage is billable.
 johnwickACT
on 20 Dec 2019
johnwickACT
on 20 Dec 2019
@johnwickACT I actually setup cron job to restart lnd every 4 hours :) . Better approach would be to setup, let's say, Icinga/Nagios monitoring and restart lnd if it's CPU usage crossed over threshold for some time, but I was too lazy...
Talkless
on 21 Dec 2019
I believe I've just triggered high CPU usage on 0.9.0-beta by running my homebew lndstats.sh to check offchain/onchain stats:
#!/usr/bin/env bash
set -ue
readonly PREFIX=/home/lnd/lnd.go/bin
OFF_SUM=0
echo "--Off-chain--"

FWD=$(${PREFIX}/lncli fwdinghistory --start_time 1 | fgrep timestamp -c)
OFF_SUM=$(( $OFF_SUM + $FWD ))
echo "forwards: ${FWD}"

PAY=$(${PREFIX}/lncli listpayments | fgrep payment_hash -c)
OFF_SUM=$(( $OFF_SUM + $PAY ))
echo "payments: ${PAY}"

INV=$(${PREFIX}/lncli listinvoices | fgrep SETTLED -c)
OFF_SUM=$(( $OFF_SUM + $INV ))
echo "invoices: ${INV}"

echo "total: ${OFF_SUM}"

echo "--On-chain--"

ON_SUM=$(${PREFIX}/lncli listchaintxns  | fgrep tx_hash -c)
echo "chaintxns: ${ON_SUM}"

echo "--Overview--"
RATIO=$(echo "scale = 3; ${OFF_SUM} / ${ON_SUM}" | bc)
echo "ratio: ${RATIO}"
It is not executed regularly, v0.9.0 was running for more that an day after upgrade without issues, and just after I executed that script, I see ~100% CPU usage for quite some minutes now.
Talkless
on 25 Jan 2020
@Talkless seems like a different issue, but could you first obtain a CPU profile to confirm before we decide to track it separately?
wpaulino
on 27 Jan 2020
@Talkless seems like a different issue
It looks similar, with lot's of mallocs:
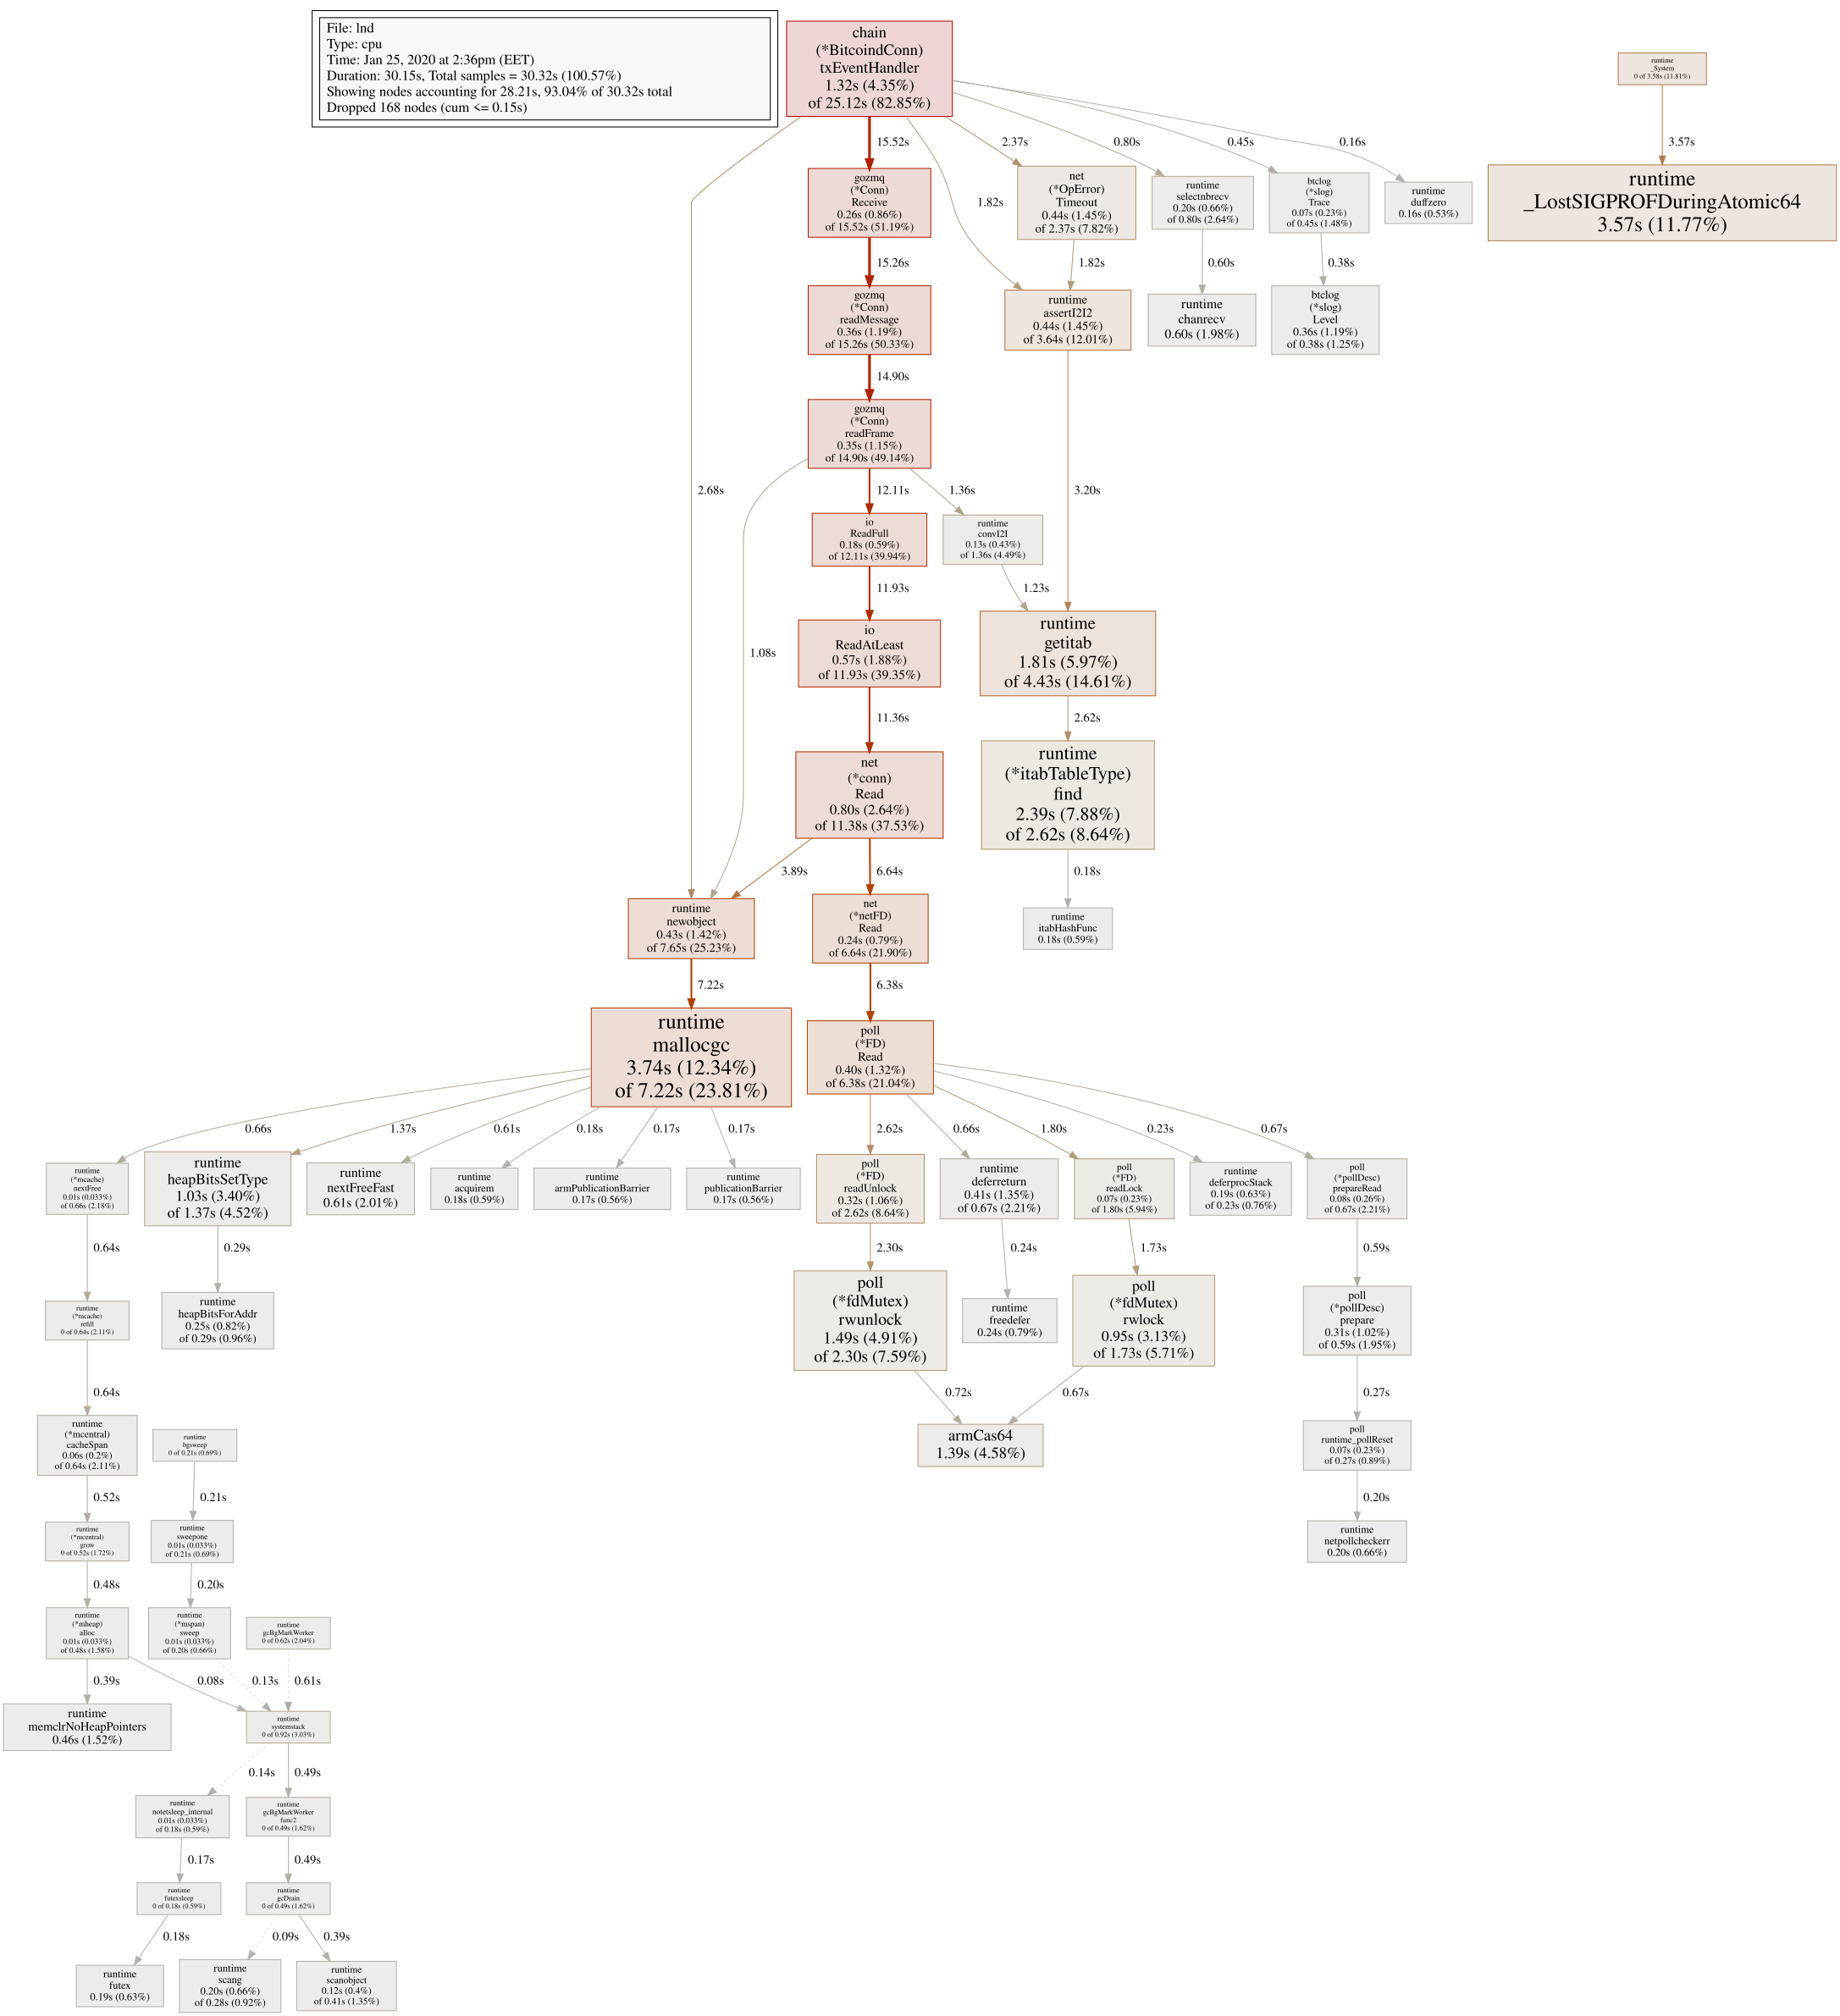
It just seems that quering info might trigger same "endless loop" of some sort...
Talkless
on 28 Jan 2020
Here's the heap profile as requested:
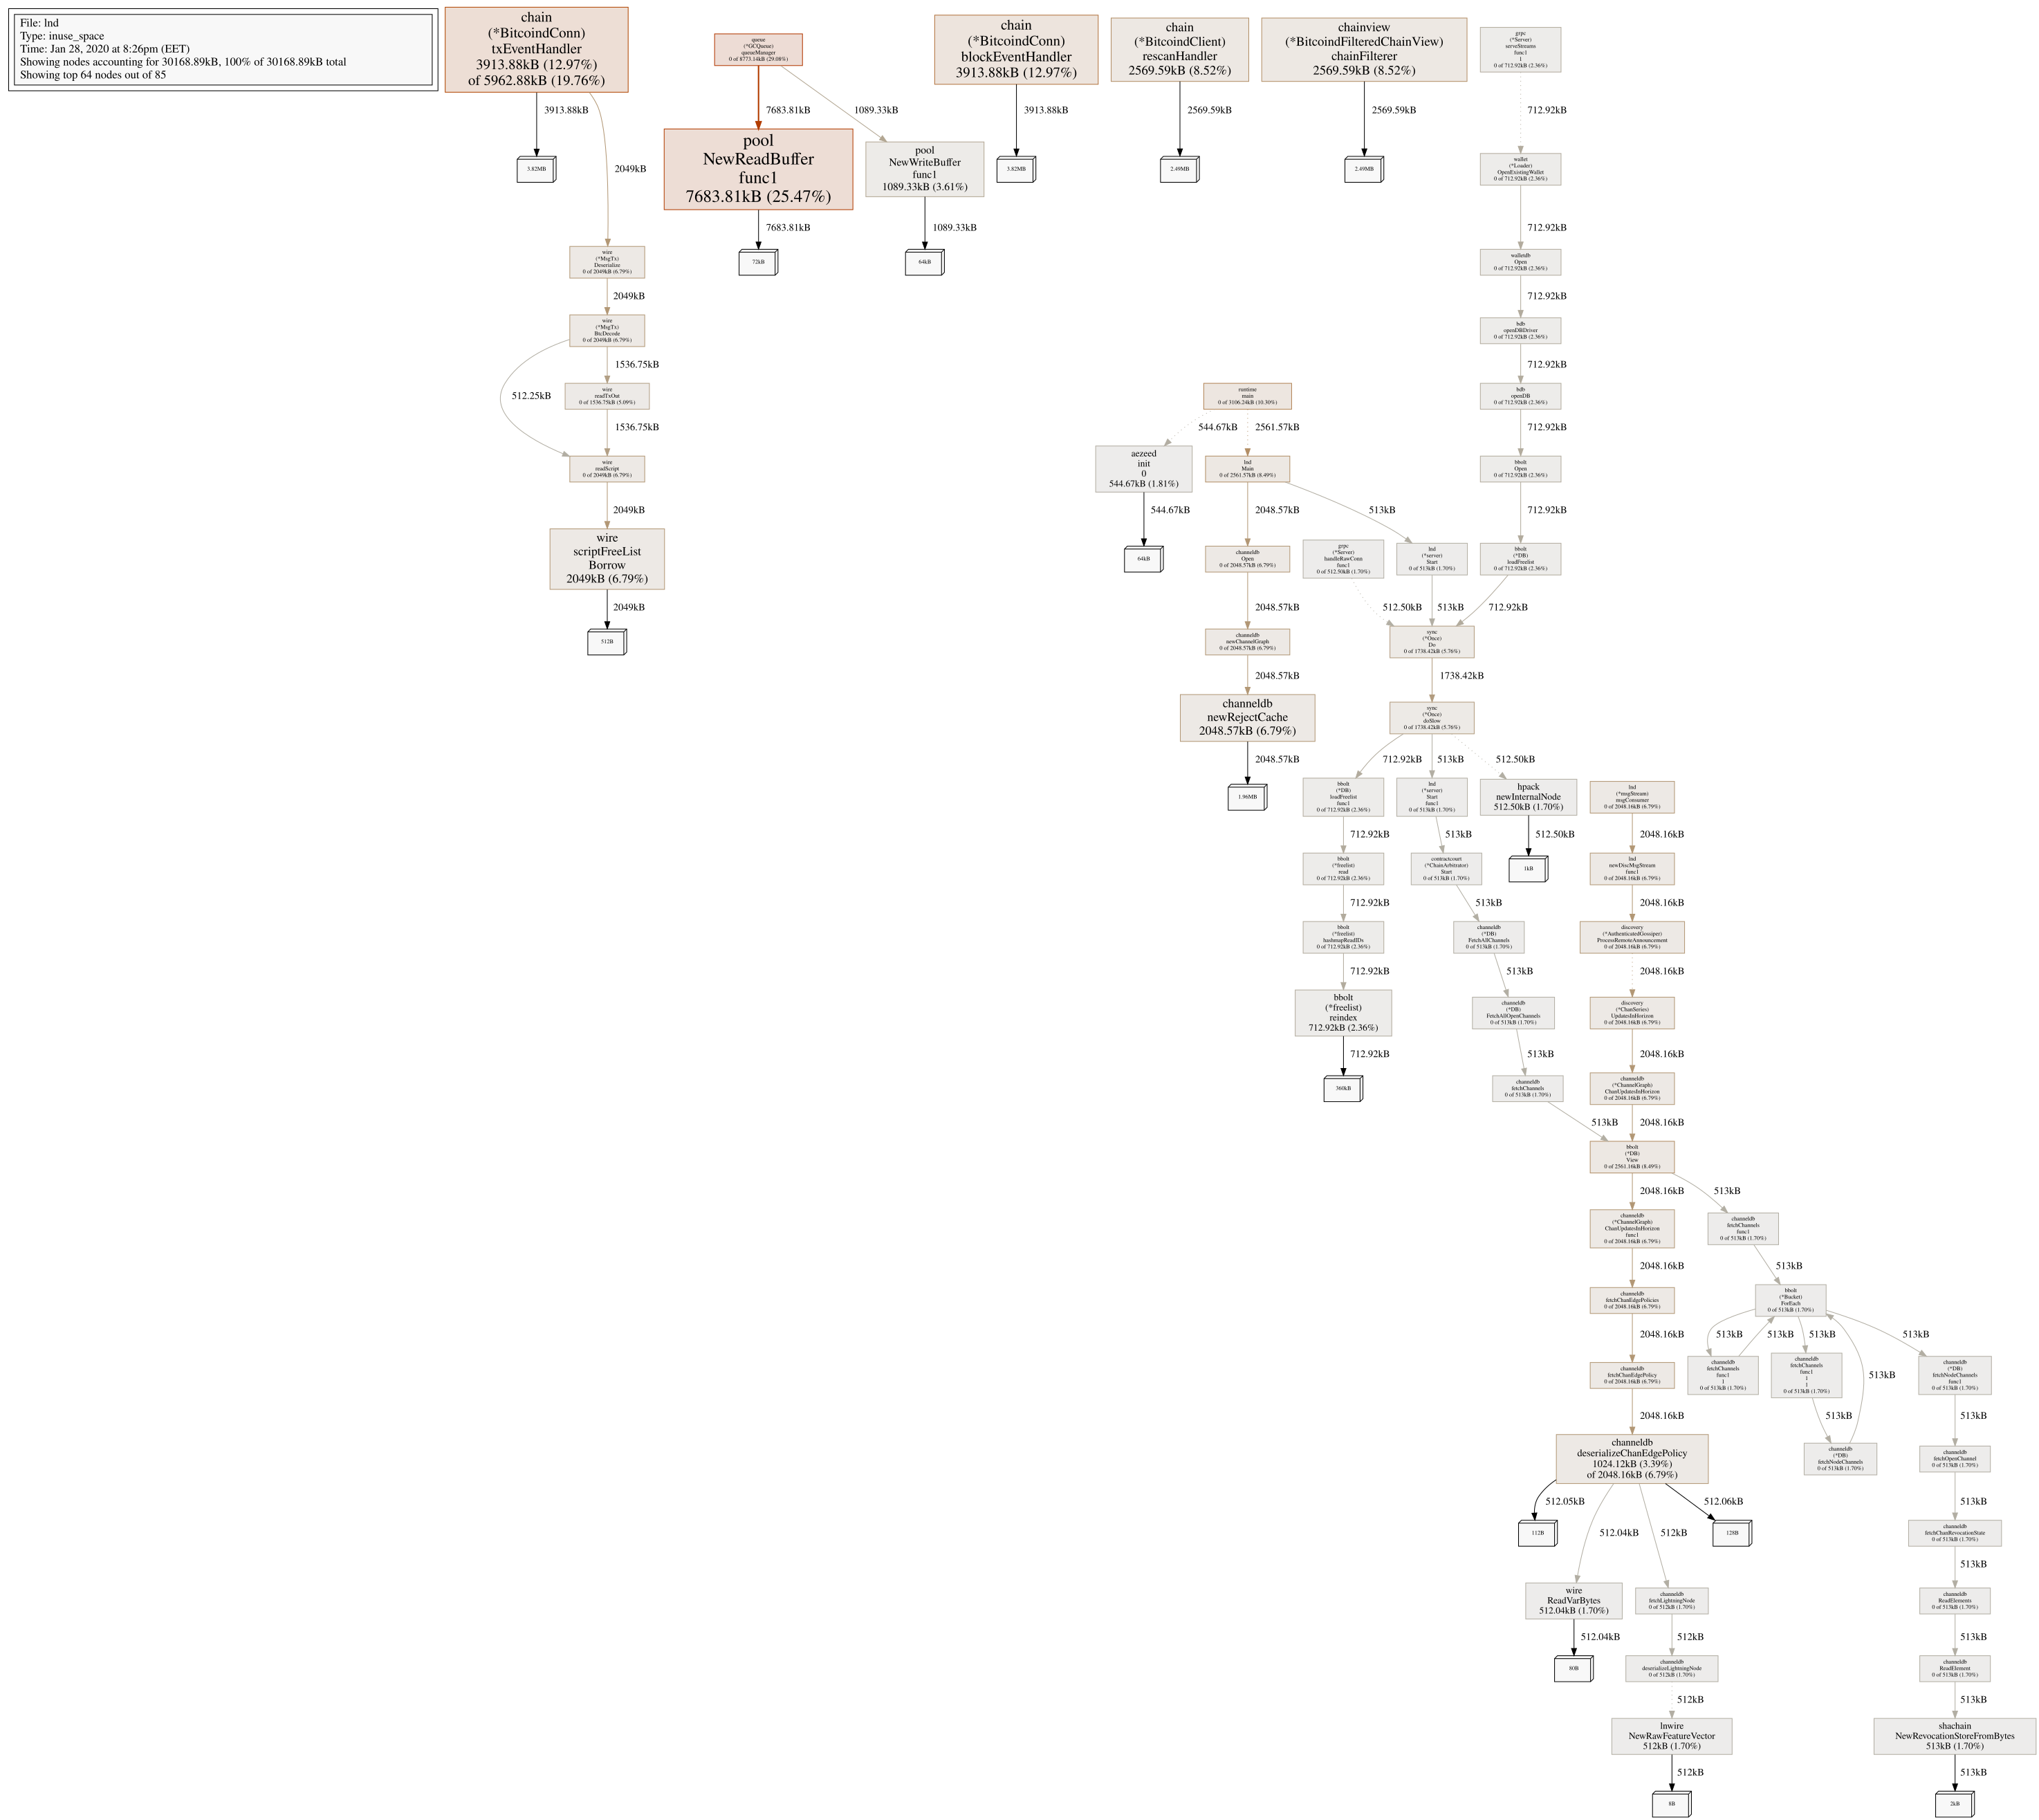
Talkless
on 28 Jan 2020
Running into same issue. LND go stuck in GC / Malloc for the ZMQ. I'm running bitocind + lnd on Amazon AWS t2.small (2 GB ram, 1 CPU core). I did profiling with linux perf - details and screenshots: https://github.com/alevchuk/minibank/blob/master/incidents/i1.md
 alevchuk
on 15 Feb 2020
alevchuk
on 15 Feb 2020
caches.channel-cache-sizementioned earlier does not help- also happening on another AWS t2.small (2 GB ram, 1 CPU core) yet that one is using a remote full bitcoin node and there is nothing other than lnd running there
- It seems that RAM needs to be more than 2 GB to avoid this problem. At least, my 4GB pi never runs into this.
Is the problem in ZMQ or it's just that ZMQ thread is more active and incidentally one that always ends up triggering gc?
alevchuk
on 18 Feb 2020
Possibly related: We (Sparkswap) are also seeings 95%-100% cpu usage when making requests to LND over time. We have functionality in our app that queries walletBalance every 10 seconds and that keeps the CPU pinged pretty high. I will provide benchmarks once we are done investigating
 dannypaz
on 7 Mar 2020
dannypaz
on 7 Mar 2020
Go 1.14 included some GC enhancements, perhaps it may alleviate some of the strain in the profiles that showed the CPU mostly spending time in GC land.
 Roasbeef
on 14 Apr 2020
Roasbeef
on 14 Apr 2020
Go 1.14 included some GC enhancements, perhaps it may alleviate some of the strain in the profiles that showed the CPU mostly spending time in GC land.
I'm building Go 1.14.2 right now (and then lnd with it) to see how it goes.
Talkless
on 15 Apr 2020
Still went into berserk mode:
Talkless
on 16 Apr 2020
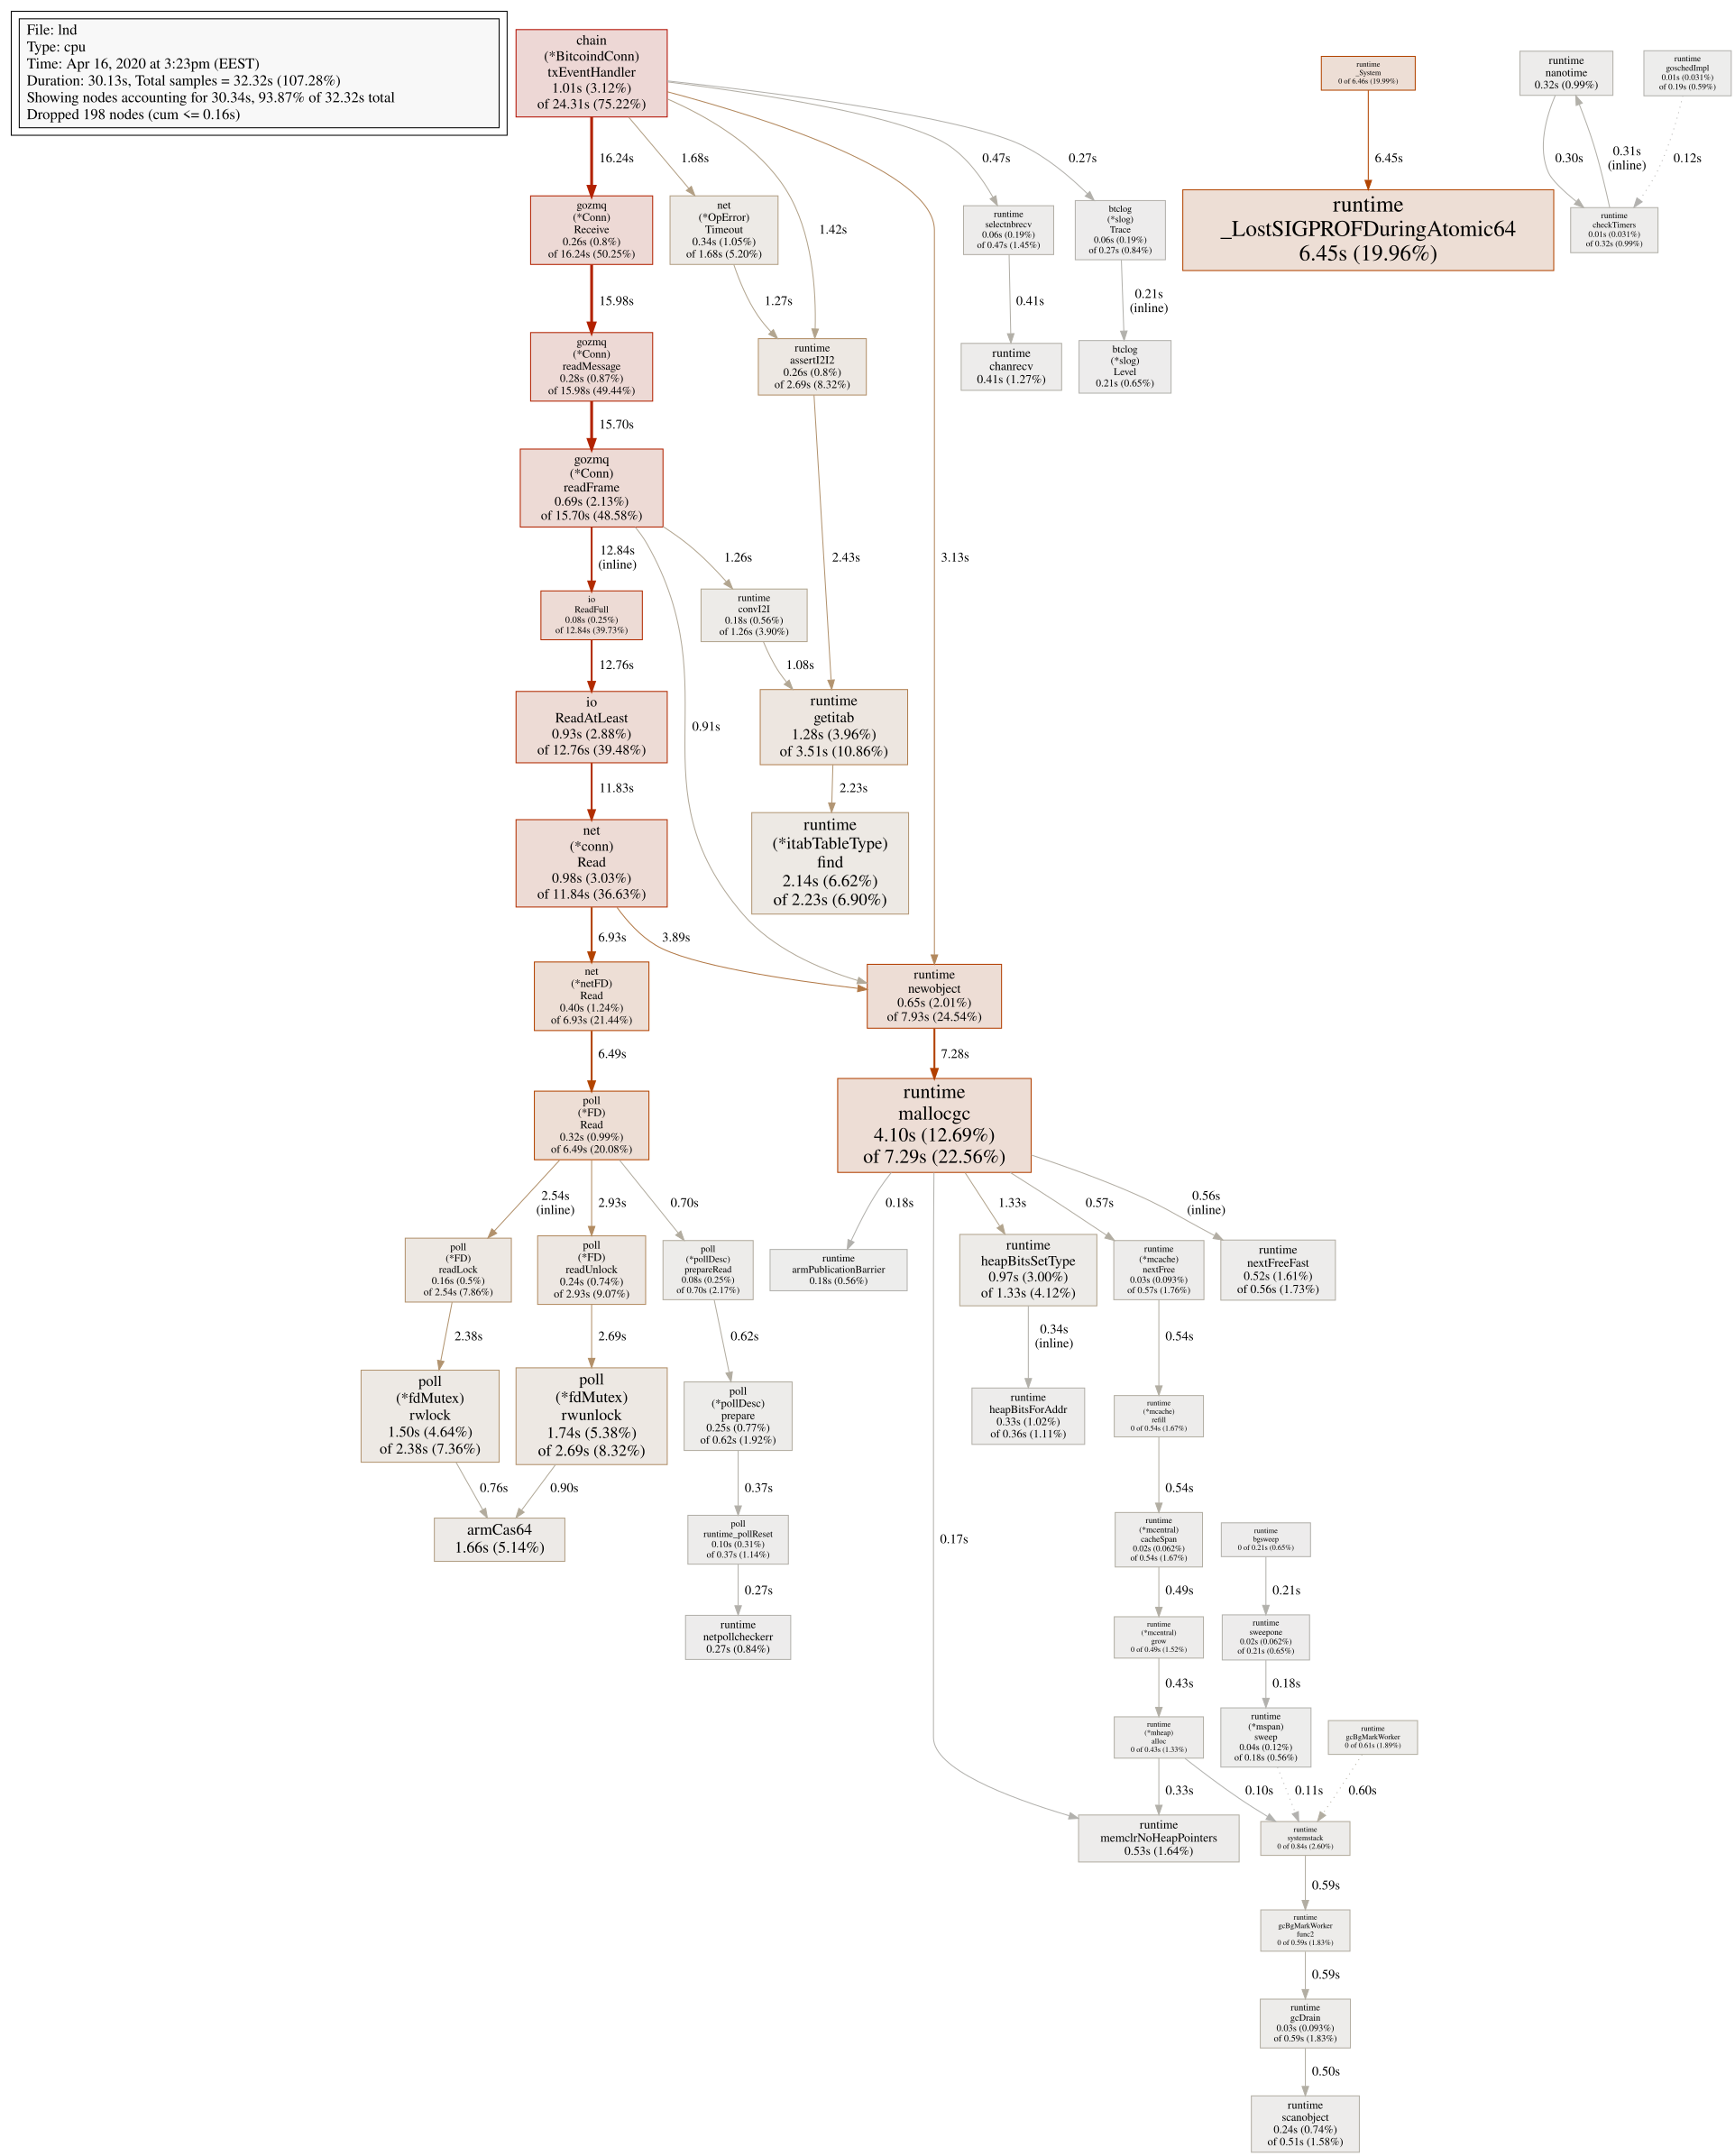
Profile:
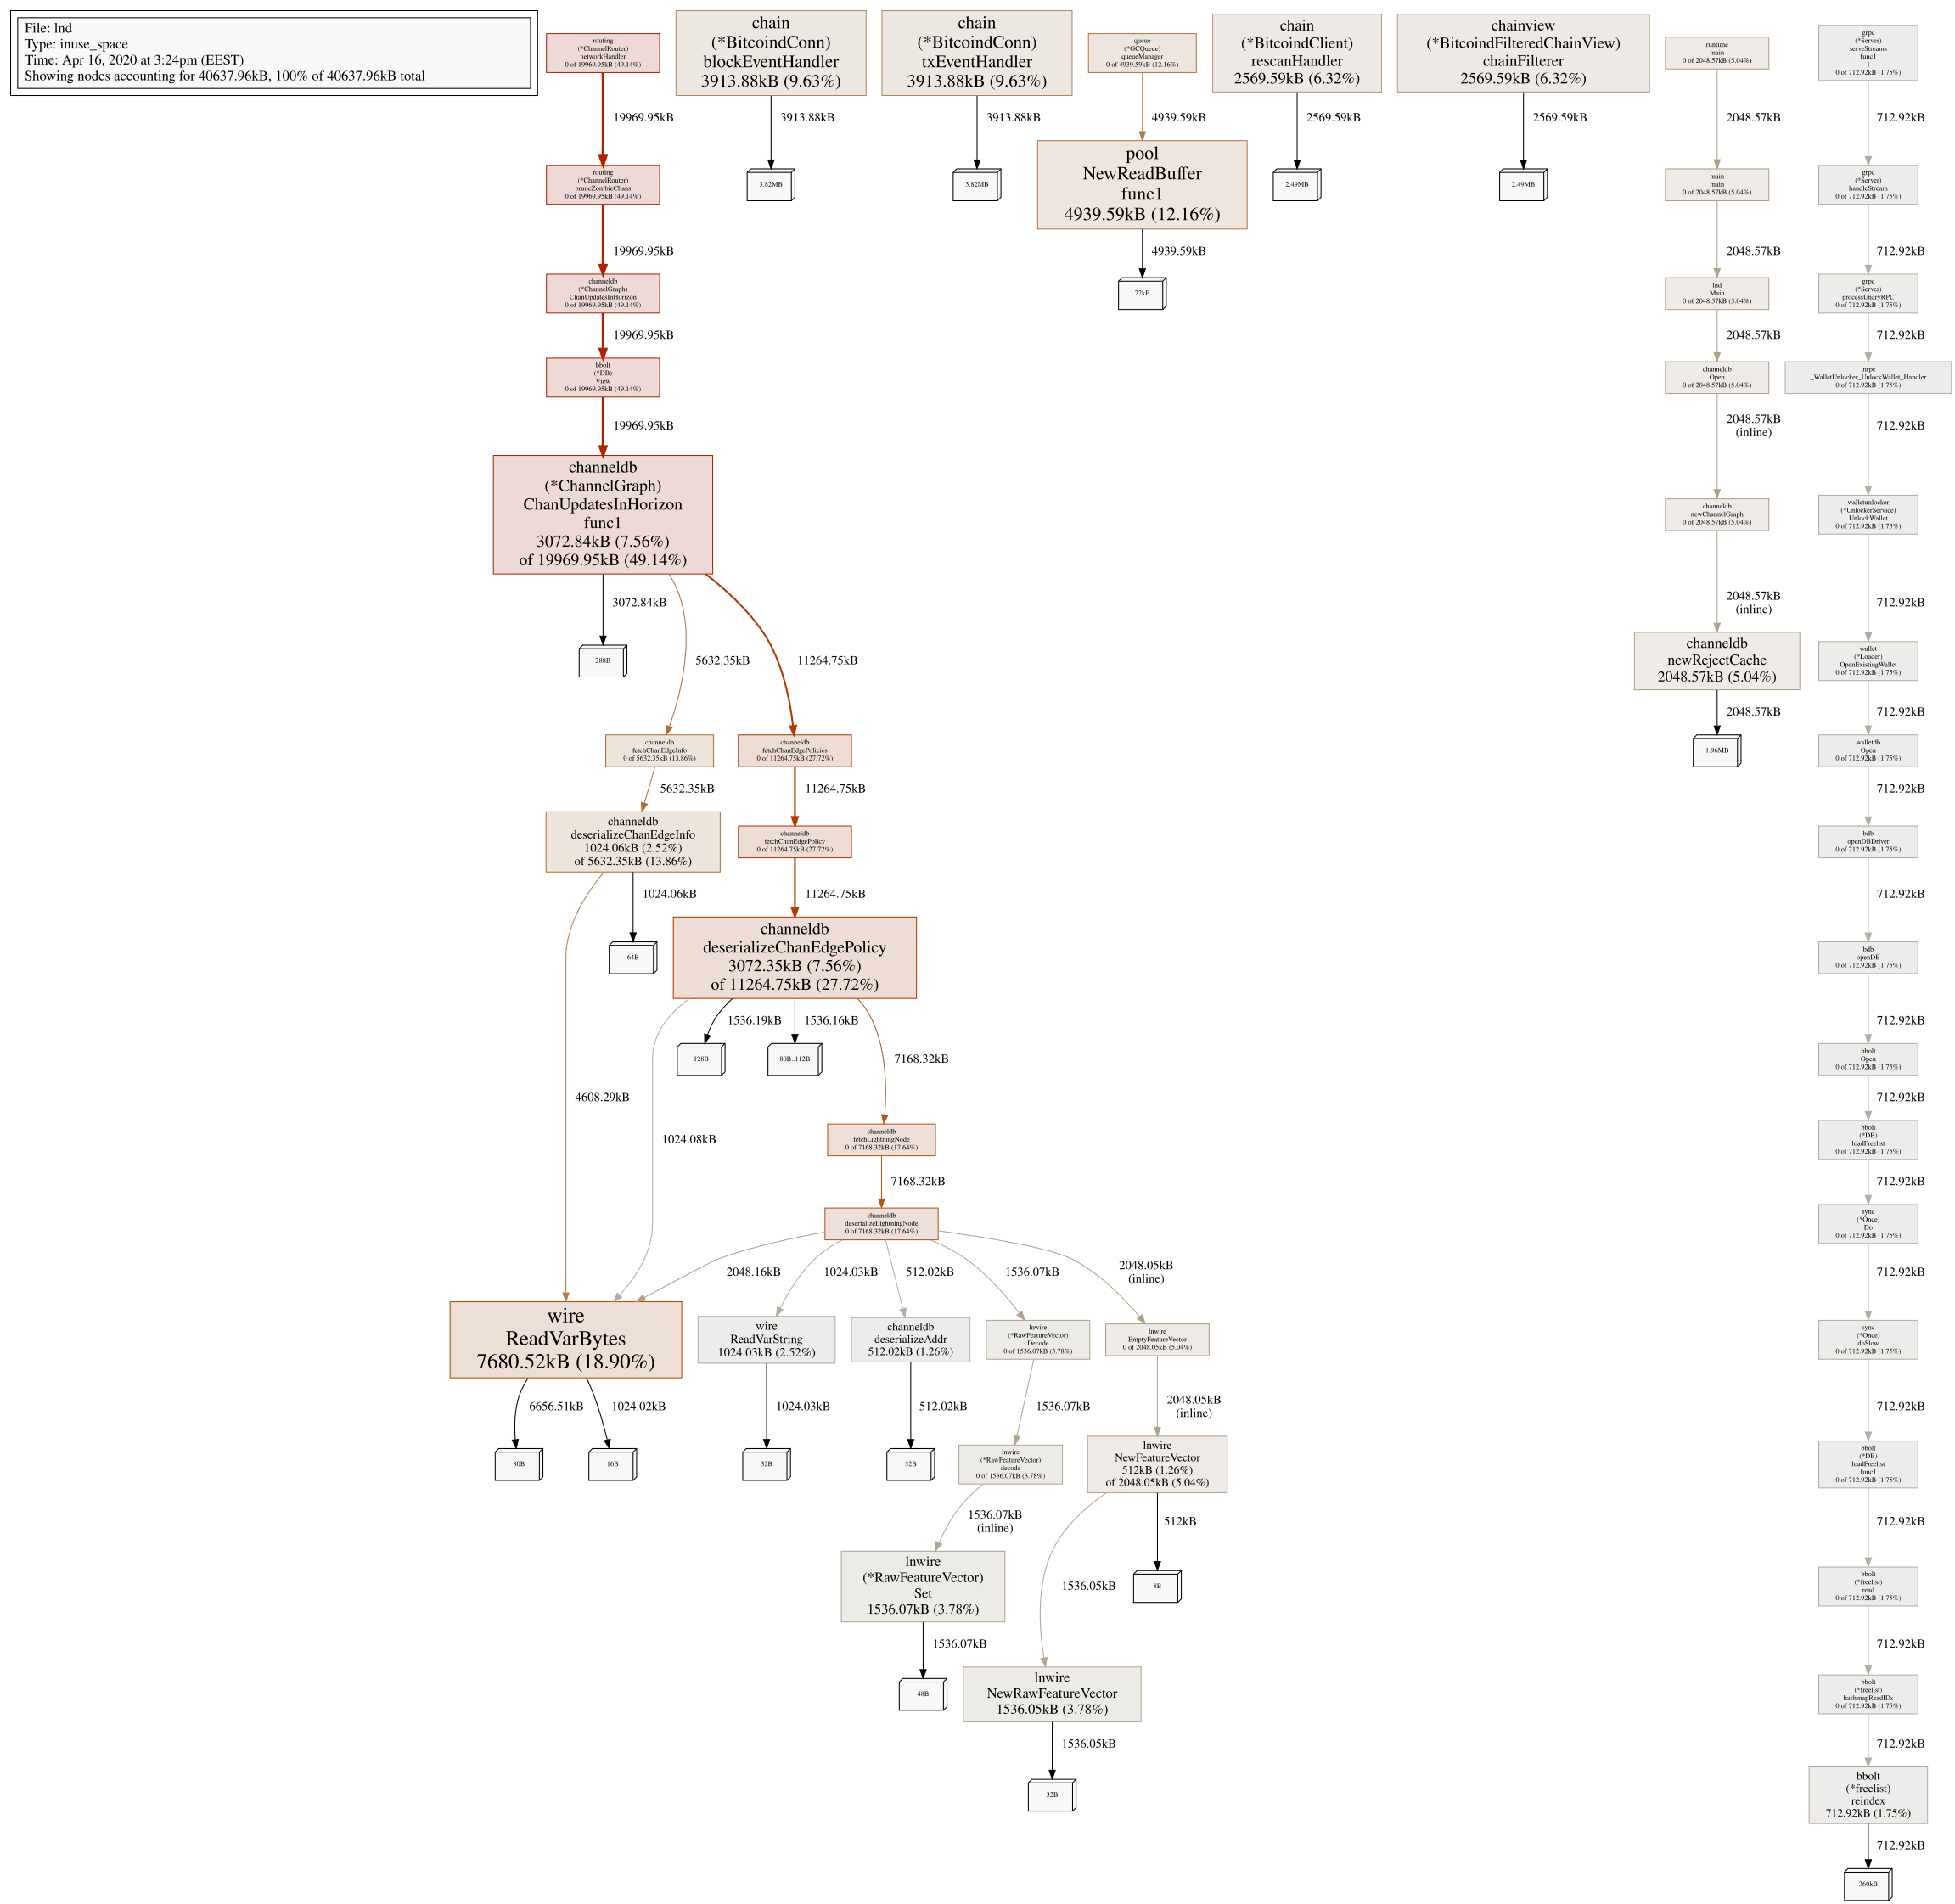
Heap:
Talkless
on 16 Apr 2020
Hi, since finding the root-cause will take some time, I wrote an auto-remediation https://github.com/alevchuk/minibank/blob/master/scripts/REMEDIATION.md
alevchuk
on 16 Apr 2020
Hi, since finding the root-cause will take some time, I wrote an auto-remediation alevchuk/minibank:scripts/REMEDIATION.md@
master
Is a kill 9 after 30 seconds a good idea? It's certainly possible that payments can take longer than that to settle and I'd be hesitant to force kill. I've thought about making a script like this before to autorestart lnd when cpu hits 100% but I'd probably want to wait much longer before a kill 9. I'd be happy to try your script out tho if the issue persists.
FWIW, I upgraded yesterday to 0.10-rc1 and go 1.14.2. So far it's still normal but I'll update here if/when it goes back to 100%.
sangaman
on 16 Apr 2020
Is a kill 9 after 30 seconds a good idea? It's certainly possible that payments can take longer than that to settle and I'd be hesitant to force kill.
Good point. In a high CPU situation payments can take longer. I bumped it to 1 minute.
I upgraded yesterday to 0.10-rc1 and go 1.14.2. So far it's still normal
I ran in to the same issue with go 1.14.2 and Talkless also showed that same GC issue still happens
alevchuk
on 16 Apr 2020
Thanks for the new information, I'm still unable to reproduce this on my end as well. However the issue seems to be isolated to "meager" single board computers with a single (or two) CPUs. It seems that the machine isn't able to keep up with the heap growth and GC either falls behind or goes haywire.
Roasbeef
on 16 Apr 2020
Thanks for the new information, I'm still unable to reproduce this on my end as well. However the issue seems to be isolated to "meager" single board computers with a single (or two) CPUs. It seems that the machine isn't able to keep up with the heap growth and GC either falls behind or goes haywire.
I'm one of those running lnd on a single board computer, although it's a pretty strong cpu as far as SBCs go. I don't think this issue should be overlooked for that reason though, as I expect that a lot of enthusiasts and individual operators will be using sbcs or similarly modest hardware. The fact that it's happening on cloud instances as well covers a lot of other users too and means it's not isolated to SBCs only.
This is also something that certainly is avoidable, I've been running lnd on the same hardware since around ~0.3 and I never used to see it. Now it hovers under 10% CPU usage for around a day, before suddenly spiking to 100%+ fully occupying one core at all times. I think any attempt to reproduce this needs to wait a couple of days (I'm past 24 hours from my last restart and still at low cpu, but I expect that will change). I realize that makes it a very tricky bug to squash, I just don't want it to be overlooked. Thanks.
sangaman
on 16 Apr 2020
the issue seems to be isolated to "meager" single board computers with a single (or two) CPUs
@Roasbeef Negative.
This issue started occuring to me after upgrading lnd while running on rpi3, which has ARMv7 Processor rev 4 (v7l) with 2 cores (4 threads). This effectively made rpi3 unresponsive. I migrated lnd to a desktop machine i7-950 with 4 cores and 8 threads. The issue is present on this machine as well. However, it is able to handle such load, so I am still running it there. This is definitely not isolated to 1/2 cpu cores.
To be honest I don't understand how you cannot reproduce. I on the other hand cannot avoid it, even after migrating to different hardware and regularly upgrading to latest release. Come on guys, this is serious and has not been fixed for 9 months! Honestly, once I find some time I am determined to migrate to c-lightning if this is still not fixed by that time.
janvojt
on 16 Apr 2020
@Roasbeef while I would agree reading the thread I am still not convinced. Isn't it simply a reflection of your demographics? Enthusiastic home users not yet willing togive it a 100W CPU 24/7. Would you have access to statistics?
I was running it on a 2.4GHz x86, not a single board arm. But indeed, had given it only one core.
LLeny
on 17 Apr 2020
I was running it on a 2.4GHz x86, not a single board arm. But indeed, had given it only one core.
FWIW, my cpu has 8 cores. Although it is ARM.
sangaman
on 17 Apr 2020
home users not yet willing togive it a 100W CPU 24/7
Well, as I said, I run lnd 24/7 on a standard desktop machine with ~600W power source, Intel i7 950 CPU with 4 cores. It has more power lnd needs, and can handle the load. However without lnd my load average is <0.1, with lnd running after several hours all cores are quite busy and load average is above 1.1. One release before the issue started occurring I had been running on a raspberry pi for about a year 24/7 without problems.
janvojt
on 17 Apr 2020
To be honest I don't understand how you cannot reproduce.
I also run lnd on a VPS with a _single_ "virtual core" and still don't run into this issue.
Roasbeef
on 21 Apr 2020
From @Talkless's latest profile, it looks like his node isn't able to keep up (malloc wise) with the load from ingesting the ZMQ information from bitcoind. Also looking at the heap, only about 40MB is allocated, which isn't much.
Come on guys, this is serious and has not been fixed for 9 months! Honestly, once I find some time I am determined to migrate to c-lightning if this is still not fixed by that time.
If we had actionable information, it would be resolved, but if you follow the history of this issue, nothing actionable has been provided yet.
Is the problem in ZMQ or it's just that ZMQ thread is more active and incidentally one that always ends up triggering gc?
I think this is the case, as it receives a new message each time the backing full node has a new transaction added to its mempool. Overtime, we end up with numerous small-ish (few hundred bytes) allocations in the heap, which then causes a death spiral as the GC is unable to keep up with the pressure, so it then starts to consume more and more CPU in an attempt to collet everything. Perhaps all we need is a buffer pool in this area.
Roasbeef
on 21 Apr 2020
To those that are able to do profiles, can y'all get us the _raw_ profile file? So not the generated svgs, but what the tool produces, then reads to render those svgs.
Roasbeef
on 21 Apr 2020
To those that are able to do profiles, can y'all get us the raw profile file?
I've pasted send.firefox.com link to @wpaulino via IRC.
Talkless
on 21 Apr 2020
I recorded one just now with perf record -F 99 -a -p <PID> -a sleep 60 while the issue is happening.
Here it is: https://github.com/alevchuk/minibank/blob/master/incidents/i1/perf.data
and same with call graph perf record -F 99 -ag -p <PID> -a sleep 60
Here it is: https://github.com/alevchuk/minibank/blob/master/incidents/i1/perf_with_call_graph.data
(i don't have privacy concerns about this node, so posting publicly)
alevchuk
on 21 Apr 2020
@alevchuk I've got instructions to do this:
go tool pprof -proto http://localhost:9000/debug/pprof/heap > heap.pb.gz
curl "http://localhost:9000/debug/pprof/heap?debug=1" > heap.txt
(change 9000 to your lnd profile port)
Talkless
on 21 Apr 2020
To those that are able to do profiles, can y'all get us the raw profile file?
Providing raw profile file of a production node might reveal private keys or other lightning-related data that may be used to steal funds in the wallet/channels, is that correct? (I am thinking whether I could also provide the raw file, so asking just to be sure this is what was meant by "those that are able").
janvojt
on 26 Apr 2020
Good news everyone! @wpaulino may have found a fundamental solution. As one would expect w/ issues like this, turns out to be a pretty small fix (like 1 line). We're doing more testing on it, but should have a PR up soon. If it holds up, we'd like to get it into 0.10 (if not, 0.10.1).
Roasbeef
on 27 Apr 2020
Nice!!
alevchuk
on 27 Apr 2020
Good news everyone! @wpaulino may have found a fundamental solution. As one would expect w/ issues like this, turns out to be a pretty small fix (like 1 line). We're doing more testing on it, but should have a PR up soon. If it holds up, we'd like to get it into 0.10 (if not, 0.10.1).
Awesome, looking forward to testing the PR once it's open. Kudos to @wpaulino.
sangaman
on 28 Apr 2020
@alevchuk @sangaman could you test https://github.com/lightningnetwork/lnd/pull/4230? @Talkless has for the past few days and hasn't run into any issues so far, but some more confirmation would be nice.
wpaulino
on 28 Apr 2020
God thanks, That fixed so damn much. SSH to the Server running LND needed > 30 seconds to connect. ZAP Controlling this wallet needed seconds to react. Now everything is smooth again. Let‘s see if the high CPU usage is also gone. But I am very optimistic. Very good work!
 derHase85
on 29 Apr 2020
derHase85
on 29 Apr 2020
Have been running #4230 for 34 hours and no issues with high load. Seems the issue is mitigated by the timeout increase. Thank you!
janvojt
on 30 Apr 2020
Running for 3 days now, and my load average is is above 1 again. Seems the fix did not do it for me. I am curious what others will say.
janvojt
on 2 May 2020
@janvojt load average does not say much. Is it actually lnd that uses CPU? I run it almost for a week without issues after the patch.
Talkless
on 2 May 2020
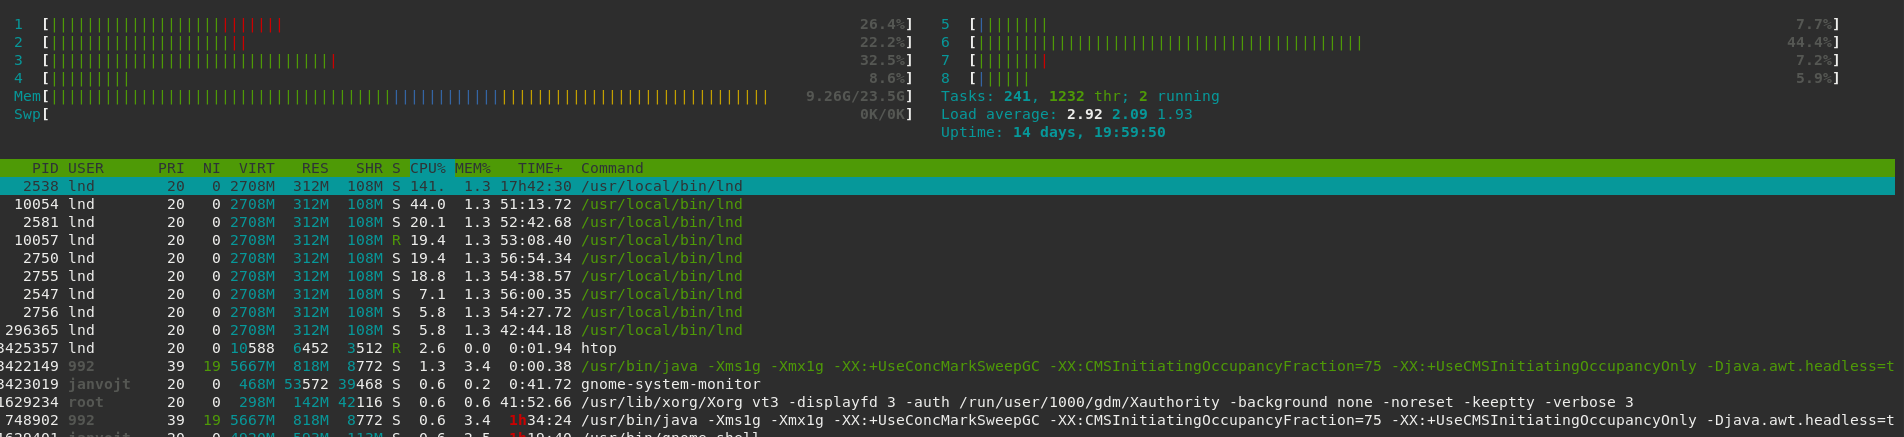
@Talkless understood. Obviously, I checked with htop sorting by CPU%, and the lnd processes were at the top taking practically all of the CPU power used. There were around 6 lnd processes/threads hogging the CPU. I restarted the service yesterday, have been running for 11 hours, and the CPU load is low so far. If it keeps spiking after several days, I can try to create the profile image others did previously. I am afraid I cannot provide raw profile file, because as far as I understand I would be putting the funds at risk.
Thinking about it now, it could be that increasing the timeout talking to zmq only prolonged the time till it propagates. I will see whether I can reproduce it again. Maybe lowering the timeout could provide us with easy reproduction, as that has been problem for dev team. Anyway, I see the fix has been merged into master, so we will see how this works for other people.
janvojt
on 2 May 2020
Closing this for now as the root cause seems to have been found.
I am afraid I cannot provide raw profile file, because as far as I understand I would be putting the funds at risk.
Profiles don't contain the in-memory data, only the objects/structures themselves. Showing a profile won't expose private keys.
Roasbeef
on 14 May 2020
For the record, I still get this, but it takes much longer till it propagates. It sometimes takes 3 days, sometimes 2 weeks. Once it gets into such state, it stays there. I will try to get the profile so you can act on it, although I understand even if this gets reopen it will probably be lower priority.
Is anyone else still getting this?
lnd version 0.10.0-beta.rc5 commit=v0.10.0-beta.rc5-1-gc039aee0590866d0d6b4cb0fa7d7c6ff4ee551ed
● lnd.service - LND Lightning Daemon
Loaded: loaded (/etc/systemd/system/lnd.service; enabled; vendor preset: enabled)
Active: active (running) since Mon 2020-05-11 11:44:15 CEST; 2 weeks 0 days ago
janvojt
on 26 May 2020
Is anyone else still getting this?
Yes, I'm seeing the exact same thing. I wasn't running with profiling the first time it happened, but I am now and am waiting for it to happen again.
sangaman
on 26 May 2020
Can y'all get us another profile?
Roasbeef
on 26 May 2020
@Roasbeef I have the raw profiles. I messaged @wpaulino via IRC today, but he is not responding. I do not want to post it publicly.
janvojt
on 27 May 2020
@janvojt I just hadn't checked, feel free to send them over.
wpaulino
on 27 May 2020
My node runs absolutely perfect since last fix implementation.
@janvojt It looks like you stuck in another issue. The original issue had locked with one CPU core with 100% utilization, so I had to run a multicore virtual server for LND.
It looks like there is high utilization of your node because of another type of workload, so I would recommend opening a separate issue for better investigation.
begetan
on 3 Jun 2020
@begetan yes, we can keep this closed. I did further investigation which revealed there were networking issues in communication between lnd and bitcoind. I had them connected via wifi with a rather weak signal (which I did not know about, but had ~10% packet loss, retransmissions, duplicate ACKs...), which evidently caused lnd to overload. After solving the networking issues it is running fine. I consulted this with @wpaulino over IRC a week ago, so mentioning it here as well. Sorry for the trouble.
janvojt
on 3 Jun 2020
My node runs absolutely perfect since last fix implementation.
Yes, mine too.
Talkless
on 3 Jun 2020
Likewise, all my nodes 100% well since the fix.
alevchuk
on 3 Jun 2020
My BTCPAY needs almost a weekly reboot because LND end up using very high CPU
 Transisto
on 23 Jul 2020
Transisto
on 23 Jul 2020
@Transisto Are you running your Bitcoin backend in Pruned mode?
 gkrizek
on 16 Sep 2020
gkrizek
on 16 Sep 2020
Related issues
 stevenroose
·
3Comments
stevenroose
·
3Comments
 MrManPew
·
3Comments
MrManPew
·
3Comments
 Richard87
·
3Comments
Richard87
·
3Comments
 ealymbaev
·
3Comments
ealymbaev
·
3Comments
 pm47
·
3Comments
pm47
·
3Comments
Most helpful comment
Good news everyone! @wpaulino may have found a fundamental solution. As one would expect w/ issues like this, turns out to be a pretty small fix (like 1 line). We're doing more testing on it, but should have a PR up soon. If it holds up, we'd like to get it into 0.10 (if not, 0.10.1).