Lnd: autopilot: with large values of num_max_channels, the pilot/agent spins unnecessarily consuming CPU
Background
Similarly to issue #910, I'm observing excessive CPU usage on my node (load 3-4), although there is no activity in lnd log (debuglevel=info). Node's uptime is actually around 14 hours and the load didn't settle down.
The only reason I see might be the number of peers/channels (around 200), but I don't suppose high CPU usage is expected when there're no payments going thru. Or am I wrong?
Your environment
- lncli version 0.4.2 commit=b0288d46773ac6d45e5dc4d5e6a80dd3034d0b9f
- Linux server01 4.9.0-6-amd64 #1 SMP Debian 4.9.88-1+deb9u1 (2018-05-07) x86_64 GNU/Linux
- bitcoind 0.16.1
- num_active_channels": 189, "num_peers": 203,
- CPU: Quad-core Intel(R) Celeron(R) CPU J1900 @ 1.99GHz
- RAM: 16GB (lnd uses ~400MB)
- CPU load is 3-4, busy by lnd
 slush0
All 21 comments
If you check the logs, or even bump to debug, what kind of activity do you see? My nodes are usually always like well below 5% CPU usage. In the past, this has been attributed to some faulty nodes reconnecting rapidly and causing us to waste resources on them each time, hopefully by 0.6 we have the #1183 in so nuisance nodes can be automatically detected and banned.
Also if you add --profile=port to your start up logs, then can use pprof to see exactly where the node is spending time at.
 Roasbeef
on 18 Jul 2018
Roasbeef
on 18 Jul 2018
While I have no experience with go profilles, I succeed with exporting these images:
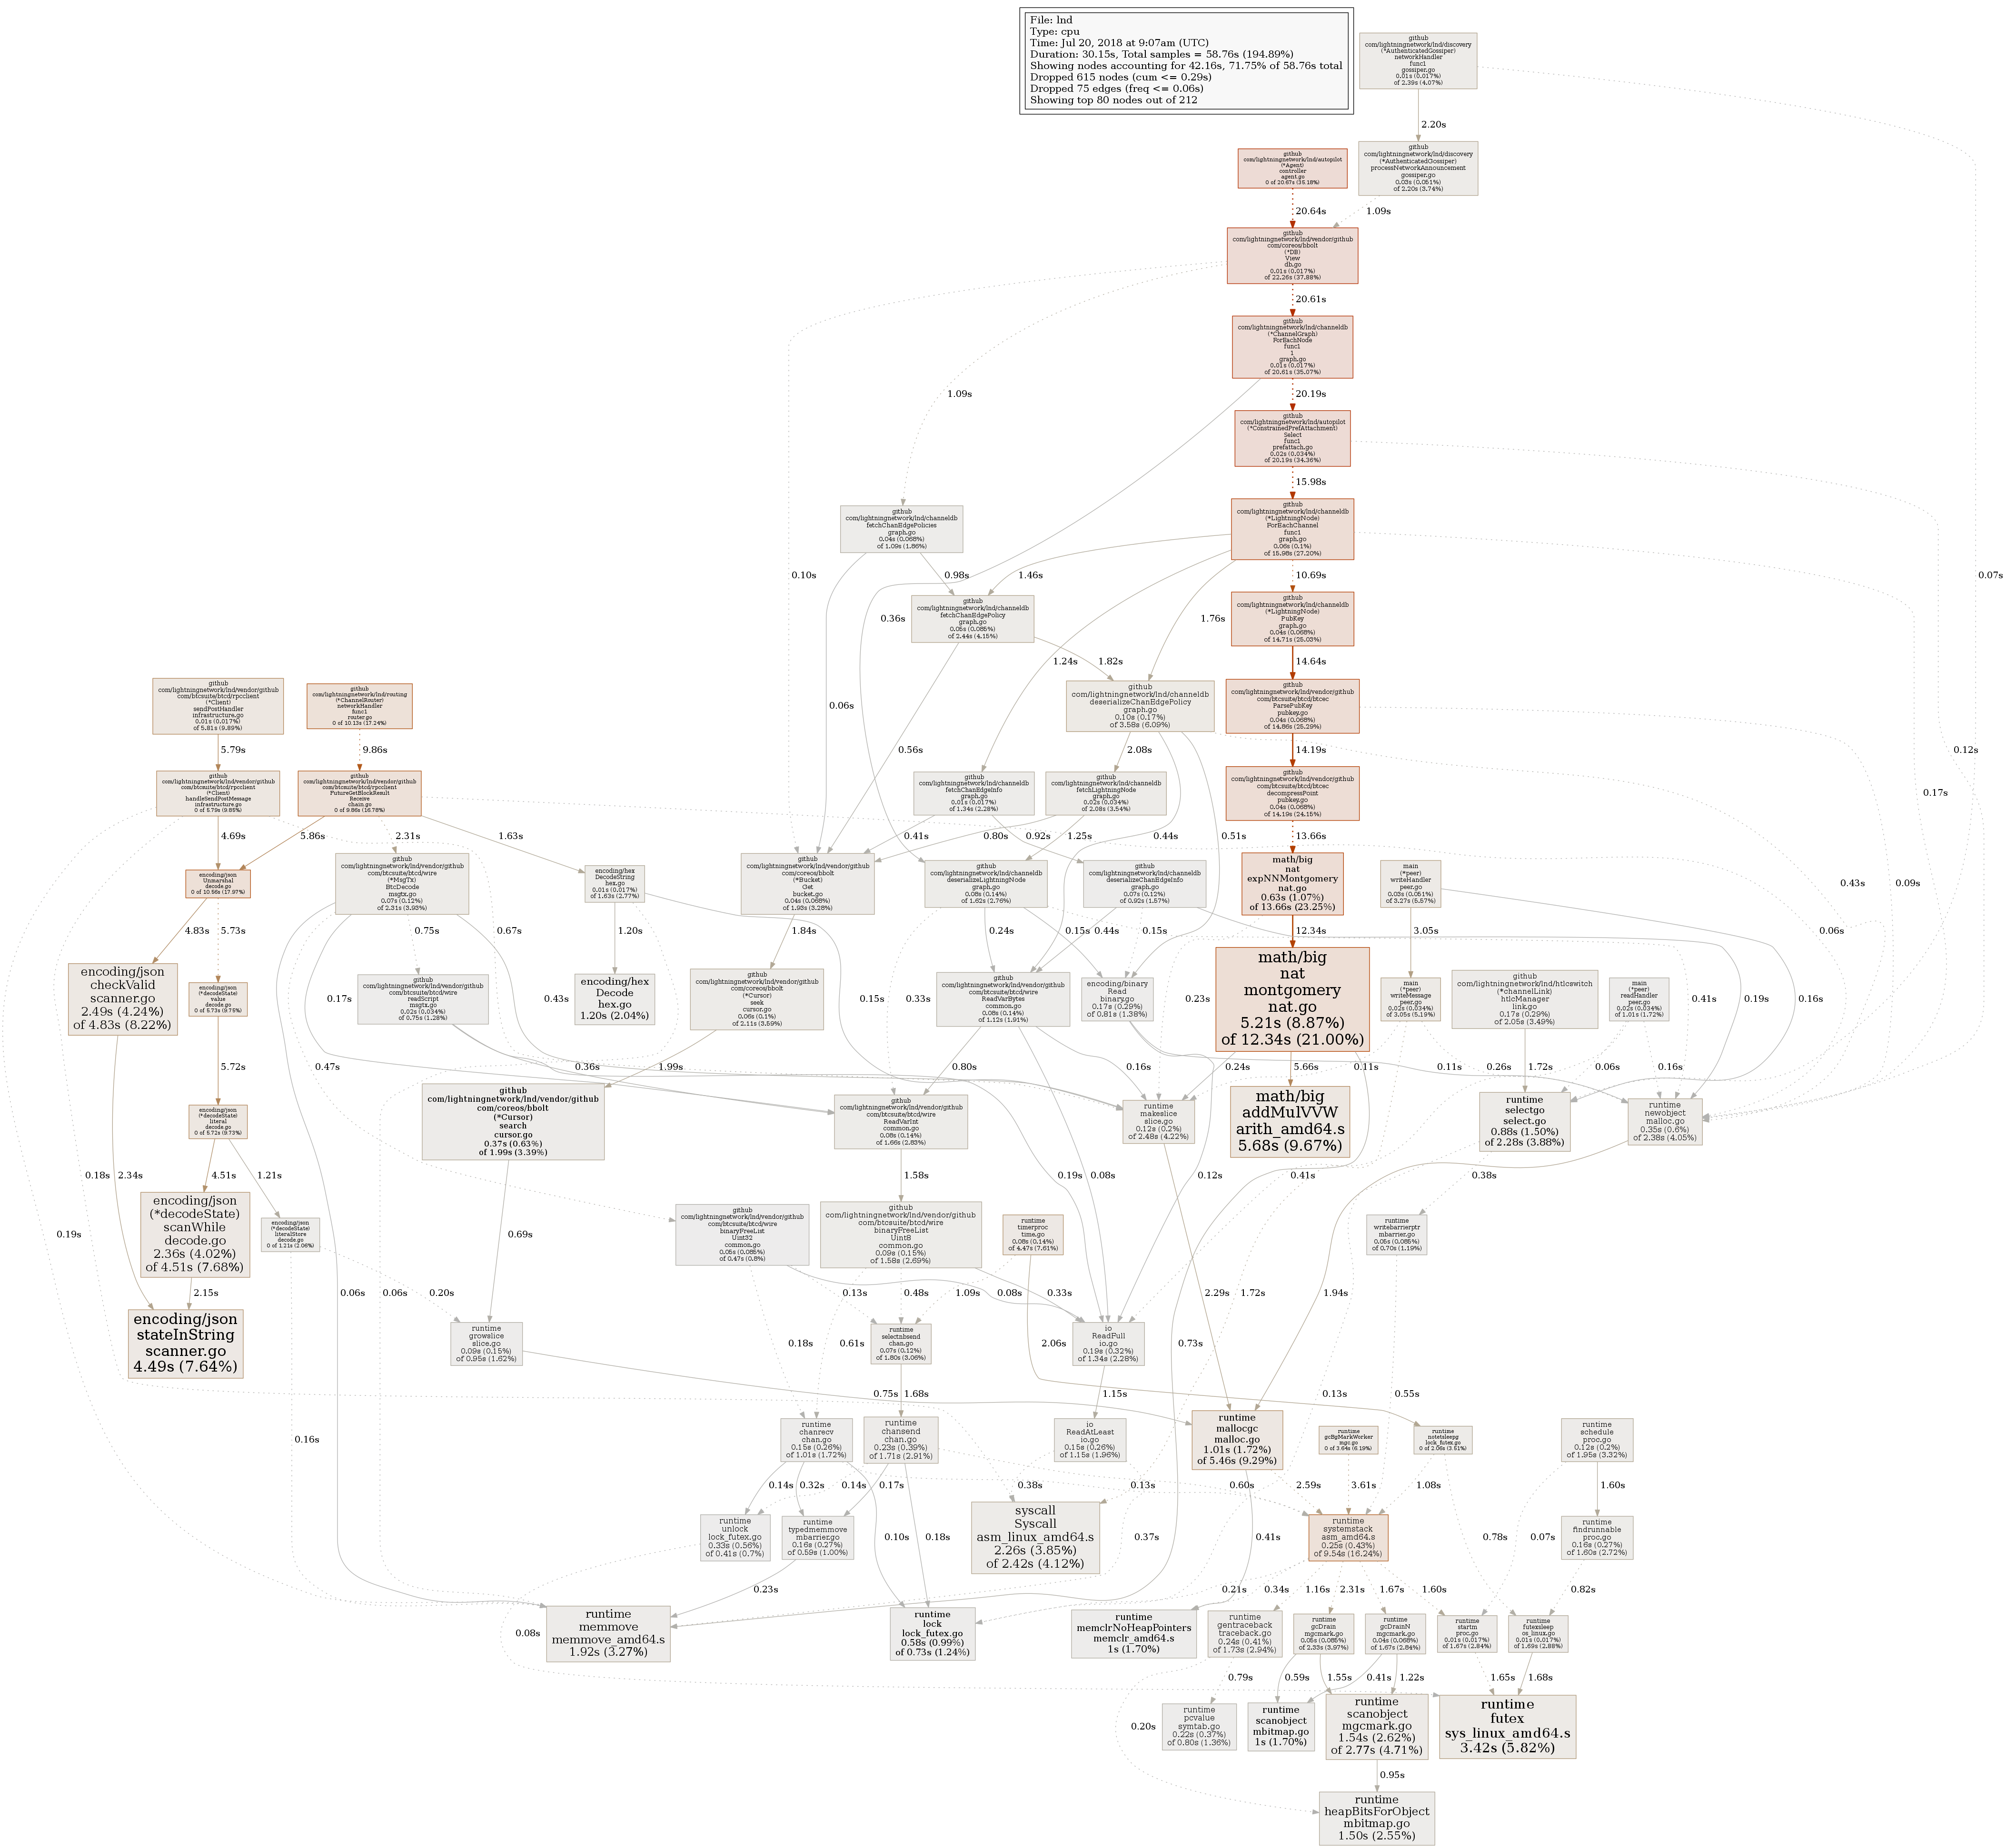
This has been taken after ~15 minutes of CPU time after lnd start from /debug/pprof/profile:
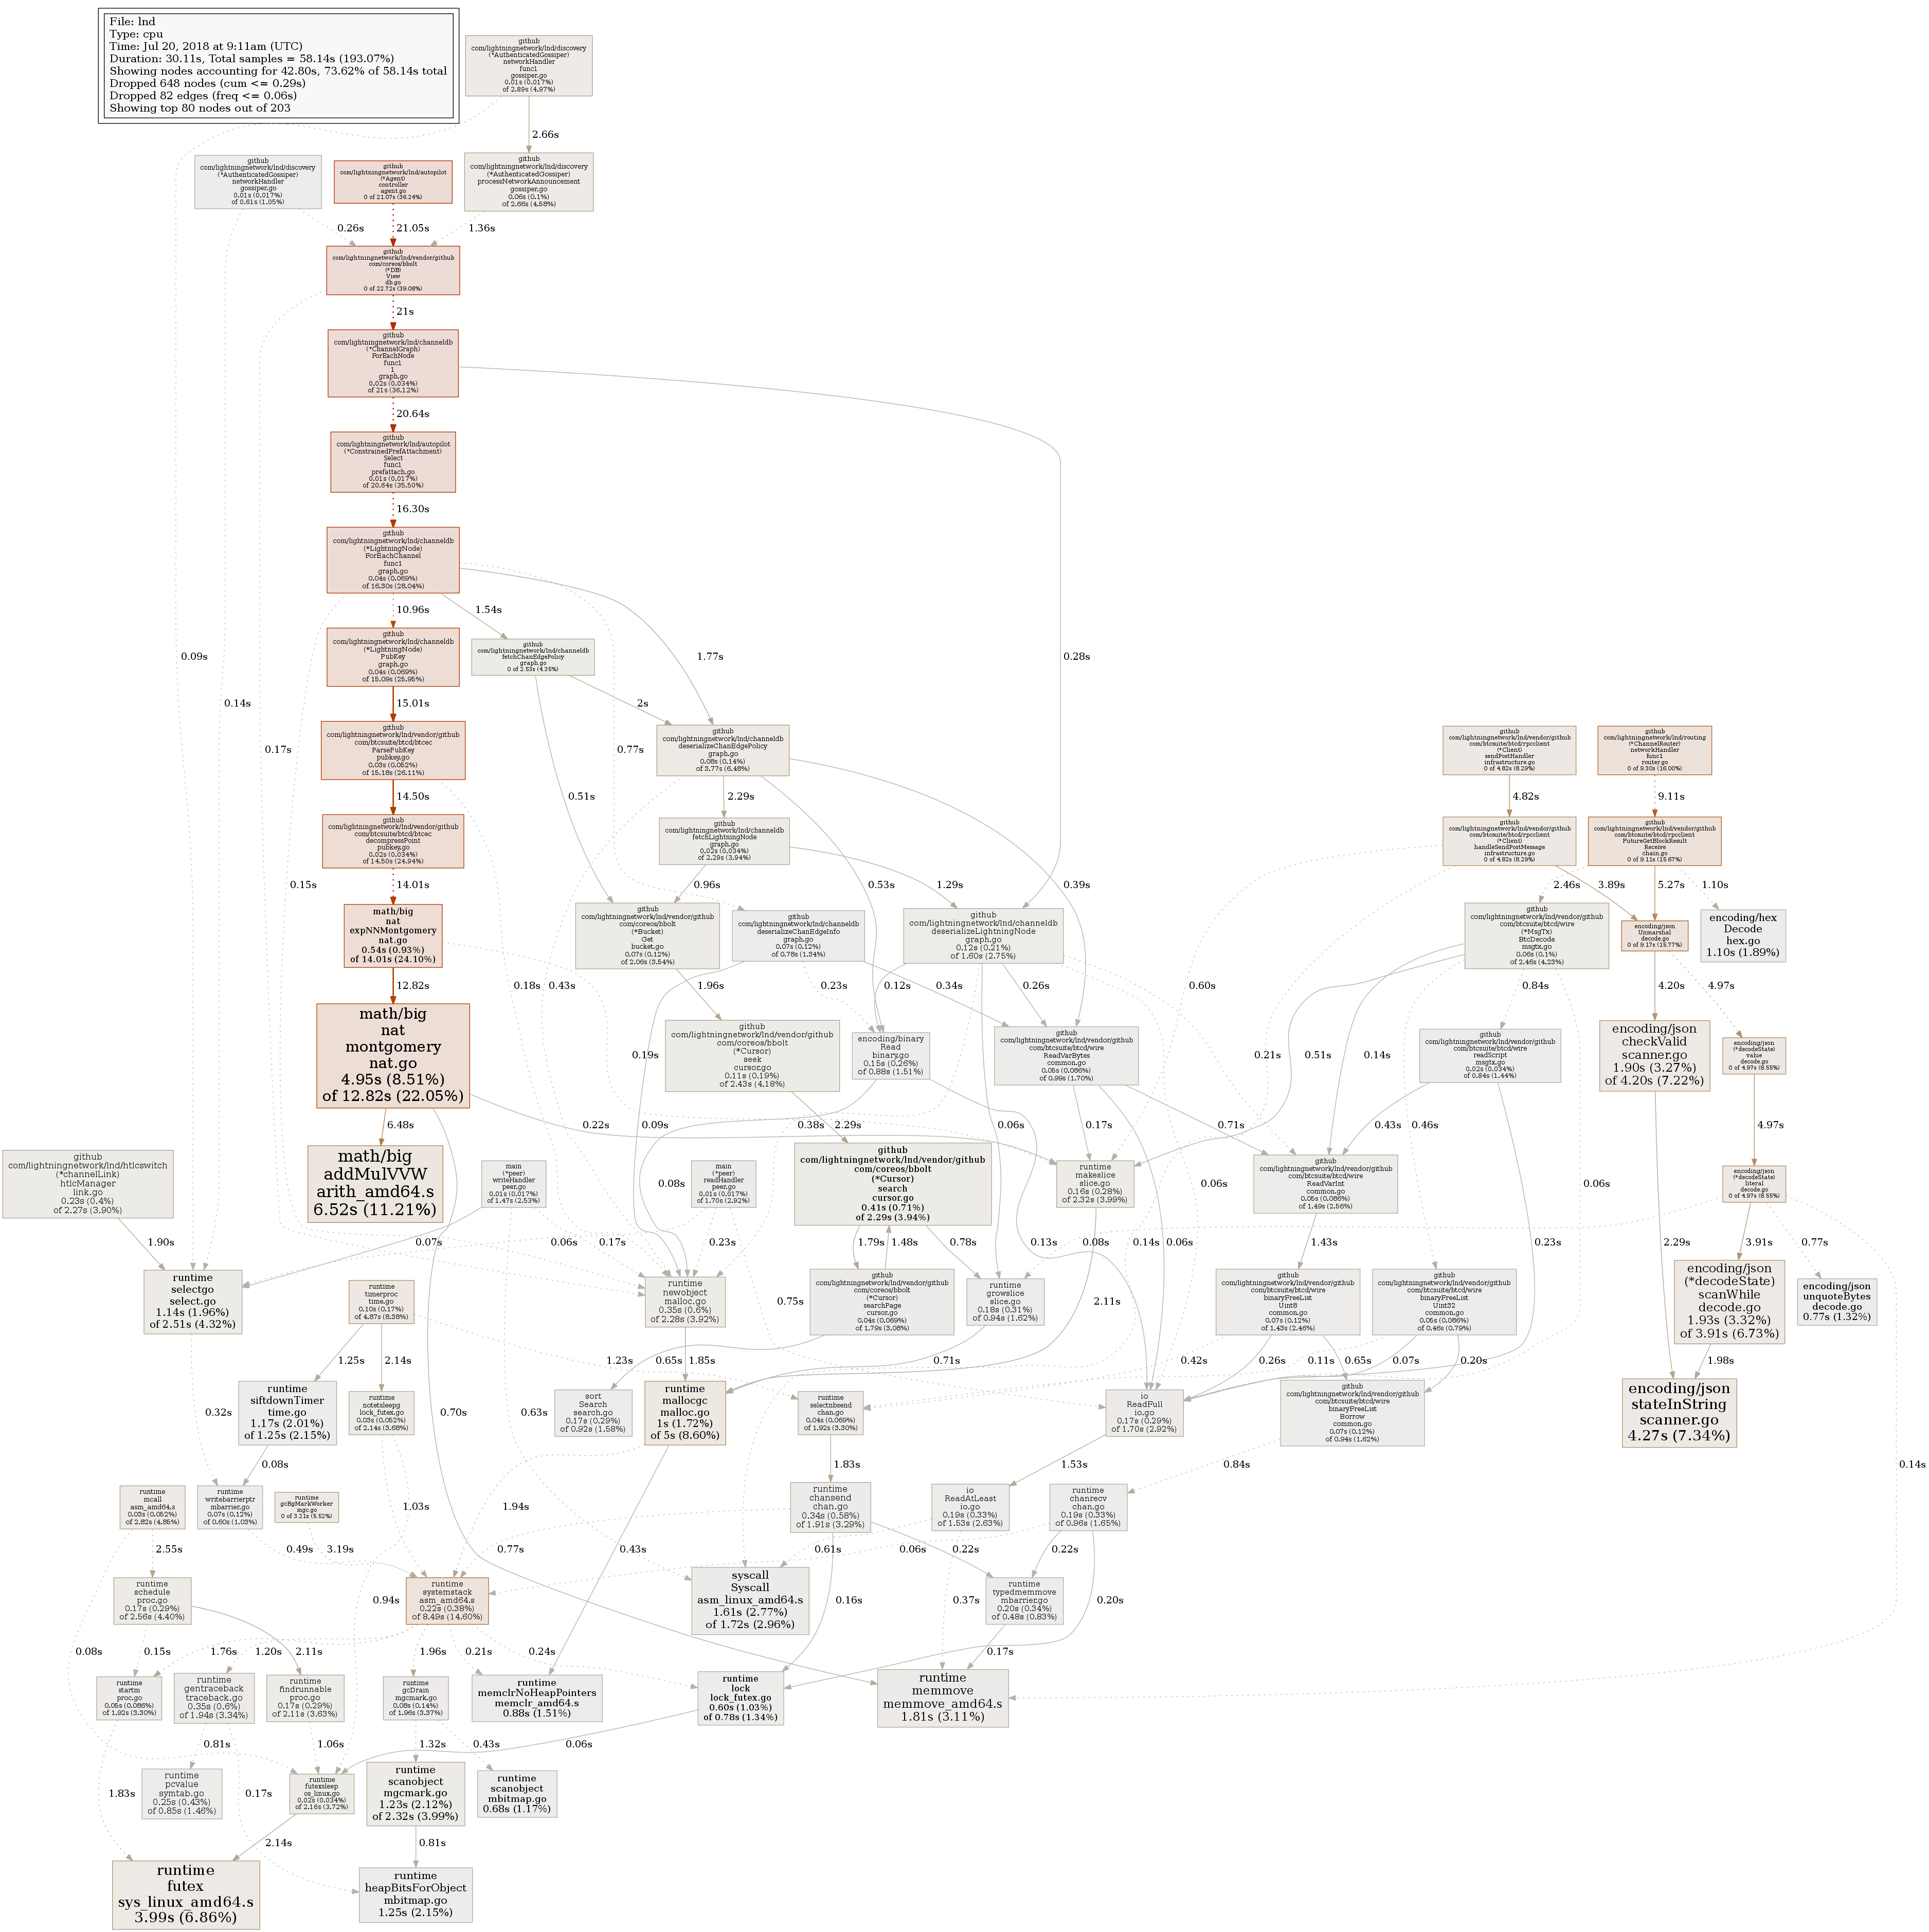
This has been taken after ~35 minutes of CPU time after lnd start from /debug/pprof/profile:
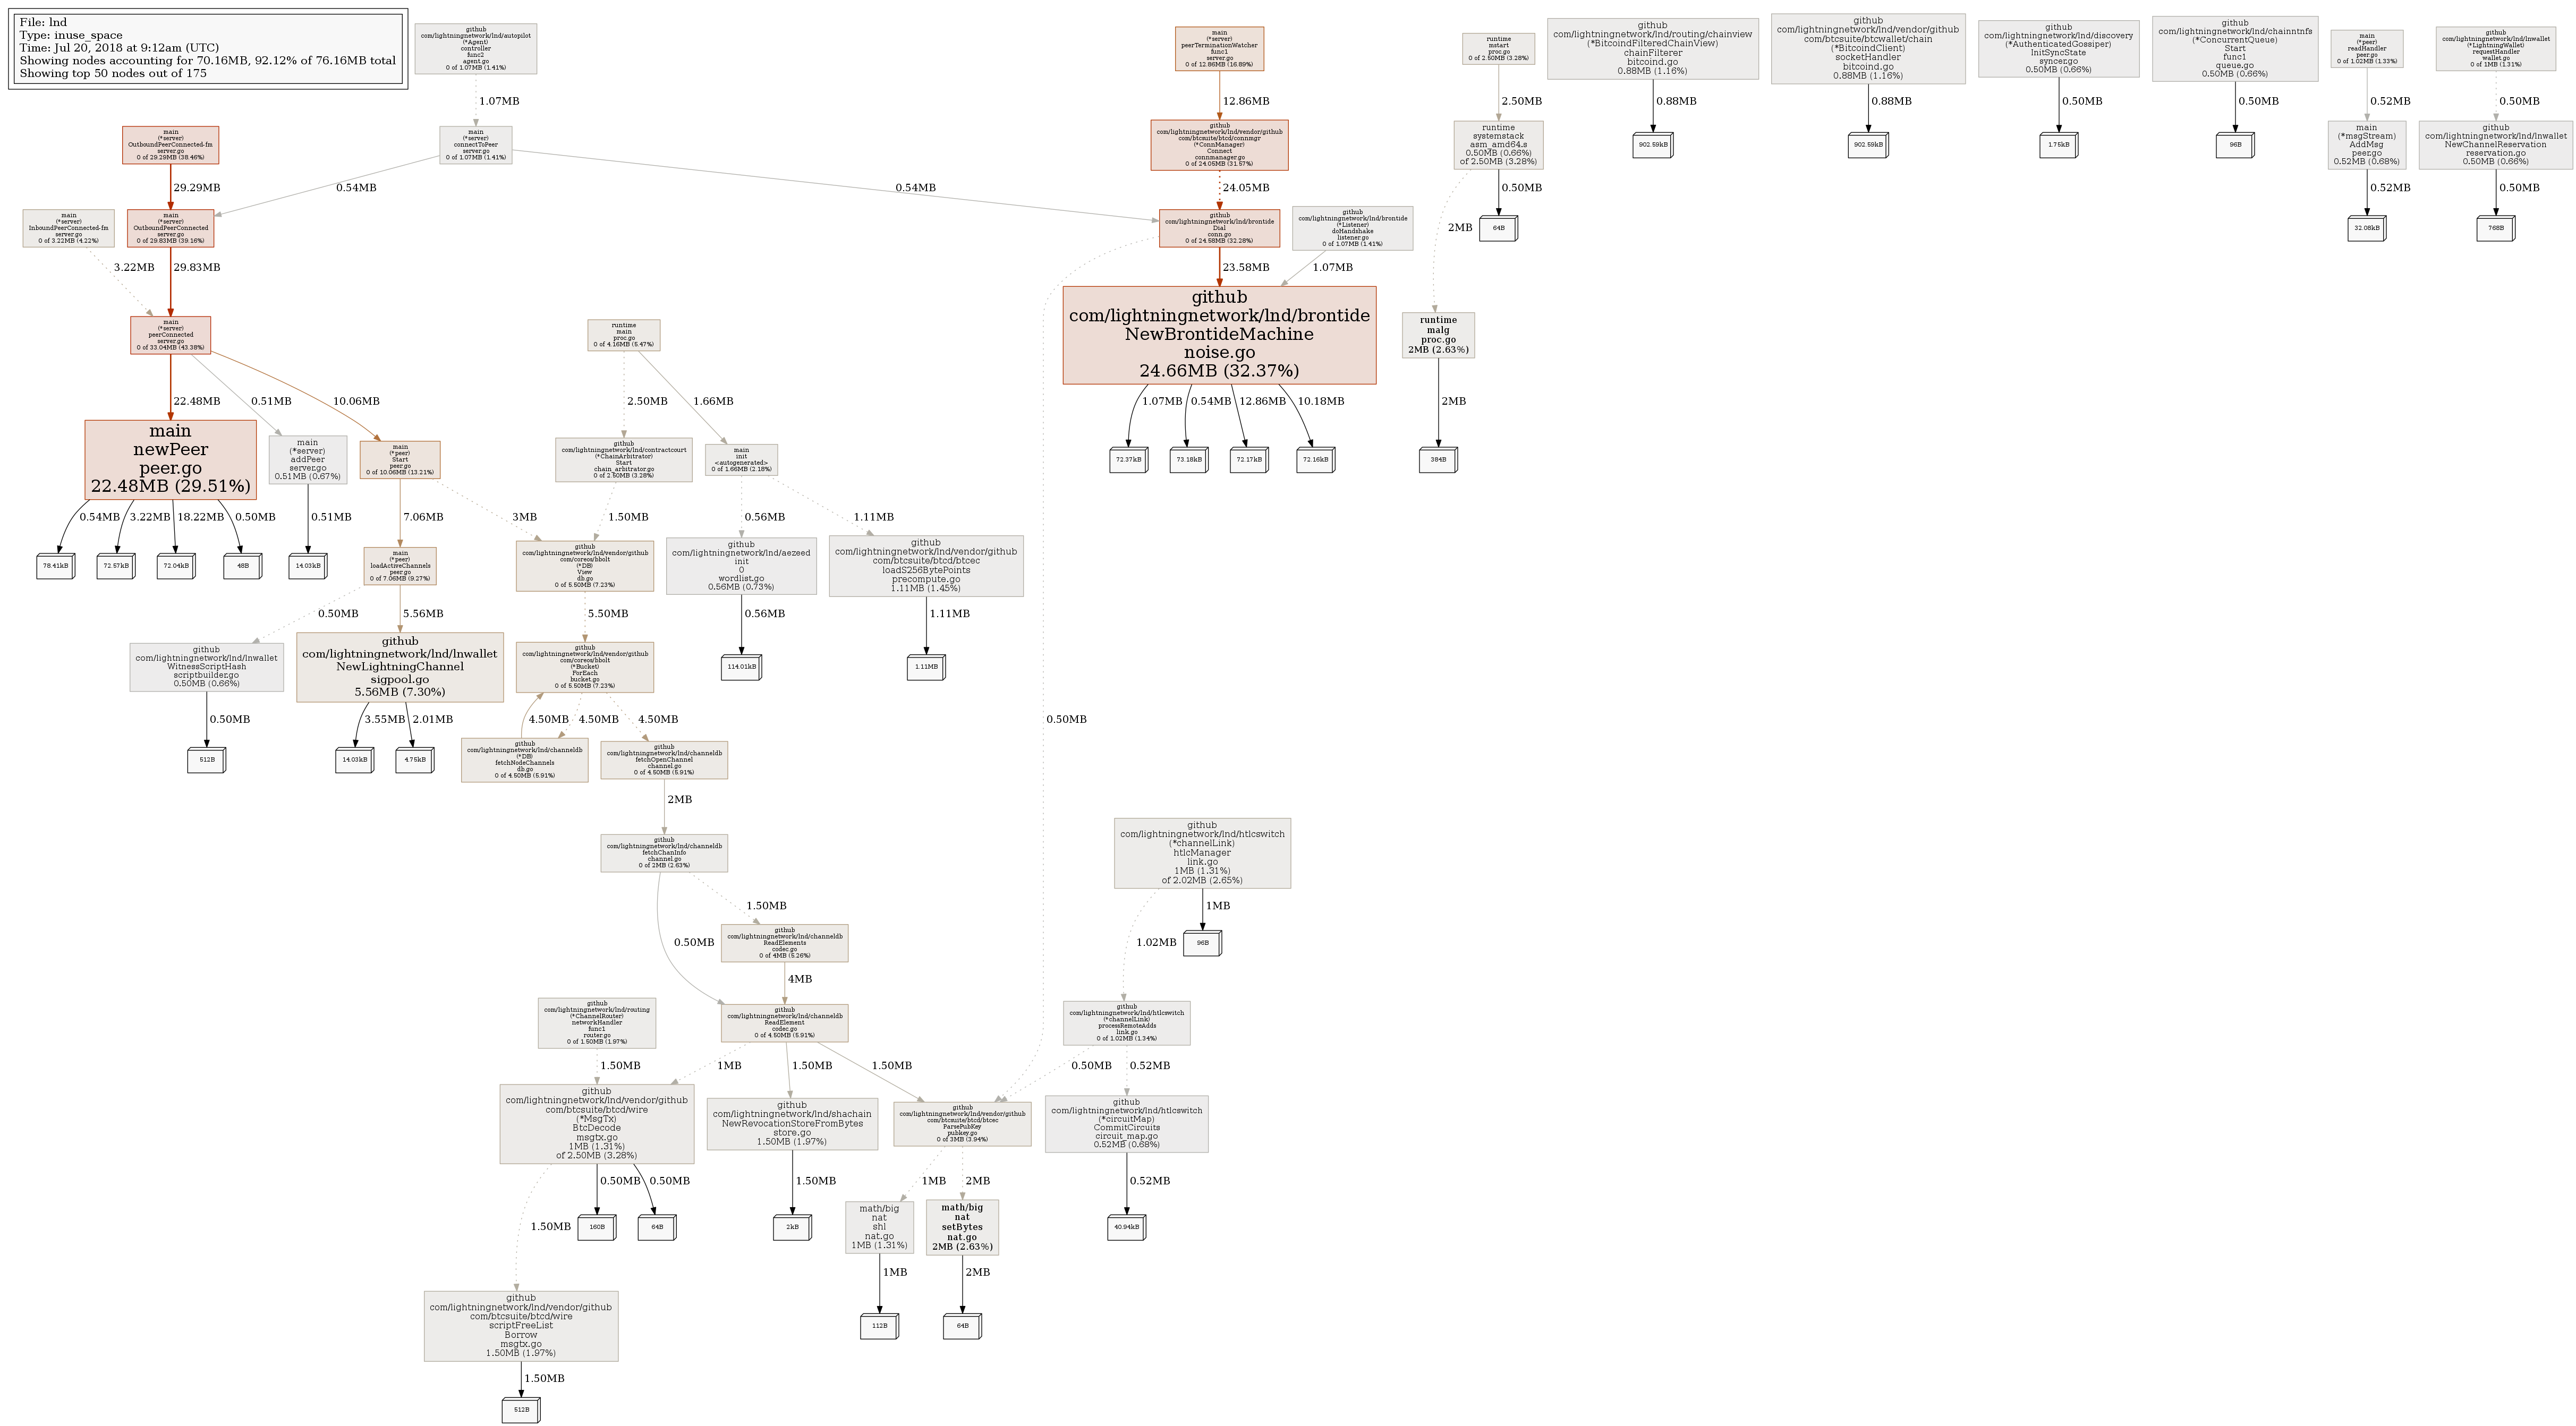
And this is from /debug/pprof/heap:
Not sure if this helps, I don't understand lnd internals too much to learn any information from this.
slush0
on 20 Jul 2018
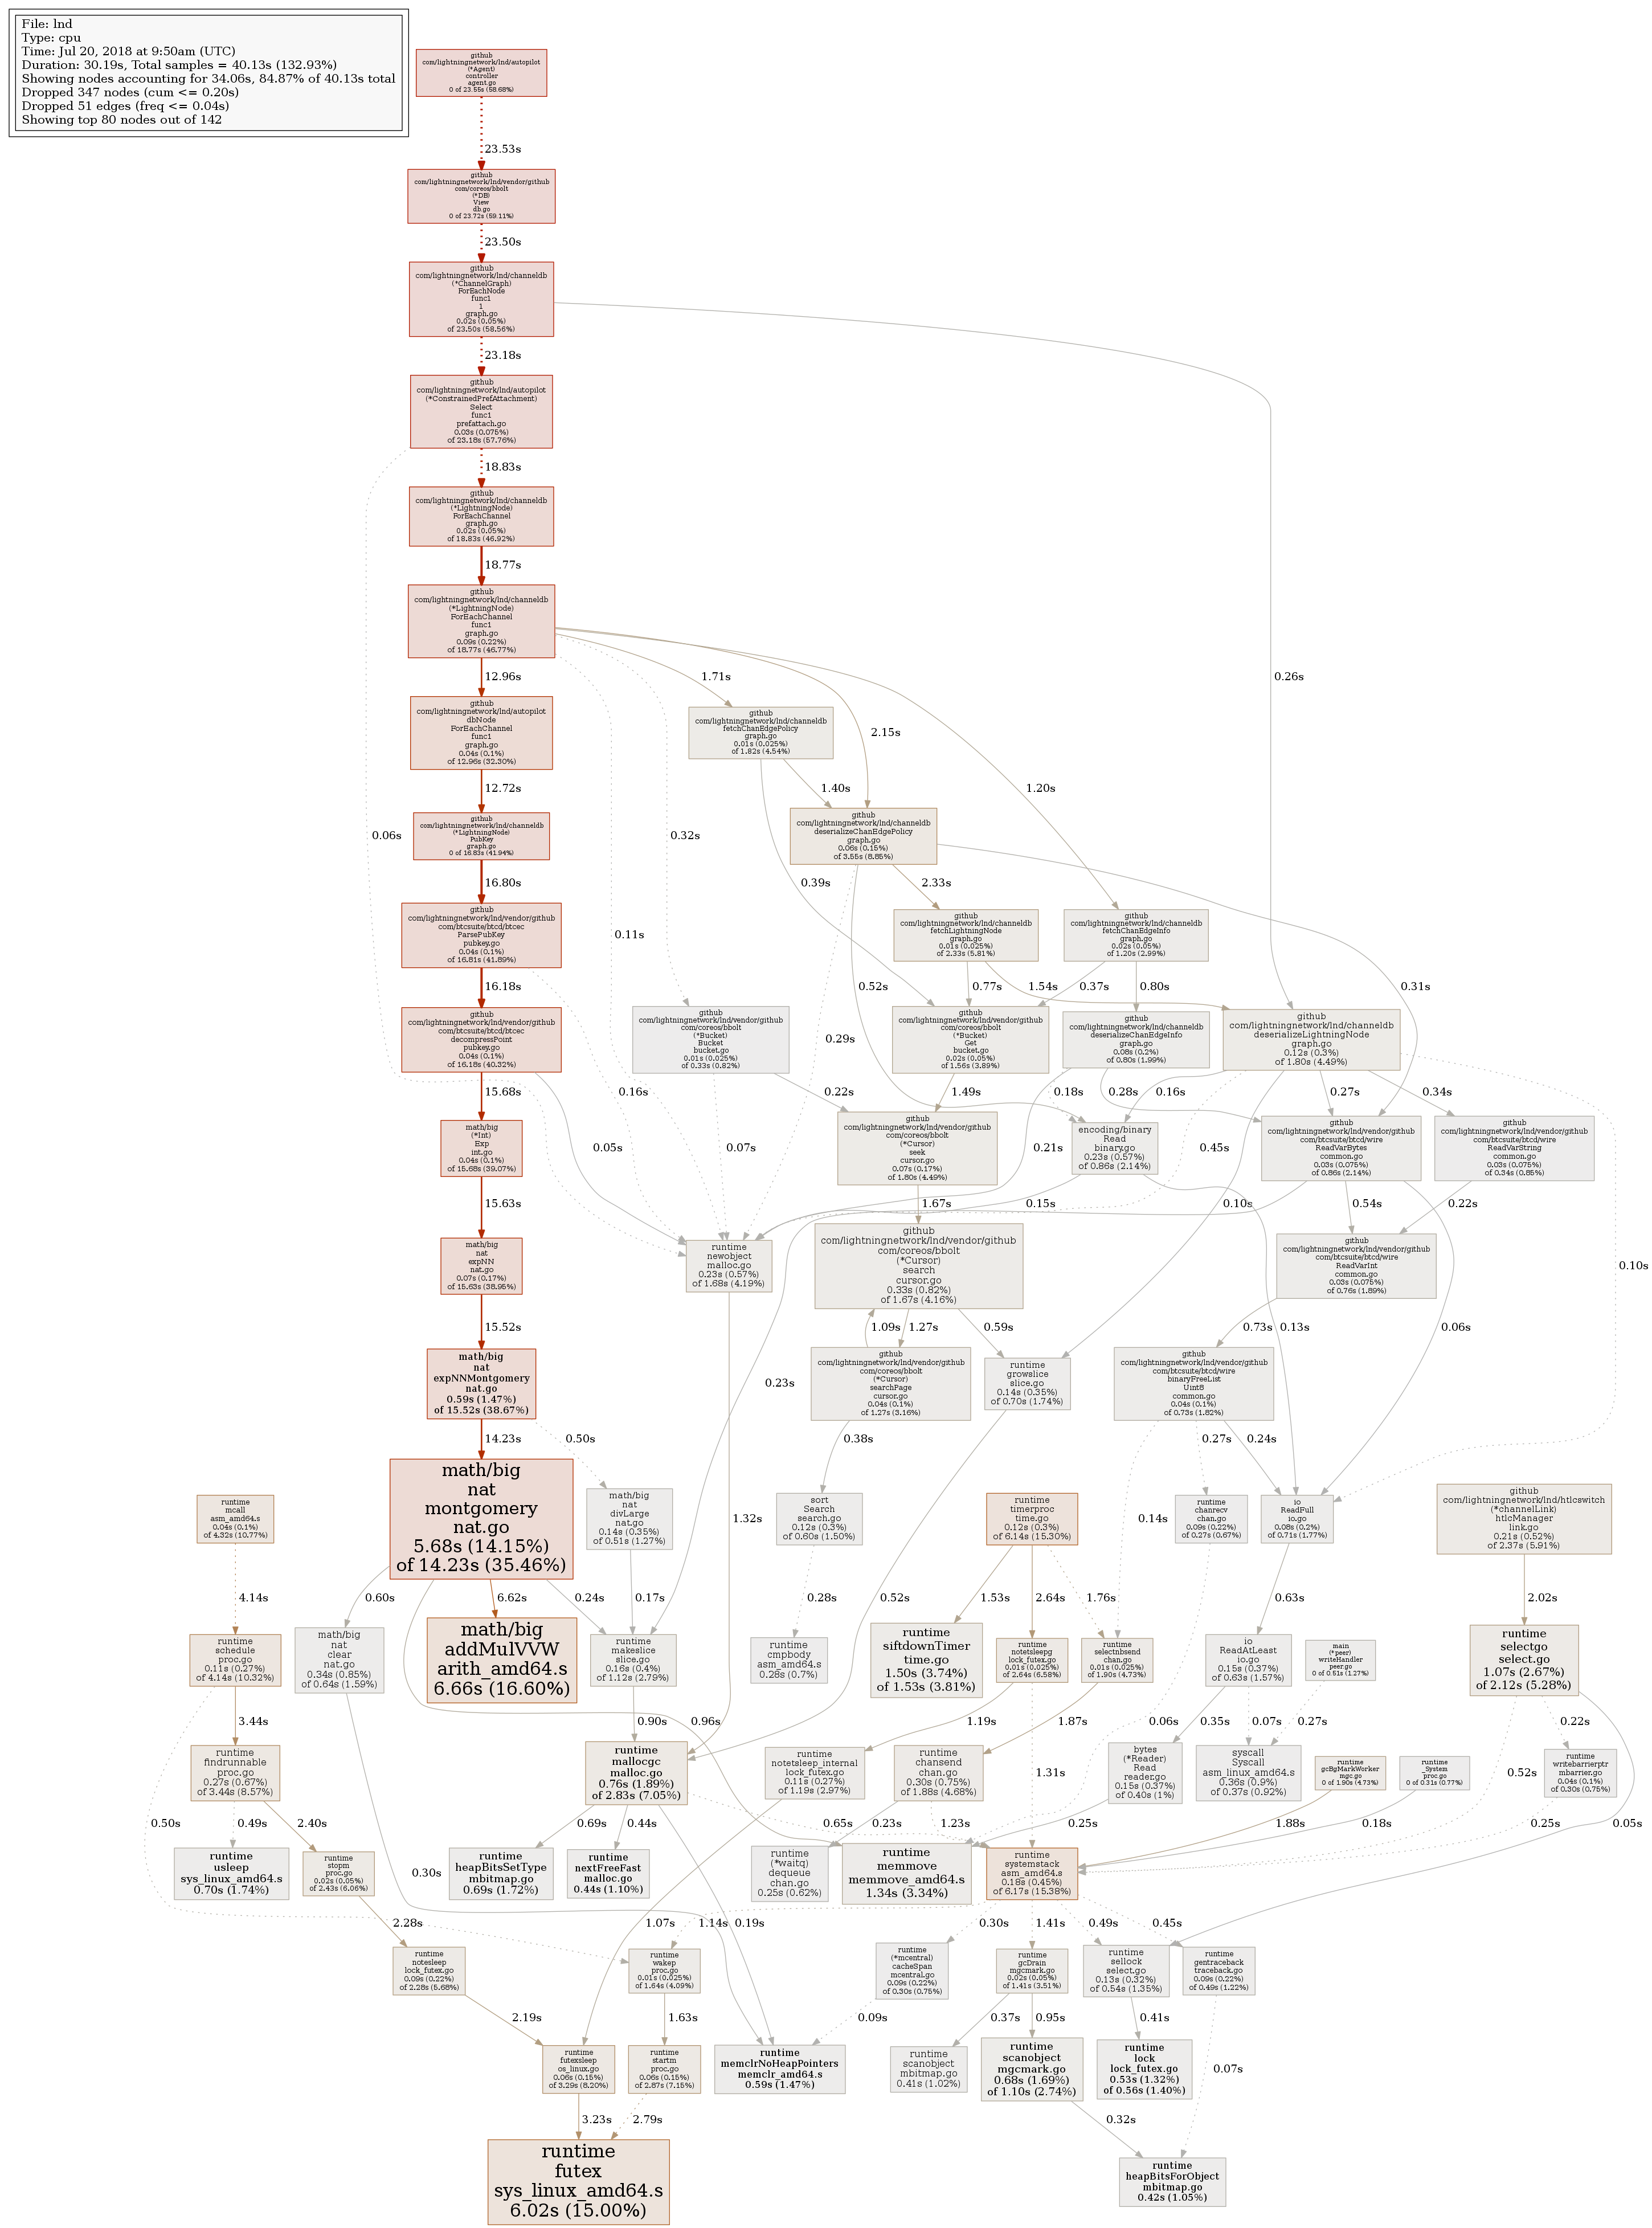
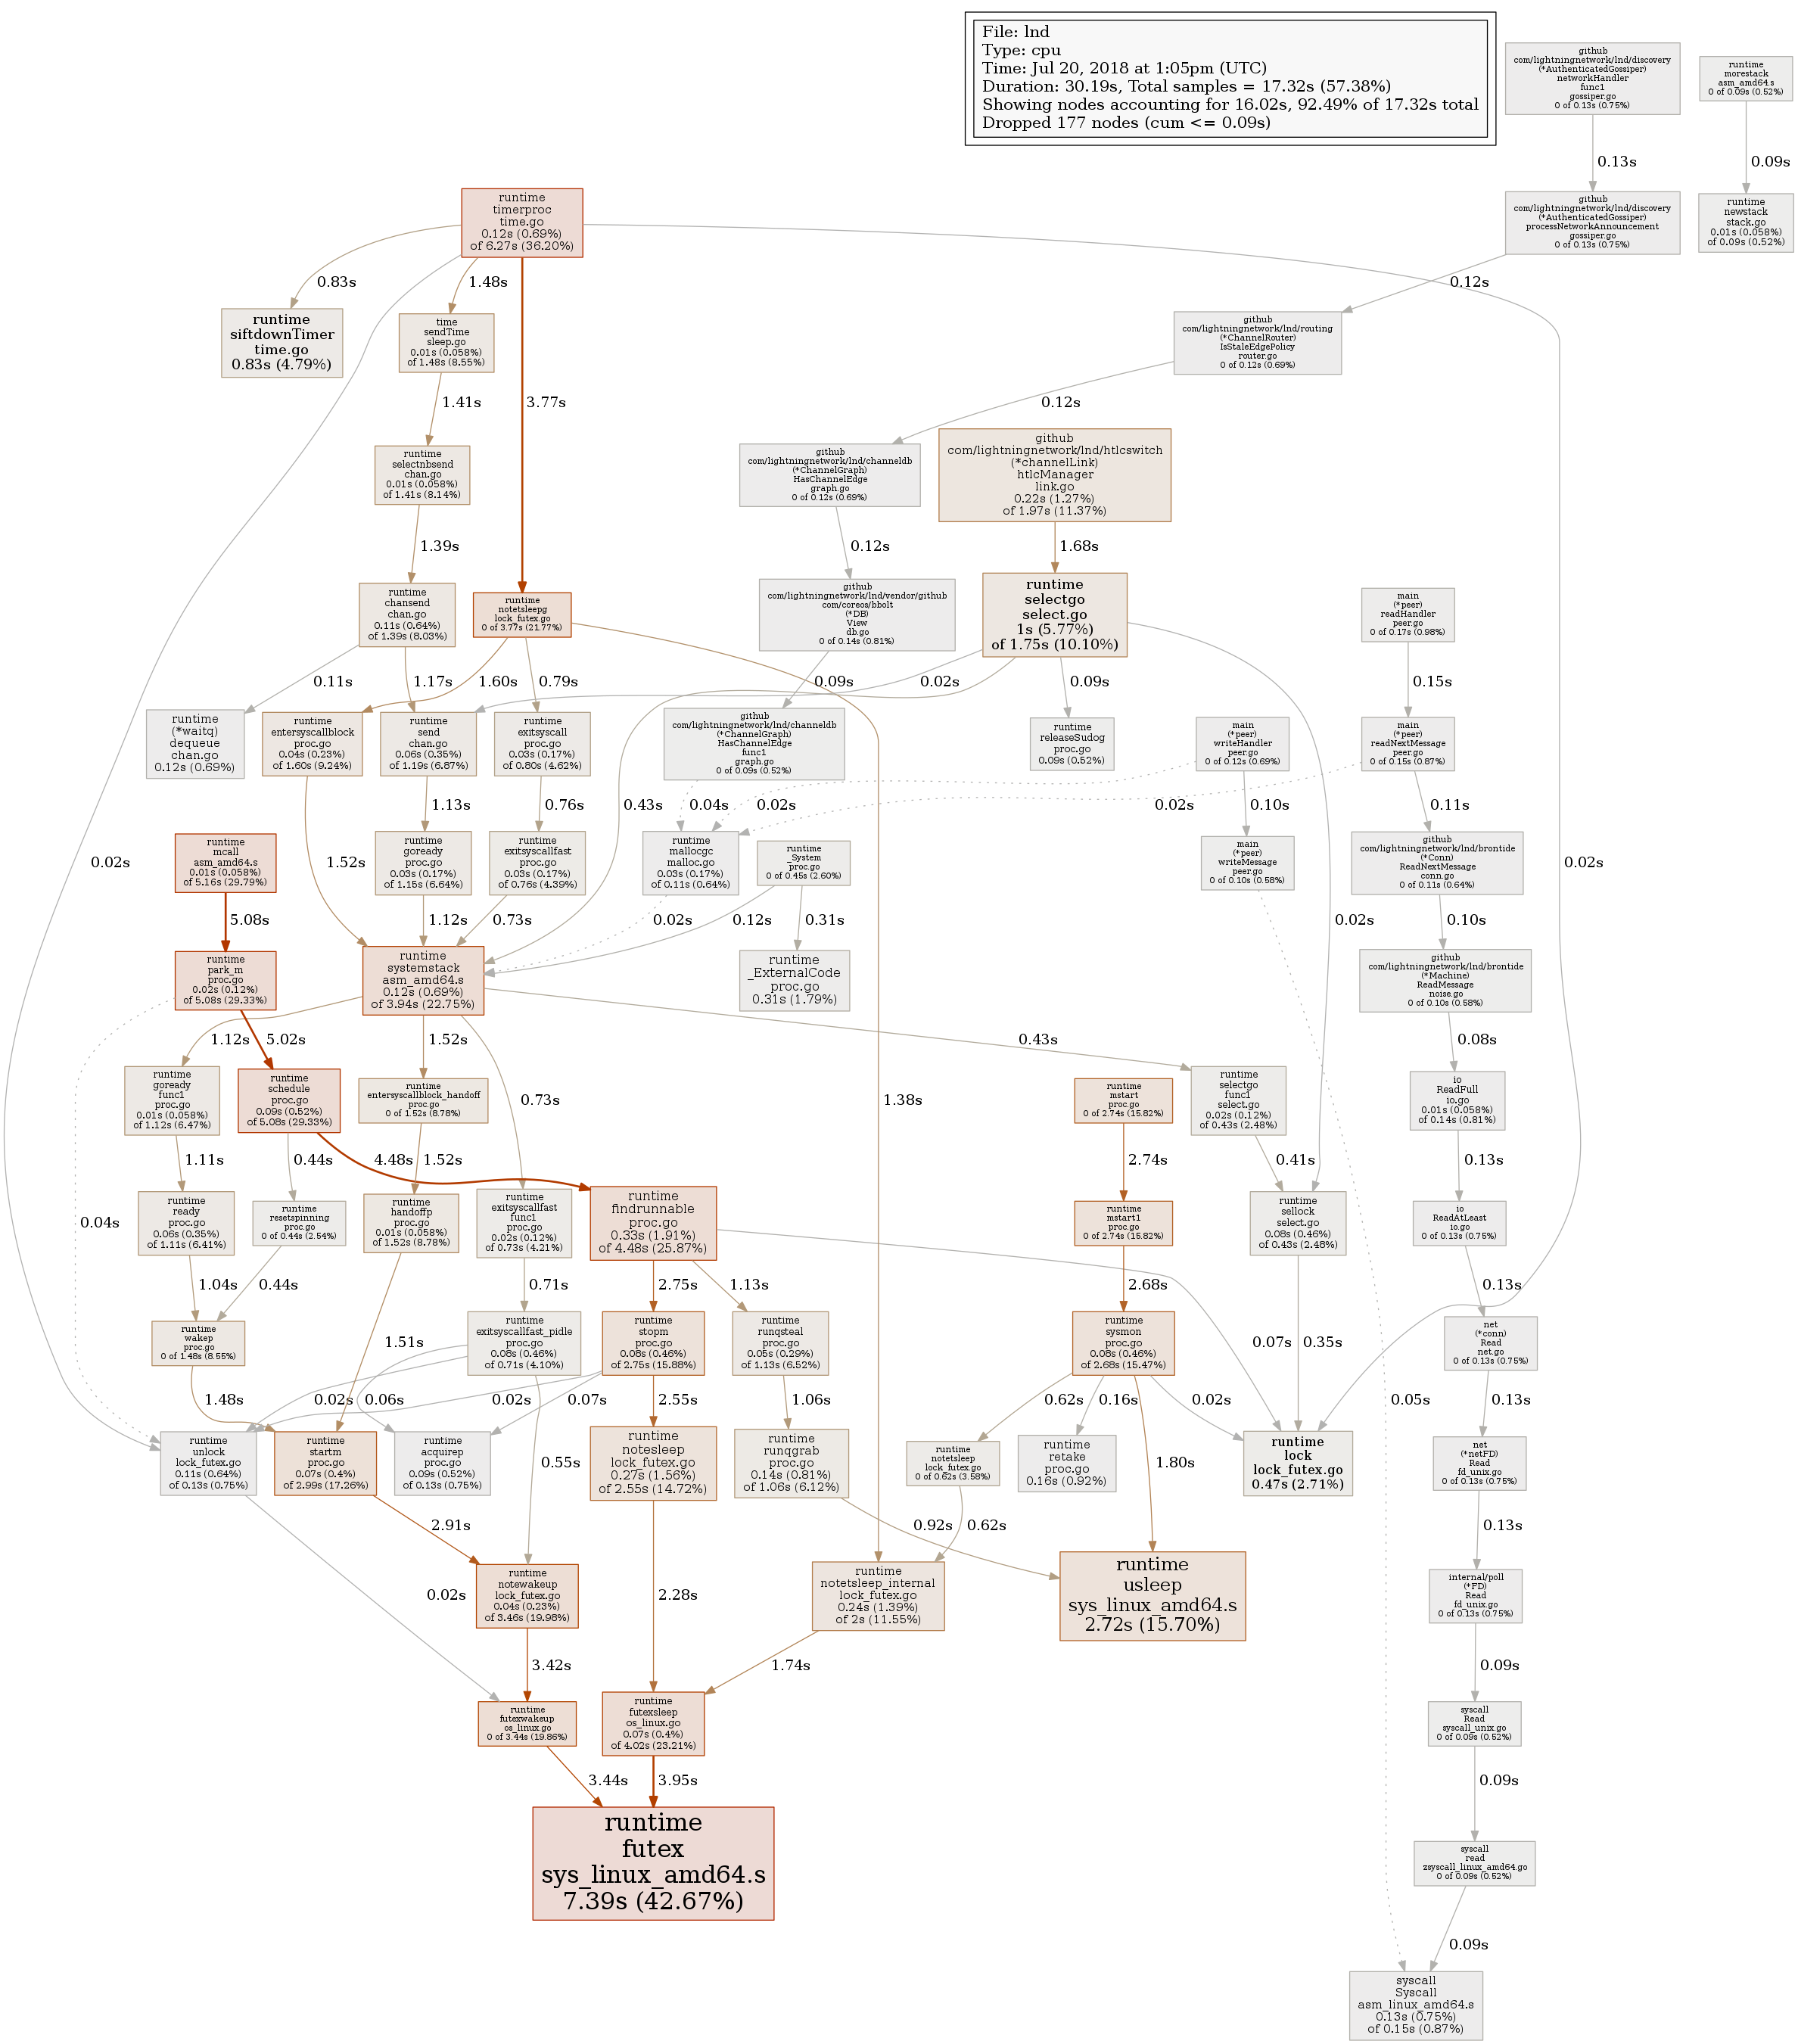
This is taken after ~2 hours of CPU time, when the load settled a bit (but it is still eating 2 CPU cores):
slush0
on 20 Jul 2018
If I understand it well, most of the time lnd spends in some autopilot logic. It may be relevant that my autopilot settings is max_channels=400. Current num_active_channels=237.
slush0
on 20 Jul 2018
After I turned autopilot off, and ~3 hours of lnd CPU time. Load is significantly lower as it dropped below 1. I wouldn't call this "high CPU usage" anymore (yet it is above proclaimed 5%).
Any idea what's taking so much resources in autopilot?
slush0
on 20 Jul 2018
Thanks for those profiles!
Yeah it looks like something is up with the autopilot agent, it shouldn't be using anywhere near that much CPU. What settings are you running with? So like the number of max channels, and so on? The agent itself is event driven, so it should only try again if: a new channel is closed, we modify our wallet balance, or a prior instance to open a channel failed for w/e reason. It should also continually prune away the set of candidate nodes if it repeatedly fails trying to attach to a particular set of nodes. So there's definitely a bug here.
If you do lncli debuglevel --level=ATPL=trace, do you see any interesting logs? Like the autopilot agent repeatedly failing to open a channel with the same peer, or anything like that?
The final trace looks more "normal-ish". It's dominated by links (channels) checking to see if there're any HTLCs that it needs to forward along. ATM, each links checks if their outstanding queue is greater than some threshold every 50ms or so. As the number of links grows, this starts to be a bit wasteful, as many times, a majority of the links aren't actually active at all. Rather than making it ticker based, this should also be event driven, where the link only wakes up if there're actually outgoing HTLCs to be sent in the queue.
Roasbeef
on 21 Jul 2018
What settings are you running with?
autopilot.active=1
autopilot.maxchannels=400
autopilot.minchansize=500000
autopilot.maxchansize=500000
If you do lncli debuglevel --level=ATPL=trace, do you see any interesting logs?
The log is repeatedly getting wall of messages like this (maybe 200 repeated messages in range of 3 seconds, then it stop for few minutes, then again):
2018-07-22 21:41:41.930 [DBG] ATPL: Reached cap of 10 pending channel opens, will retry after success/failure
2018-07-22 21:41:41.930 [DBG] ATPL: Reached cap of 10 pending channel opens, will retry after success/failure
2018-07-22 21:41:41.930 [DBG] ATPL: Reached cap of 10 pending channel opens, will retry after success/failure
as you can see, the line is printed many times per second.
The only other lines of autopilot logs so far were:
2018-07-22 21:45:24.909 [INF] ATPL: Processing new external signal
2018-07-22 21:45:24.909 [DBG] ATPL: Retrying after previous channel open failure.
2018-07-22 21:45:24.912 [DBG] ATPL: Pending channels: (map[autopilot.NodeID]autopilot.Channel) (len=10) {
2018-07-22 21:45:24.915 [INF] ATPL: Triggering attachment directive dispatch, total_funds=0.97507299 BTC
2018-07-22 21:45:24.925 [WRN] ATPL: Unable to open channel to 03aedc5302d3fa4c33eb84f98287a78268d0cdfa70624f7708664264880f6b482c of 0.005 BTC: Unable to connect to 03aedc5302d3fa4c33eb84f98287a78268d0cdfa70624f7708664264880f6b482c
ATM, each links checks if their outstanding queue is greater than some threshold every 50ms or so.
Should I open separate issue / feature request for this? As I'm aiming for node with hundreds or potentially thousands of channels, I'm highly interested in this optimization.
slush0
on 22 Jul 2018
After running lnd with ATPL=trace overnight, I see repeating pattern here.
There's wall of ~100 lines Reached cap of 10 pending channels opens, followed by Attempting to execute channel attachment directives, appearing in log every 3 minutes.
That message "reached cap of 10 channels" is quite strange BTW. There's currently one pending_open_channel and two pending_force_closing channels in my lncli listpendingchannels.
2018-07-23 07:15:42.345 [DBG] ATPL: Reached cap of 10 pending channel opens, will retry after success/failure
2018-07-23 07:15:42.346 [DBG] ATPL: Reached cap of 10 pending channel opens, will retry after success/failure
2018-07-23 07:15:42.346 [DBG] ATPL: Reached cap of 10 pending channel opens, will retry after success/failure
2018-07-23 07:15:42.347 [DBG] ATPL: Reached cap of 10 pending channel opens, will retry after success/failure
2018-07-23 07:15:42.347 [DBG] ATPL: Reached cap of 10 pending channel opens, will retry after success/failure
2018-07-23 07:15:42.347 [DBG] ATPL: Reached cap of 10 pending channel opens, will retry after success/failure
2018-07-23 07:15:42.347 [INF] ATPL: Processing new external signal
2018-07-23 07:15:42.348 [DBG] ATPL: New channel successfully opened, updating state with: (autopilot.Channel) {
2018-07-23 07:15:42.353 [DBG] ATPL: Pending channels: (map[autopilot.NodeID]autopilot.Channel) (len=10) {
2018-07-23 07:15:42.380 [INF] ATPL: Triggering attachment directive dispatch, total_funds=0.94161512 BTC
2018-07-23 07:18:35.117 [INF] ATPL: Attempting to execute channel attachment directives: ([]autopilot.AttachmentDirective) (len=111 cap=134) {
[autopilot] should only try again if: a new channel is closed, we modify our wallet balance, or a prior instance to open a channel failed for w/e reason.
I don't see any excessive closing of channels (one in last ~600 blocks), the balance seems to be same in between attempts (amount total_funds=0.97507299 BTC is still the same in repeating logs). I don't have enough tools/knowledge to tell if there're any misbehaving nodes; the log is very verbose with ~200 channels, but I don't know what's okay and what's not.
slush0
on 23 Jul 2018
After some digging into logs, I've found few peers (probably) behaving badly, sending some garbage, which ends up with closing the connection, and reopening in another second. I have open channel with this particular peer, which disconnects periodically every few minutes, so maybe events like this trigger autopilot?
2018-07-23 07:35:50.284 [INF] PEER: unable to read message from 75.158.148.125:51094: EOF
2018-07-23 07:35:50.340 [INF] DISC: Removing gossipSyncer for peer=02f3c9faf45c22821fab7884f64e2381bab40d928f03bc362706b03ec35b8fcc7d
2018-07-23 07:36:11.725 [INF] SRVR: New inbound connection from 75.158.148.125:51244
2018-07-23 07:36:11.725 [INF] SRVR: finalizing connection to 02f3c9faf45c22821fab7884f64e2381bab40d928f03bc362706b03ec35b8fcc7d, inbound=true
2018-07-23 07:36:11.756 [INF] PEER: NodeKey(02f3c9faf45c22821fab7884f64e2381bab40d928f03bc362706b03ec35b8fcc7d) loading ChannelPoint(47b8644df7bc4ec3191304f1c2653e5b78d8b4a6c067432201aca13bb65b4ad5:1)
2018-07-23 07:36:11.768 [INF] SRVR: Requesting full table sync with 02f3c9faf45c22821fab7884f64e2381bab40d928f03bc362706b03ec35b8fcc7d
2018-07-23 07:36:13.070 [INF] DISC: Syncing channel graph state with 02f3c9faf45c22821fab7884f64e2381bab40d928f03bc362706b03ec35b8fcc7d, sending 1464 vertexes and 7406 edges
2018-07-23 07:36:46.287 [INF] ATPL: Attempting to execute channel attachment directives: ([]autopilot.AttachmentDirective) (len=111 cap=134) {
   (*net.TCPAddr)(0xc4280f6e40)(75.158.148.125:9735)
slush0
on 23 Jul 2018
Maybe not relevant, but after settingdebuglevel=PEER=debug I also found out there's intensive communication between peers. Like hundreds of actions per second. I have no idea if this is normal or not though:
2018-07-23 09:52:09.679 [DBG] PEER: Received ChannelUpdate(chain_hash=000000000019d6689c085ae165831e934ff763ae46a2a6c172b3f1b60a8ce26f, short_chan_id=583188663973183488, flag=2, update_time=2018-07-23 09:52:04 +0000 UTC) from 50.3.73.103:9736
2018-07-23 09:52:09.826 [DBG] PEER: Received ChannelUpdate(chain_hash=000000000019d6689c085ae165831e934ff763ae46a2a6c172b3f1b60a8ce26f, short_chan_id=577462407449018368, flag=0, update_time=2018-07-23 09:52:05 +0000 UTC) from 213.136.87.165:9735
2018-07-23 09:52:09.827 [DBG] PEER: Received ChannelUpdate(chain_hash=000000000019d6689c085ae165831e934ff763ae46a2a6c172b3f1b60a8ce26f, short_chan_id=571895580133490689, flag=3, update_time=2018-07-23 09:51:47 +0000 UTC) from 213.136.87.165:9735
2018-07-23 09:52:09.828 [DBG] PEER: Received ChannelUpdate(chain_hash=000000000019d6689c085ae165831e934ff763ae46a2a6c172b3f1b60a8ce26f, short_chan_id=569199577643155457, flag=1, update_time=2018-07-23 09:51:51 +0000 UTC) from 213.136.87.165:9735
2018-07-23 09:52:09.829 [DBG] PEER: Received ChannelUpdate(chain_hash=000000000019d6689c085ae165831e934ff763ae46a2a6c172b3f1b60a8ce26f, short_chan_id=577462407449870336, flag=1, update_time=2018-07-23 09:52:02 +0000 UTC) from 213.136.87.165:9735
2018-07-23 09:52:09.829 [DBG] PEER: Received ChannelUpdate(chain_hash=000000000019d6689c085ae165831e934ff763ae46a2a6c172b3f1b60a8ce26f, short_chan_id=586227714135031808, flag=0, update_time=2018-07-23 09:51:13 +0000 UTC) from 213.136.87.165:9735
2018-07-23 09:52:09.846 [DBG] PEER: Received ChannelUpdate(chain_hash=000000000019d6689c085ae165831e934ff763ae46a2a6c172b3f1b60a8ce26f, short_chan_id=586235410827247616, flag=2, update_time=2018-07-23 09:51:33 +0000 UTC) from 213.136.87.165:9735
2018-07-23 09:52:09.846 [DBG] PEER: Received ChannelUpdate(chain_hash=000000000019d6682018-07-23 09:52:09.679 [DBG] PEER: Received ChannelUpdate(chain_hash=000000000019d6689c085ae165831e934ff763ae46a2a6c172b3f1b60a8ce26f, short_chan_id=583188663973183488, flag=2, update_time=2018-07-23 09:52:04 +0000 UTC) from 50.3.73.103:9736
2018-07-23 09:52:09.826 [DBG] PEER: Received ChannelUpdate(chain_hash=000000000019d6689c085ae165831e934ff763ae46a2a6c172b3f1b60a8ce26f, short_chan_id=577462407449018368, flag=0, update_time=2018-07-23 09:52:05 +0000 UTC) from 213.136.87.165:9735
2018-07-23 09:52:09.827 [DBG] PEER: Received ChannelUpdate(chain_hash=000000000019d6689c085ae165831e934ff763ae46a2a6c172b3f1b60a8ce26f, short_chan_id=571895580133490689, flag=3, update_time=2018-07-23 09:51:47 +0000 UTC) from 213.136.87.165:9735
2018-07-23 09:52:09.828 [DBG] PEER: Received ChannelUpdate(chain_hash=000000000019d6689c085ae165831e934ff763ae46a2a6c172b3f1b60a8ce26f, short_chan_id=569199577643155457, flag=1, update_time=2018-07-23 09:51:51 +0000 UTC) from 213.136.87.165:9735
2018-07-23 09:52:09.829 [DBG] PEER: Received ChannelUpdate(chain_hash=000000000019d6689c085ae165831e934ff763ae46a2a6c172b3f1b60a8ce26f, short_chan_id=577462407449870336, flag=1, update_time=2018-07-23 09:52:02 +0000 UTC) from 213.136.87.165:9735
2018-07-23 09:52:09.829 [DBG] PEER: Received ChannelUpdate(chain_hash=000000000019d6689c085ae165831e934ff763ae46a2a6c172b3f1b60a8ce26f, short_chan_id=586227714135031808, flag=0, update_time=2018-07-23 09:51:13 +0000 UTC) from 213.136.87.165:9735
2018-07-23 09:52:09.846 [DBG] PEER: Received ChannelUpdate(chain_hash=000000000019d6689c085ae165831e934ff763ae46a2a6c172b3f1b60a8ce26f, short_chan_id=586235410827247616, flag=2, update_time=2018-07-23 09:51:33 +0000 UTC) from 213.136.87.165:9735
2018-07-23 09:52:09.846 [DBG] PEER: Received ChannelUpdate(chain_hash=000000000019d6689c085ae165831e934ff763ae46a2a6c172b3f1b60a8ce26f, short_chan_id=567352398053376000, flag=2, update_time=2018-07-23 09:52:00 +0000 UTC) from 213.136.87.165:9735
2018-07-23 09:52:09.846 [DBG] PEER: Received ChannelUpdate(chain_hash=000000000019d6689c085ae165831e934ff763ae46a2a6c172b3f1b60a8ce26f, short_chan_id=583188663973183488, flag=3, update_time=2018-07-23 09:51:48 +0000 UTC) from 213.136.87.165:9735
2018-07-23 09:52:09.846 [DBG] PEER: Received ChannelUpdate(chain_hash=000000000019d6689c085ae165831e934ff763ae46a2a6c172b3f1b60a8ce26f, short_chan_id=584195816661581824, flag=3, update_time=2018-07-23 09:51:49 +0000 UTC) from 213.136.87.165:9735
2018-07-23 09:52:09.847 [DBG] PEER: Received ChannelUpdate(chain_hash=000000000019d6689c085ae165831e934ff763ae46a2a6c172b3f1b60a8ce26f, short_chan_id=567352398053376000, flag=3, update_time=2018-07-23 09:51:48 +0000 UTC) from 213.136.87.165:9735
2018-07-23 09:52:09.847 [DBG] PEER: Received ChannelUpdate(chain_hash=000000000019d6689c085ae165831e934ff763ae46a2a6c172b3f1b60a8ce26f, short_chan_id=583188663973183488, flag=2, update_time=2018-07-23 09:52:04 +0000 UTC) from 213.136.87.165:9735
2018-07-23 09:52:09.847 [DBG] PEER: Received ChannelUpdate(chain_hash=000000000019d6689c085ae165831e934ff763ae46a2a6c172b3f1b60a8ce26f, short_chan_id=577464606492459008, flag=1, update_time=2018-07-23 09:52:01 +0000 UTC) from 213.136.87.165:9735
2018-07-23 09:52:09.847 [DBG] PEER: Received ChannelUpdate(chain_hash=000000000019d6689c085ae165831e934ff763ae46a2a6c172b3f1b60a8ce26f, short_chan_id=579942905640321025, flag=0, update_time=2018-07-23 09:51:52 +0000 UTC) from 213.136.87.165:9735
9c085ae165831e934ff763ae46a2a6c172b3f1b60a8ce26f, short_chan_id=567352398053376000, flag=2, update_time=2018-07-23 09:52:00 +0000 UTC) from 213.136.87.165:9735
2018-07-23 09:52:09.846 [DBG] PEER: Received ChannelUpdate(chain_hash=000000000019d6689c085ae165831e934ff763ae46a2a6c172b3f1b60a8ce26f, short_chan_id=583188663973183488, flag=3, update_time=2018-07-23 09:51:48 +0000 UTC) from 213.136.87.165:9735
2018-07-23 09:52:09.846 [DBG] PEER: Received ChannelUpdate(chain_hash=000000000019d6689c085ae165831e934ff763ae46a2a6c172b3f1b60a8ce26f, short_chan_id=584195816661581824, flag=3, update_time=2018-07-23 09:51:49 +0000 UTC) from 213.136.87.165:9735
2018-07-23 09:52:09.847 [DBG] PEER: Received ChannelUpdate(chain_hash=000000000019d6689c085ae165831e934ff763ae46a2a6c172b3f1b60a8ce26f, short_chan_id=567352398053376000, flag=3, update_time=2018-07-23 09:51:48 +0000 UTC) from 213.136.87.165:9735
2018-07-23 09:52:09.847 [DBG] PEER: Received ChannelUpdate(chain_hash=000000000019d6689c085ae165831e934ff763ae46a2a6c172b3f1b60a8ce26f, short_chan_id=583188663973183488, flag=2, update_time=2018-07-23 09:52:04 +0000 UTC) from 213.136.87.165:9735
2018-07-23 09:52:09.847 [DBG] PEER: Received ChannelUpdate(chain_hash=000000000019d6689c085ae165831e934ff763ae46a2a6c172b3f1b60a8ce26f, short_chan_id=577464606492459008, flag=1, update_time=2018-07-23 09:52:01 +0000 UTC) from 213.136.87.165:9735
2018-07-23 09:52:09.847 [DBG] PEER: Received ChannelUpdate(chain_hash=000000000019d6689c085ae165831e934ff763ae46a2a6c172b3f1b60a8ce26f, short_chan_id=579942905640321025, flag=0, update_time=2018-07-23 09:51:52 +0000 UTC) from 213.136.87.165:9735
slush0
on 23 Jul 2018
autopilot.maxchannels=400
In the short term, I'd lower that target as there aren't even that many active _listening_ nodes according to my crawler which currently feeds the DNS seeds.
2018-07-22 21:41:41.930 [DBG] ATPL: Reached cap of 10 pending channel opens, will retry after success/failure
Yeah so there's currently a hard coded limit of 10 pending channels at a time. If you have more channels than that pending, then it can't proceed opening more channels. That should ideally also be lifted into a configuration value.
I don't see any excessive closing of channels (one in last ~600 blocks), the balance seems to be same in between attempts
Yeah there aren't may channel closings happening, but your node has more or less already exhausted all the active listening nodes. So seems it's continually trying to connect out to nodes that aren't even listening in the first place.
That message "reached cap of 10 channels" is quite strange BTW. There's currently one pending_open_channel and two pending_force_closing channels
A channel becomes pending open once we _attempt_ to connect to a node to open a channel within the book keeping of the current agent. A connection attempt may take a few seconds to timeout or just fail for w/e reason depending on the peer. So what's happening is that there're a few hundred goroutines, which continually fail and then retry (without a backoff atm, there should be one), as there literally aren't enough peers to connect to atm.
As I'm aiming for node with hundreds or potentially thousands of channels, I'm highly interested in this optimization.
What type of CPU utilization are you seeing ideally w/o autopilot? Thousands of channels would take some time even as there aren't even 1k listening nodes on the network. But yeah an issue would be nice, it's something we're aware of, but are tackling higher priority items instead atm.
Maybe not relevant, but after settingdebuglevel=PEER=debug
Yeah those are basically just spammy peers. After #1183 is done, we'll just ban them all together. Also, as a routing node, you really _don't_ need any channel updates at all. It's actually possible for you to opt out of them all together (thereby reducing bandwidth) by using this option:
--nochanupdates If specified, lnd will not request real-time channel updates from connected peers. This option should be used by routing nodes to save bandwidth.
OK, just to recap (thanks again for the detailed investigation!) it appears the issue is due to having a very high-ish value for the number of max channels relative to the number of nodes that are actually listening on the network. In the short term, this can be mitigated by using a smaller value.
The actual bug seems to be that we should also further narrow out potential candidates by first doing a reachability test (just connecting with their pubkey) to ensure that they're actually eligible candidates. As is now, many pending channels slots are actually taken up by failed connection attempts, rather than active channels that are awaiting confirmation.
Roasbeef
on 24 Jul 2018
Updated the issue and added some relevant labels based on the discussion above.
Roasbeef
on 24 Jul 2018
Thank you for your valuable insights, highly appreciated!
What type of CPU utilization are you seeing ideally w/o autopilot?
I understand that current state of code is not very optimized for high-performance setup, which is completely understandable. So I'm more or less reporting bottlenecks which I'm finding out with my setup. I'm sure #1183 as well as optimizations in autopilot to not wasting CPU cycles on goroutines will eventually improve performance of the setup like mine.
Anecdotally, in recent days CPU load of my setup dropped about 1/3 although the node has 2x more channels than in time of opening this issue.
slush0
on 25 Jul 2018
PR with the optimization (for the switch) I mentioned is up now: https://github.com/lightningnetwork/lnd/pull/1659! This should dramatically reduce idle CPU usage for nodes with a larger number of channels.
Roasbeef
on 31 Jul 2018
It seems that the load from autopilot is really gone (yay!), however, the CPU load didn't drop. Actually the feel is that lncli is even less responsible than before. From new profile output it seems the process is busy on another part of code, somehow related to talking with bitcoind. Because I see changes in bitcoind communication in recent commits, I suppose this may be related.
My bitcoind is local, is fully synced and there's no obvious reason for heavy communication and 100%+ CPU load.
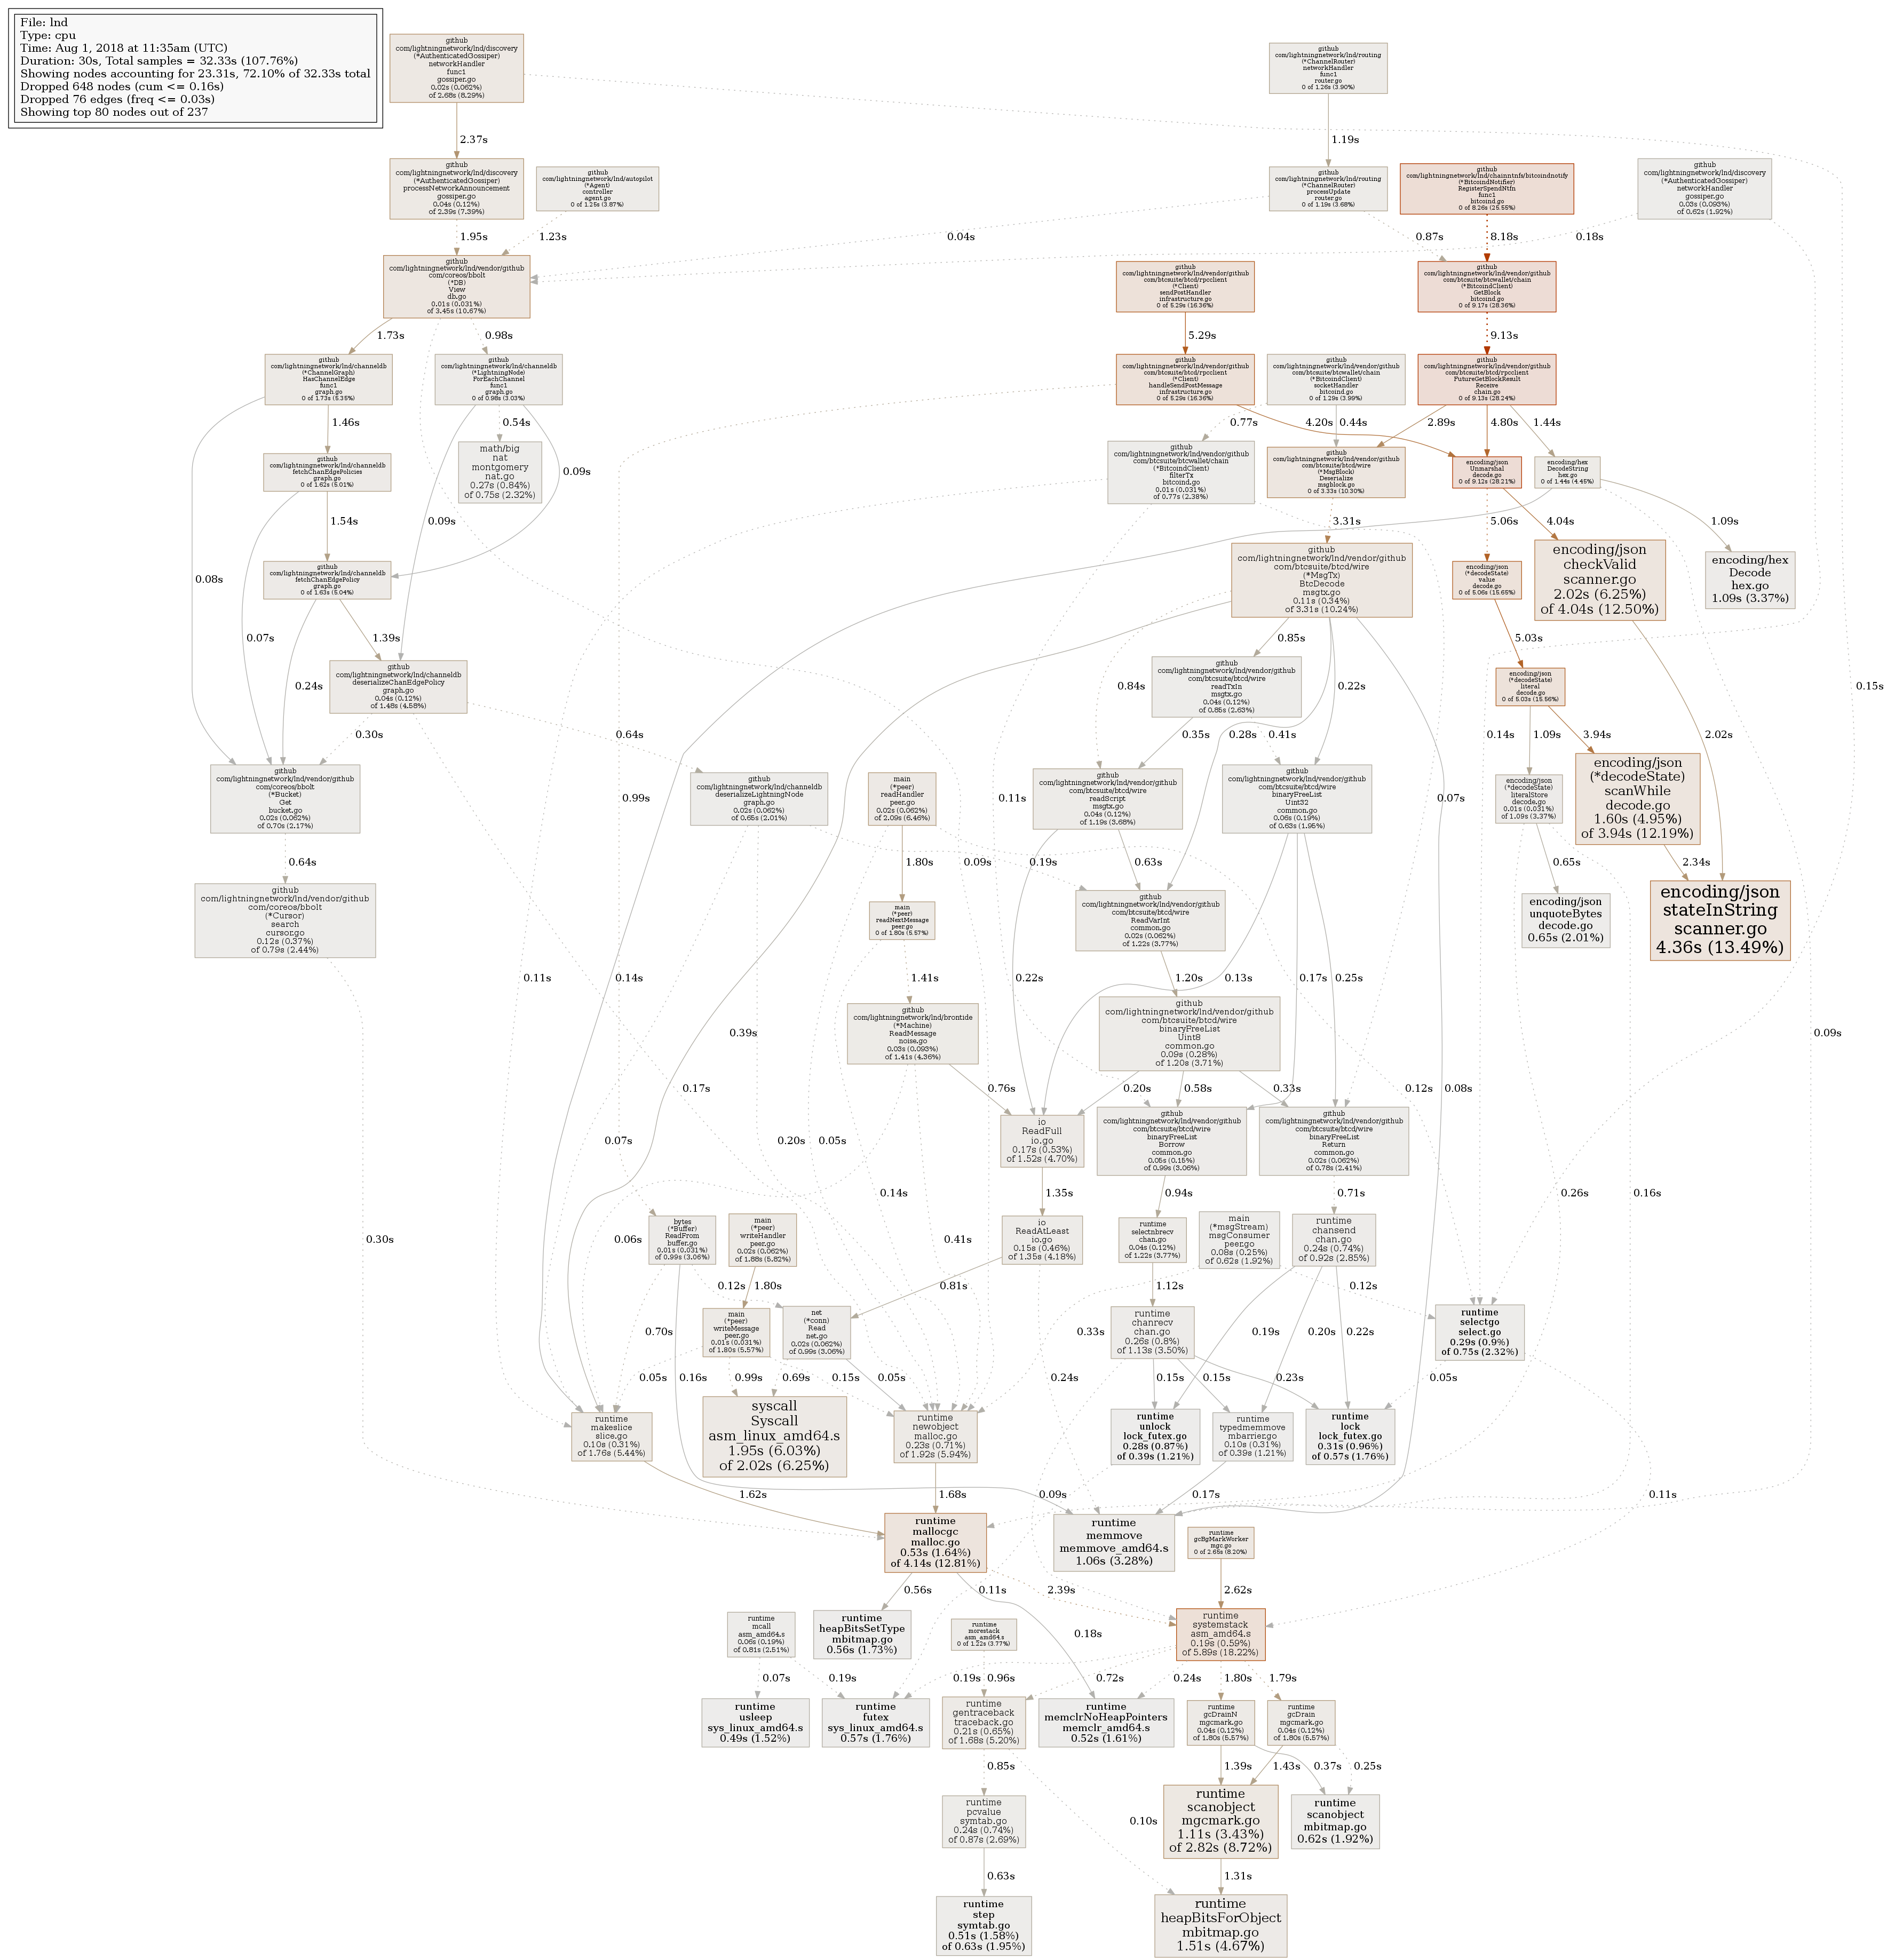
slush0
on 1 Aug 2018
After changing debug level to notice, I don't see anything suspicious re-bitcoind communication. Actually the node seems pretty idle (but CPU isn't).
slush0
on 1 Aug 2018
After a while, load of lnd dropped down significantly. While I'm still interested in explaining of the last pprof output, I'm closing this particular issue as autopilot seems to work fine even with many channels open.
slush0
on 1 Aug 2018
From looking at the profile, just looks like you have a couple (several?) old-ish channels that have been forced closed. Since bitcoind's RPC interface is so primitive, we're forced to scan blocks to find _where_ the channel was closed at. That explains the activity you're seeing there.
Roasbeef
on 1 Aug 2018
Btw, after few days I was AFK, my node load is ~0.5 (while maintaining ~500 open channels), so all my CPU-related issues has been successfully solved.
slush0
on 7 Aug 2018
Nice! Glad to here our optimizations are having direct impact. We've also received other reports from users that restart time has been dramatically reduced. The one PR we're still waiting to land is the PR which allows peer connections (the handshake) to be async rather than sync. This is the source (we think) or the slow connection re-establish post restart.
Roasbeef
on 8 Aug 2018
Related issues
 joostjager
·
3Comments
joostjager
·
3Comments
 alexbosworth
·
3Comments
Roasbeef
·
3Comments
alexbosworth
·
3Comments
Roasbeef
·
3Comments
 alec-djinn
·
3Comments
alec-djinn
·
3Comments
 pm47
·
3Comments
pm47
·
3Comments